
|
|||||
|
 | |
| |
| |
| |
| |
| |
|
Gene: POLD3 |
Gene summary for POLD3 |
| Gene information | Species | Human | Gene symbol | POLD3 | Gene ID | 10714 |
| Gene name | DNA polymerase delta 3, accessory subunit | |
| Gene Alias | P66 | |
| Cytomap | 11q13.4 | |
| Gene Type | protein-coding | GO ID | GO:0000731 | UniProtAcc | A0A024R5M8 |
Top |
Malignant transformation analysis |
| Identification of the aberrant gene expression in precancerous and cancerous lesions by comparing the gene expression of stem-like cells in diseased tissues with normal stem cells |
| Entrez ID | Symbol | Replicates | Species | Organ | Tissue | Adj P-value | Log2FC | Malignancy |
| 10714 | POLD3 | P56T-E | Human | Esophagus | ESCC | 1.10e-03 | 2.60e-01 | 0.1613 |
| 10714 | POLD3 | P57T-E | Human | Esophagus | ESCC | 3.54e-09 | 1.27e-01 | 0.0926 |
| 10714 | POLD3 | P61T-E | Human | Esophagus | ESCC | 2.42e-03 | 7.38e-02 | 0.099 |
| 10714 | POLD3 | P62T-E | Human | Esophagus | ESCC | 6.87e-26 | 4.77e-01 | 0.1302 |
| 10714 | POLD3 | P65T-E | Human | Esophagus | ESCC | 1.47e-05 | 1.25e-01 | 0.0978 |
| 10714 | POLD3 | P74T-E | Human | Esophagus | ESCC | 2.13e-33 | 7.38e-01 | 0.1479 |
| 10714 | POLD3 | P75T-E | Human | Esophagus | ESCC | 2.71e-19 | 4.54e-01 | 0.1125 |
| 10714 | POLD3 | P76T-E | Human | Esophagus | ESCC | 1.08e-17 | 3.54e-01 | 0.1207 |
| 10714 | POLD3 | P79T-E | Human | Esophagus | ESCC | 1.41e-13 | 3.09e-01 | 0.1154 |
| 10714 | POLD3 | P80T-E | Human | Esophagus | ESCC | 3.02e-11 | 3.02e-01 | 0.155 |
| 10714 | POLD3 | P82T-E | Human | Esophagus | ESCC | 5.95e-17 | 6.20e-01 | 0.1072 |
| 10714 | POLD3 | P83T-E | Human | Esophagus | ESCC | 3.38e-25 | 8.01e-01 | 0.1738 |
| 10714 | POLD3 | P89T-E | Human | Esophagus | ESCC | 6.10e-11 | 4.94e-01 | 0.1752 |
| 10714 | POLD3 | P91T-E | Human | Esophagus | ESCC | 9.39e-10 | 6.55e-01 | 0.1828 |
| 10714 | POLD3 | P104T-E | Human | Esophagus | ESCC | 4.14e-03 | 2.14e-01 | 0.0931 |
| 10714 | POLD3 | P107T-E | Human | Esophagus | ESCC | 4.70e-29 | 5.95e-01 | 0.171 |
| 10714 | POLD3 | P127T-E | Human | Esophagus | ESCC | 8.43e-07 | 1.22e-01 | 0.0826 |
| 10714 | POLD3 | P128T-E | Human | Esophagus | ESCC | 3.42e-23 | 6.06e-01 | 0.1241 |
| 10714 | POLD3 | P130T-E | Human | Esophagus | ESCC | 1.06e-19 | 5.66e-01 | 0.1676 |
| 10714 | POLD3 | C04 | Human | Oral cavity | OSCC | 7.43e-07 | 4.62e-01 | 0.2633 |
| Page: 1 2 3 4 |
| Tissue | Expression Dynamics | Abbreviation |
| Esophagus | 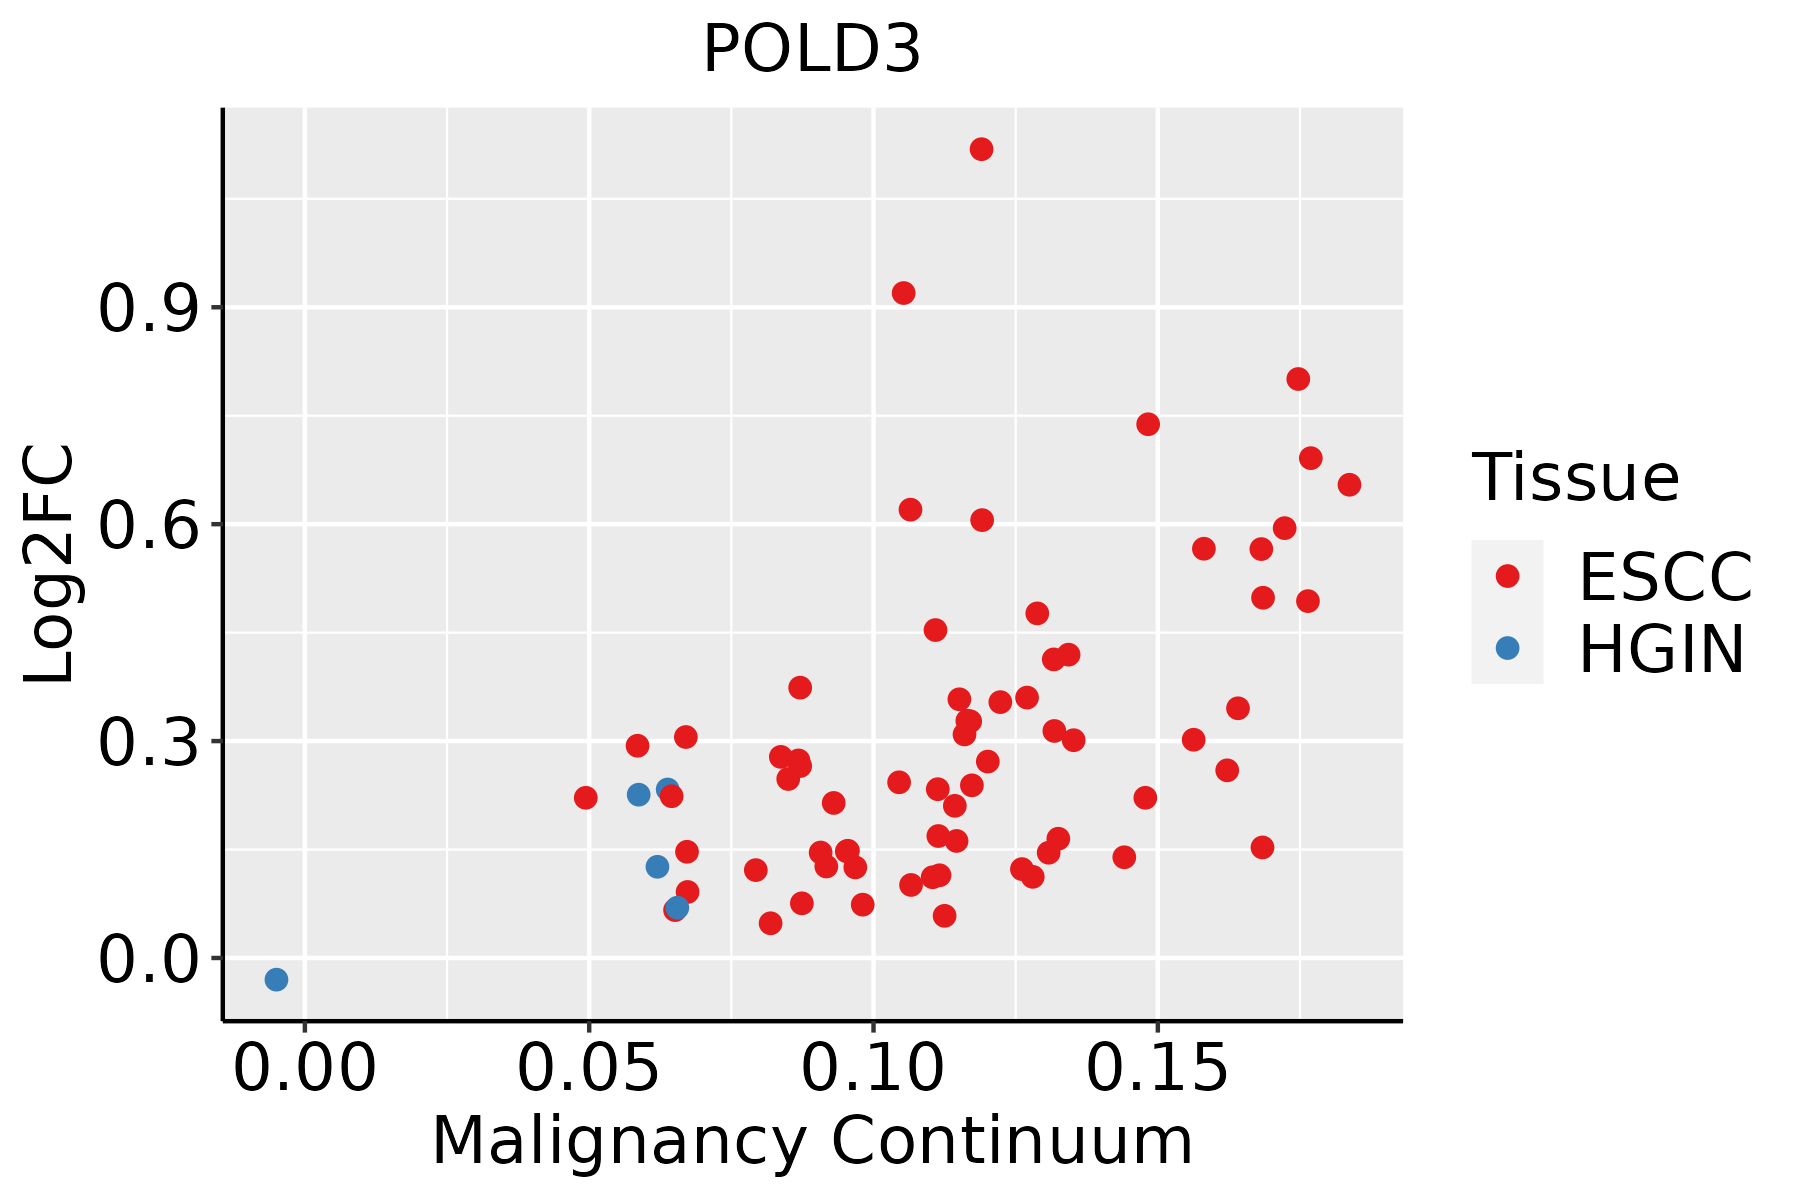 | ESCC: Esophageal squamous cell carcinoma |
| HGIN: High-grade intraepithelial neoplasias | ||
| LGIN: Low-grade intraepithelial neoplasias | ||
| Oral Cavity | 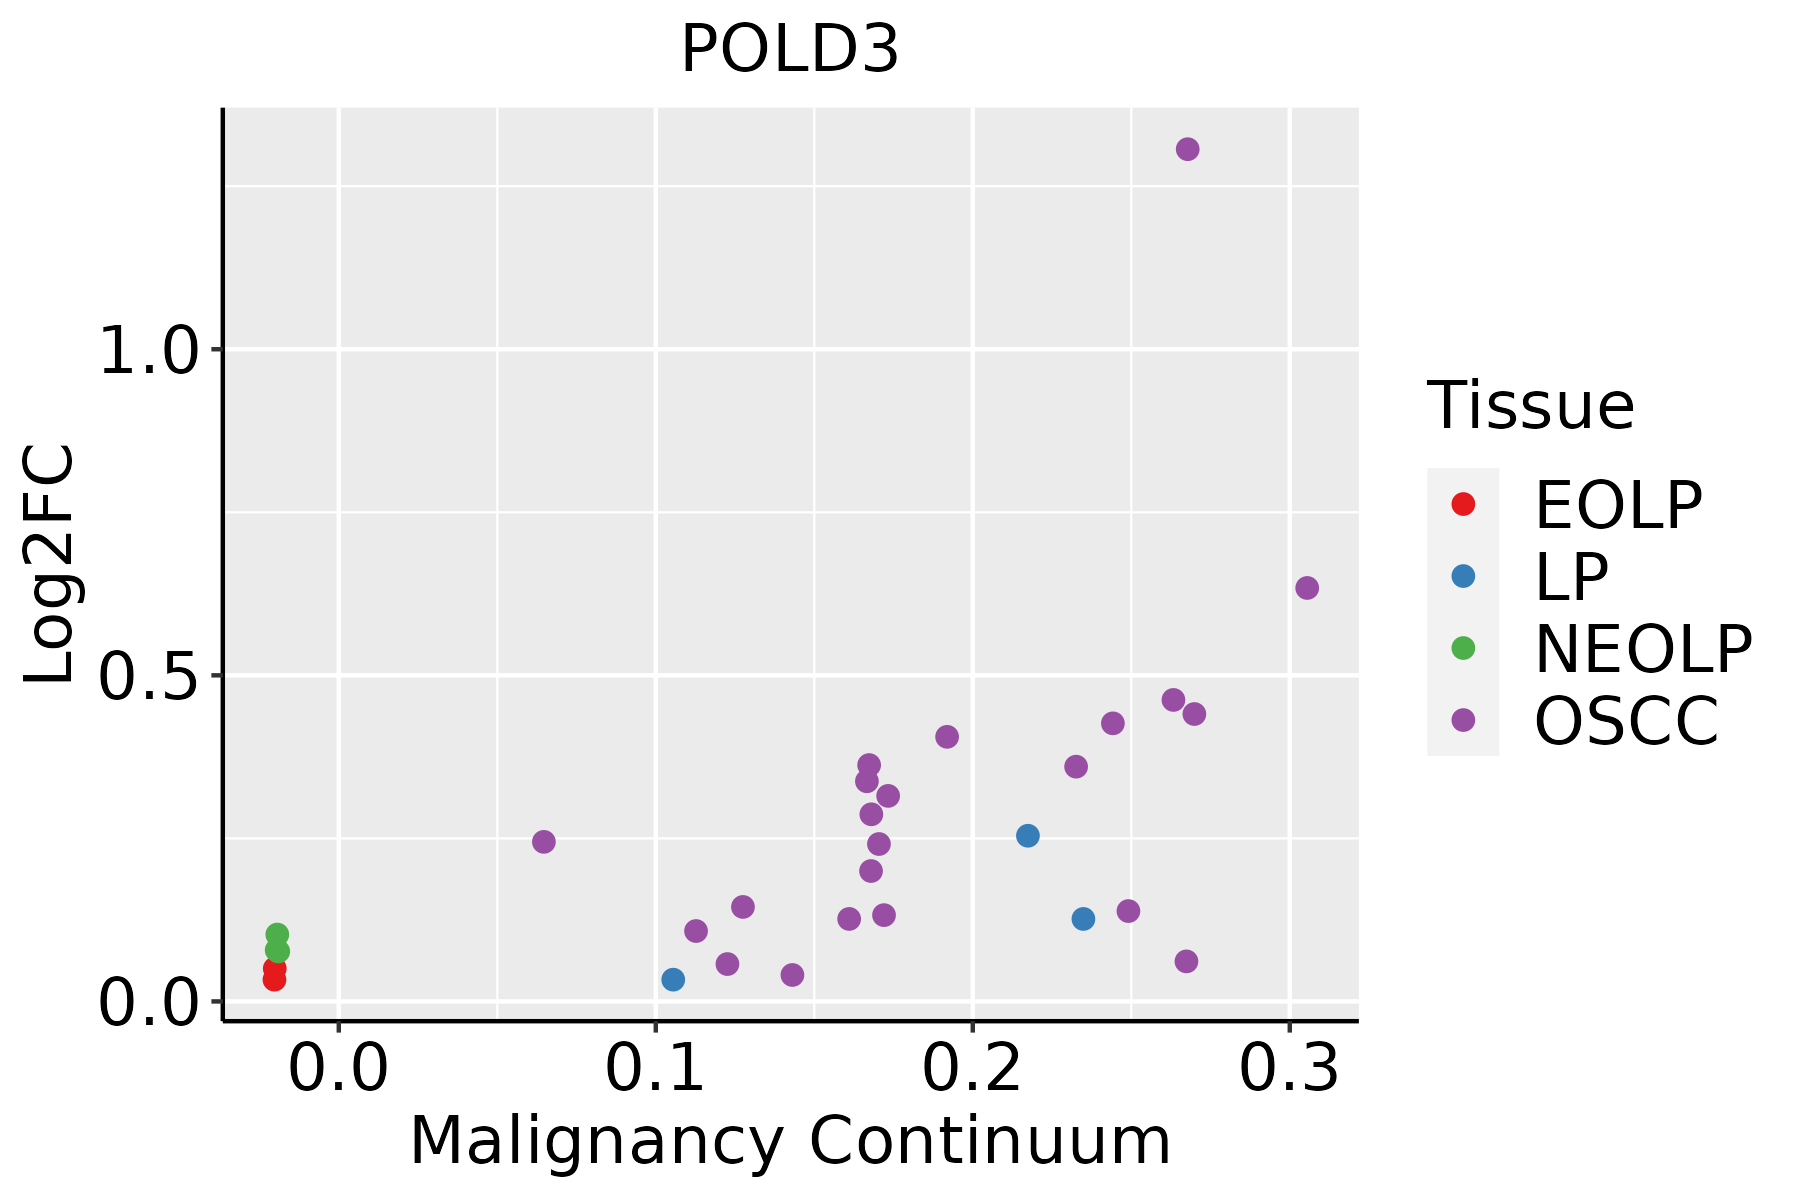 | EOLP: Erosive Oral lichen planus |
| LP: leukoplakia | ||
| NEOLP: Non-erosive oral lichen planus | ||
| OSCC: Oral squamous cell carcinoma |
| ∗log2FC in expression of this searched gene in stem-like cells from each diseased tissue sample relative to stem-like cells in normal samples in each tissue plotted against the malignancy continuum. Samples are colored based on if they are from different disease stage. |
Top |
Malignant transformation related pathway analysis |
| Find out the enriched GO biological processes and KEGG pathways involved in transition from healthy to precancer to cancer |
| Tissue | Disease Stage | Enriched GO biological Processes |
| Colorectum | AD |  |
| Colorectum | SER |  |
| Colorectum | MSS |  |
| Colorectum | MSI-H |  |
| Colorectum | FAP |  |
| ∗Top 15 enriched GO BP terms are showed in the bar plot of each disease state in each tissue. Each row represents a significant GO biological process which is colored according to the -log10(p.adjust). |
| Page: 1 2 3 4 5 6 7 8 9 |
| GO ID | Tissue | Disease Stage | Description | Gene Ratio | Bg Ratio | pvalue | p.adjust | Count |
| GO:007189710 | Esophagus | HGIN | DNA biosynthetic process | 44/2587 | 180/18723 | 8.97e-05 | 1.96e-03 | 44 |
| GO:000931418 | Esophagus | HGIN | response to radiation | 88/2587 | 456/18723 | 6.26e-04 | 8.65e-03 | 88 |
| GO:00714789 | Esophagus | HGIN | cellular response to radiation | 42/2587 | 186/18723 | 7.66e-04 | 1.00e-02 | 42 |
| GO:00094115 | Esophagus | HGIN | response to UV | 35/2587 | 149/18723 | 9.71e-04 | 1.22e-02 | 35 |
| GO:007121418 | Esophagus | HGIN | cellular response to abiotic stimulus | 66/2587 | 331/18723 | 1.21e-03 | 1.45e-02 | 66 |
| GO:010400418 | Esophagus | HGIN | cellular response to environmental stimulus | 66/2587 | 331/18723 | 1.21e-03 | 1.45e-02 | 66 |
| GO:00346445 | Esophagus | HGIN | cellular response to UV | 23/2587 | 90/18723 | 2.16e-03 | 2.25e-02 | 23 |
| GO:00094165 | Esophagus | HGIN | response to light stimulus | 61/2587 | 320/18723 | 5.20e-03 | 4.30e-02 | 61 |
| GO:00062892 | Esophagus | HGIN | nucleotide-excision repair | 16/2587 | 60/18723 | 6.22e-03 | 4.95e-02 | 16 |
| GO:000941113 | Esophagus | ESCC | response to UV | 115/8552 | 149/18723 | 3.29e-15 | 1.93e-13 | 115 |
| GO:00062604 | Esophagus | ESCC | DNA replication | 181/8552 | 260/18723 | 3.55e-15 | 2.05e-13 | 181 |
| GO:007189716 | Esophagus | ESCC | DNA biosynthetic process | 127/8552 | 180/18723 | 1.04e-11 | 3.85e-10 | 127 |
| GO:000931419 | Esophagus | ESCC | response to radiation | 277/8552 | 456/18723 | 4.42e-11 | 1.43e-09 | 277 |
| GO:003464413 | Esophagus | ESCC | cellular response to UV | 70/8552 | 90/18723 | 4.59e-10 | 1.20e-08 | 70 |
| GO:007121419 | Esophagus | ESCC | cellular response to abiotic stimulus | 206/8552 | 331/18723 | 7.52e-10 | 1.88e-08 | 206 |
| GO:010400419 | Esophagus | ESCC | cellular response to environmental stimulus | 206/8552 | 331/18723 | 7.52e-10 | 1.88e-08 | 206 |
| GO:007147816 | Esophagus | ESCC | cellular response to radiation | 122/8552 | 186/18723 | 3.07e-08 | 5.73e-07 | 122 |
| GO:00062612 | Esophagus | ESCC | DNA-dependent DNA replication | 100/8552 | 151/18723 | 2.61e-07 | 3.94e-06 | 100 |
| GO:000941611 | Esophagus | ESCC | response to light stimulus | 183/8552 | 320/18723 | 2.03e-05 | 1.76e-04 | 183 |
| GO:00062891 | Esophagus | ESCC | nucleotide-excision repair | 42/8552 | 60/18723 | 1.18e-04 | 8.14e-04 | 42 |
| Page: 1 2 |
| Pathway ID | Tissue | Disease Stage | Description | Gene Ratio | Bg Ratio | pvalue | p.adjust | qvalue | Count |
| hsa034205 | Esophagus | HGIN | Nucleotide excision repair | 29/1383 | 63/8465 | 2.96e-08 | 5.36e-07 | 4.26e-07 | 29 |
| hsa0342012 | Esophagus | HGIN | Nucleotide excision repair | 29/1383 | 63/8465 | 2.96e-08 | 5.36e-07 | 4.26e-07 | 29 |
| hsa0342022 | Esophagus | ESCC | Nucleotide excision repair | 54/4205 | 63/8465 | 2.01e-09 | 2.17e-08 | 1.11e-08 | 54 |
| hsa034104 | Esophagus | ESCC | Base excision repair | 38/4205 | 44/8465 | 3.59e-07 | 2.62e-06 | 1.34e-06 | 38 |
| hsa030304 | Esophagus | ESCC | DNA replication | 32/4205 | 36/8465 | 7.71e-07 | 5.06e-06 | 2.59e-06 | 32 |
| hsa034304 | Esophagus | ESCC | Mismatch repair | 21/4205 | 23/8465 | 2.85e-05 | 1.35e-04 | 6.90e-05 | 21 |
| hsa0342032 | Esophagus | ESCC | Nucleotide excision repair | 54/4205 | 63/8465 | 2.01e-09 | 2.17e-08 | 1.11e-08 | 54 |
| hsa0341011 | Esophagus | ESCC | Base excision repair | 38/4205 | 44/8465 | 3.59e-07 | 2.62e-06 | 1.34e-06 | 38 |
| hsa0303011 | Esophagus | ESCC | DNA replication | 32/4205 | 36/8465 | 7.71e-07 | 5.06e-06 | 2.59e-06 | 32 |
| hsa0343011 | Esophagus | ESCC | Mismatch repair | 21/4205 | 23/8465 | 2.85e-05 | 1.35e-04 | 6.90e-05 | 21 |
| hsa034204 | Oral cavity | OSCC | Nucleotide excision repair | 49/3704 | 63/8465 | 3.48e-08 | 2.91e-07 | 1.48e-07 | 49 |
| hsa03030 | Oral cavity | OSCC | DNA replication | 31/3704 | 36/8465 | 1.70e-07 | 1.19e-06 | 6.03e-07 | 31 |
| hsa03410 | Oral cavity | OSCC | Base excision repair | 32/3704 | 44/8465 | 9.11e-05 | 3.25e-04 | 1.65e-04 | 32 |
| hsa03430 | Oral cavity | OSCC | Mismatch repair | 19/3704 | 23/8465 | 1.55e-04 | 5.34e-04 | 2.72e-04 | 19 |
| hsa0342011 | Oral cavity | OSCC | Nucleotide excision repair | 49/3704 | 63/8465 | 3.48e-08 | 2.91e-07 | 1.48e-07 | 49 |
| hsa030301 | Oral cavity | OSCC | DNA replication | 31/3704 | 36/8465 | 1.70e-07 | 1.19e-06 | 6.03e-07 | 31 |
| hsa034101 | Oral cavity | OSCC | Base excision repair | 32/3704 | 44/8465 | 9.11e-05 | 3.25e-04 | 1.65e-04 | 32 |
| hsa034301 | Oral cavity | OSCC | Mismatch repair | 19/3704 | 23/8465 | 1.55e-04 | 5.34e-04 | 2.72e-04 | 19 |
| Page: 1 |
Top |
Cell-cell communication analysis |
| Identification of potential cell-cell interactions between two cell types and their ligand-receptor pairs for different disease states |
| Ligand | Receptor | LRpair | Pathway | Tissue | Disease Stage |
| Page: 1 |
Top |
Single-cell gene regulatory network inference analysis |
| Find out the significant the regulons (TFs) and the target genes of each regulon across cell types for different disease states |
| TF | Cell Type | Tissue | Disease Stage | Target Gene | RSS | Regulon Activity |
| ∗The dot plots of a searched regulon are shown for all cell subpopulations in each disease state of each tissue based on the regulon specific score inferred using pySCENIC and by calculating the average expression. |
| Page: 1 |
Top |
Somatic mutation of malignant transformation related genes |
| Annotation of somatic variants for genes involved in malignant transformation |
| Hugo Symbol | Variant Class | Variant Classification | dbSNP RS | HGVSc | HGVSp | HGVSp Short | SWISSPROT | BIOTYPE | SIFT | PolyPhen | Tumor Sample Barcode | Tissue | Histology | Sex | Age | Stage | Therapy Types | Drugs | Outcome |
| POLD3 | SNV | Missense_Mutation | novel | c.960N>C | p.Lys320Asn | p.K320N | Q15054 | protein_coding | deleterious(0) | probably_damaging(0.999) | TCGA-A2-A0CL-01 | Breast | breast invasive carcinoma | Female | <65 | III/IV | Chemotherapy | cytoxan | SD |
| POLD3 | insertion | In_Frame_Ins | novel | c.1356_1357insTAT | p.Lys452_Ala453insTyr | p.K452_A453insY | Q15054 | protein_coding | TCGA-AO-A128-01 | Breast | breast invasive carcinoma | Female | <65 | I/II | Chemotherapy | doxorubicin | SD | ||
| POLD3 | SNV | Missense_Mutation | novel | c.758N>T | p.Ser253Leu | p.S253L | Q15054 | protein_coding | tolerated(0.16) | possibly_damaging(0.551) | TCGA-4J-AA1J-01 | Cervix | cervical & endocervical cancer | Female | <65 | I/II | Unknown | Unknown | SD |
| POLD3 | SNV | Missense_Mutation | c.472N>C | p.Ser158Pro | p.S158P | Q15054 | protein_coding | tolerated(0.25) | benign(0.003) | TCGA-EK-A2RK-01 | Cervix | cervical & endocervical cancer | Female | >=65 | I/II | Unknown | Unknown | SD | |
| POLD3 | SNV | Missense_Mutation | novel | c.986C>G | p.Ser329Cys | p.S329C | Q15054 | protein_coding | deleterious(0.01) | probably_damaging(0.999) | TCGA-JX-A3Q0-01 | Cervix | cervical & endocervical cancer | Female | <65 | III/IV | Unknown | Unknown | SD |
| POLD3 | SNV | Missense_Mutation | rs150870592 | c.1148G>A | p.Arg383Gln | p.R383Q | Q15054 | protein_coding | deleterious(0) | probably_damaging(0.998) | TCGA-A6-6141-01 | Colorectum | colon adenocarcinoma | Male | <65 | I/II | Chemotherapy | 5-fu | SD |
| POLD3 | SNV | Missense_Mutation | rs762619624 | c.674N>A | p.Gly225Asp | p.G225D | Q15054 | protein_coding | tolerated(0.26) | benign(0.272) | TCGA-AA-3672-01 | Colorectum | colon adenocarcinoma | Female | >=65 | III/IV | Unknown | Unknown | SD |
| POLD3 | SNV | Missense_Mutation | rs150870592 | c.1148N>A | p.Arg383Gln | p.R383Q | Q15054 | protein_coding | deleterious(0) | probably_damaging(0.998) | TCGA-AA-3984-01 | Colorectum | colon adenocarcinoma | Female | <65 | I/II | Unknown | Unknown | SD |
| POLD3 | SNV | Missense_Mutation | novel | c.146G>A | p.Arg49Gln | p.R49Q | Q15054 | protein_coding | tolerated(0.08) | benign(0.281) | TCGA-AZ-4315-01 | Colorectum | colon adenocarcinoma | Male | <65 | I/II | Unknown | Unknown | SD |
| POLD3 | SNV | Missense_Mutation | novel | c.252N>C | p.Lys84Asn | p.K84N | Q15054 | protein_coding | deleterious(0.01) | benign(0.207) | TCGA-CA-6717-01 | Colorectum | colon adenocarcinoma | Male | <65 | I/II | Chemotherapy | oxaliplatin | CR |
| Page: 1 2 3 4 5 |
Top |
Related drugs of malignant transformation related genes |
| Identification of chemicals and drugs interact with genes involved in malignant transfromation |
| (DGIdb 4.0) |
| Entrez ID | Symbol | Category | Interaction Types | Drug Claim Name | Drug Name | PMIDs |
| Page: 1 |

Copyright 2023-Present -The University of Texas Health Science Center at Houston |