
|
|||||
|
 | |
| |
| |
| |
| |
| |
|
Gene: PLTP |
Gene summary for PLTP |
| Gene information | Species | Human | Gene symbol | PLTP | Gene ID | 5360 |
| Gene name | phospholipid transfer protein | |
| Gene Alias | BPIFE | |
| Cytomap | 20q13.12 | |
| Gene Type | protein-coding | GO ID | GO:0000003 | UniProtAcc | P55058 |
Top |
Malignant transformation analysis |
| Identification of the aberrant gene expression in precancerous and cancerous lesions by comparing the gene expression of stem-like cells in diseased tissues with normal stem cells |
| Entrez ID | Symbol | Replicates | Species | Organ | Tissue | Adj P-value | Log2FC | Malignancy |
| 5360 | PLTP | P27T-E | Human | Esophagus | ESCC | 2.68e-28 | 7.43e-01 | 0.1055 |
| 5360 | PLTP | P28T-E | Human | Esophagus | ESCC | 4.38e-02 | -1.81e-01 | 0.1149 |
| 5360 | PLTP | P30T-E | Human | Esophagus | ESCC | 1.79e-13 | 1.04e+00 | 0.137 |
| 5360 | PLTP | P31T-E | Human | Esophagus | ESCC | 6.28e-56 | 1.55e+00 | 0.1251 |
| 5360 | PLTP | P37T-E | Human | Esophagus | ESCC | 5.86e-11 | 5.68e-01 | 0.1371 |
| 5360 | PLTP | P38T-E | Human | Esophagus | ESCC | 1.22e-07 | 8.57e-01 | 0.127 |
| 5360 | PLTP | P39T-E | Human | Esophagus | ESCC | 4.49e-05 | -2.87e-01 | 0.0894 |
| 5360 | PLTP | P40T-E | Human | Esophagus | ESCC | 3.64e-03 | 4.30e-01 | 0.109 |
| 5360 | PLTP | P42T-E | Human | Esophagus | ESCC | 5.80e-13 | 6.43e-01 | 0.1175 |
| 5360 | PLTP | P47T-E | Human | Esophagus | ESCC | 1.41e-31 | 1.14e+00 | 0.1067 |
| 5360 | PLTP | P48T-E | Human | Esophagus | ESCC | 4.36e-09 | 2.62e-01 | 0.0959 |
| 5360 | PLTP | P49T-E | Human | Esophagus | ESCC | 6.74e-18 | 2.82e+00 | 0.1768 |
| 5360 | PLTP | P52T-E | Human | Esophagus | ESCC | 1.52e-32 | 1.35e+00 | 0.1555 |
| 5360 | PLTP | P54T-E | Human | Esophagus | ESCC | 3.27e-35 | 1.45e+00 | 0.0975 |
| 5360 | PLTP | P56T-E | Human | Esophagus | ESCC | 1.80e-06 | 1.39e+00 | 0.1613 |
| 5360 | PLTP | P57T-E | Human | Esophagus | ESCC | 5.42e-13 | 1.05e+00 | 0.0926 |
| 5360 | PLTP | P61T-E | Human | Esophagus | ESCC | 1.17e-08 | 4.99e-01 | 0.099 |
| 5360 | PLTP | P62T-E | Human | Esophagus | ESCC | 4.58e-34 | 9.07e-01 | 0.1302 |
| 5360 | PLTP | P65T-E | Human | Esophagus | ESCC | 8.21e-18 | 7.08e-01 | 0.0978 |
| 5360 | PLTP | P74T-E | Human | Esophagus | ESCC | 3.03e-26 | 1.30e+00 | 0.1479 |
| Page: 1 2 3 4 5 6 |
| Tissue | Expression Dynamics | Abbreviation |
| Endometrium | 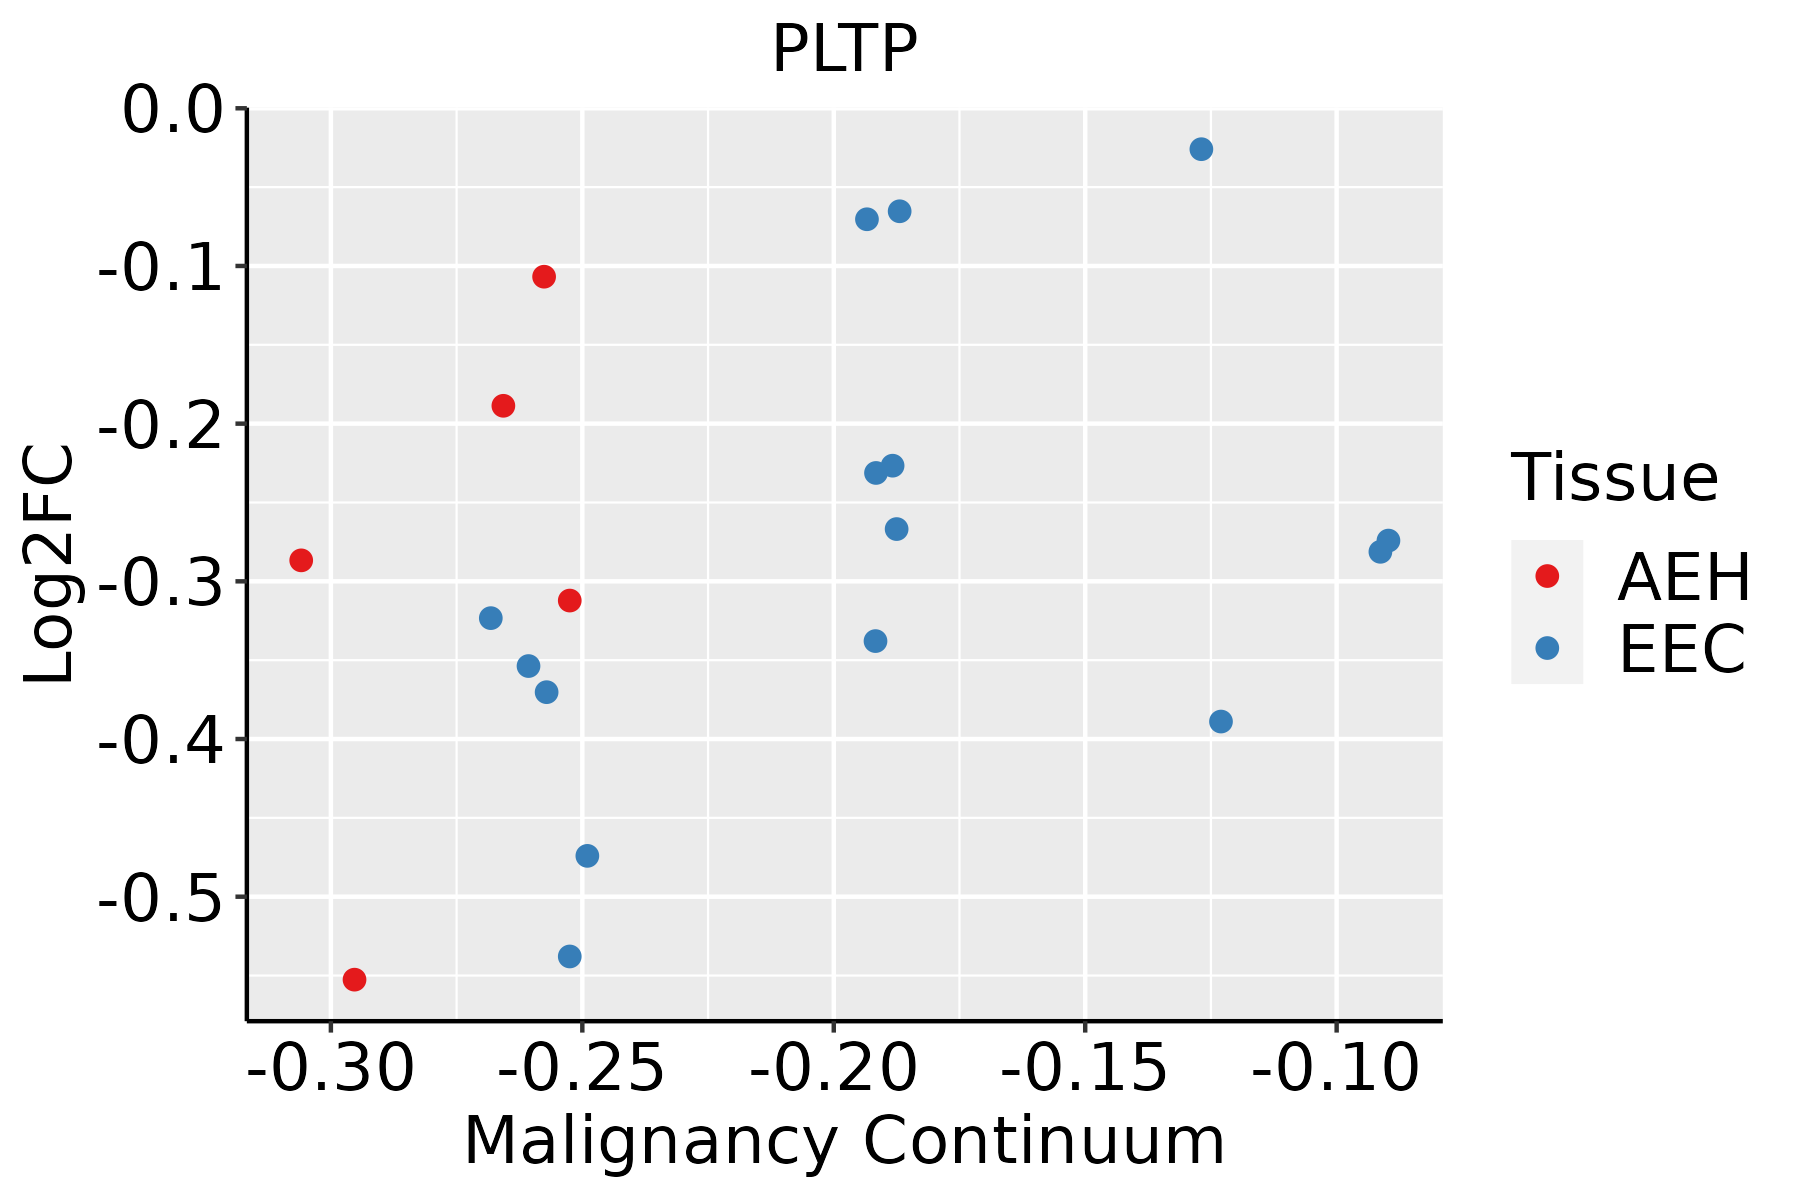 | AEH: Atypical endometrial hyperplasia |
| EEC: Endometrioid Cancer | ||
| Esophagus | 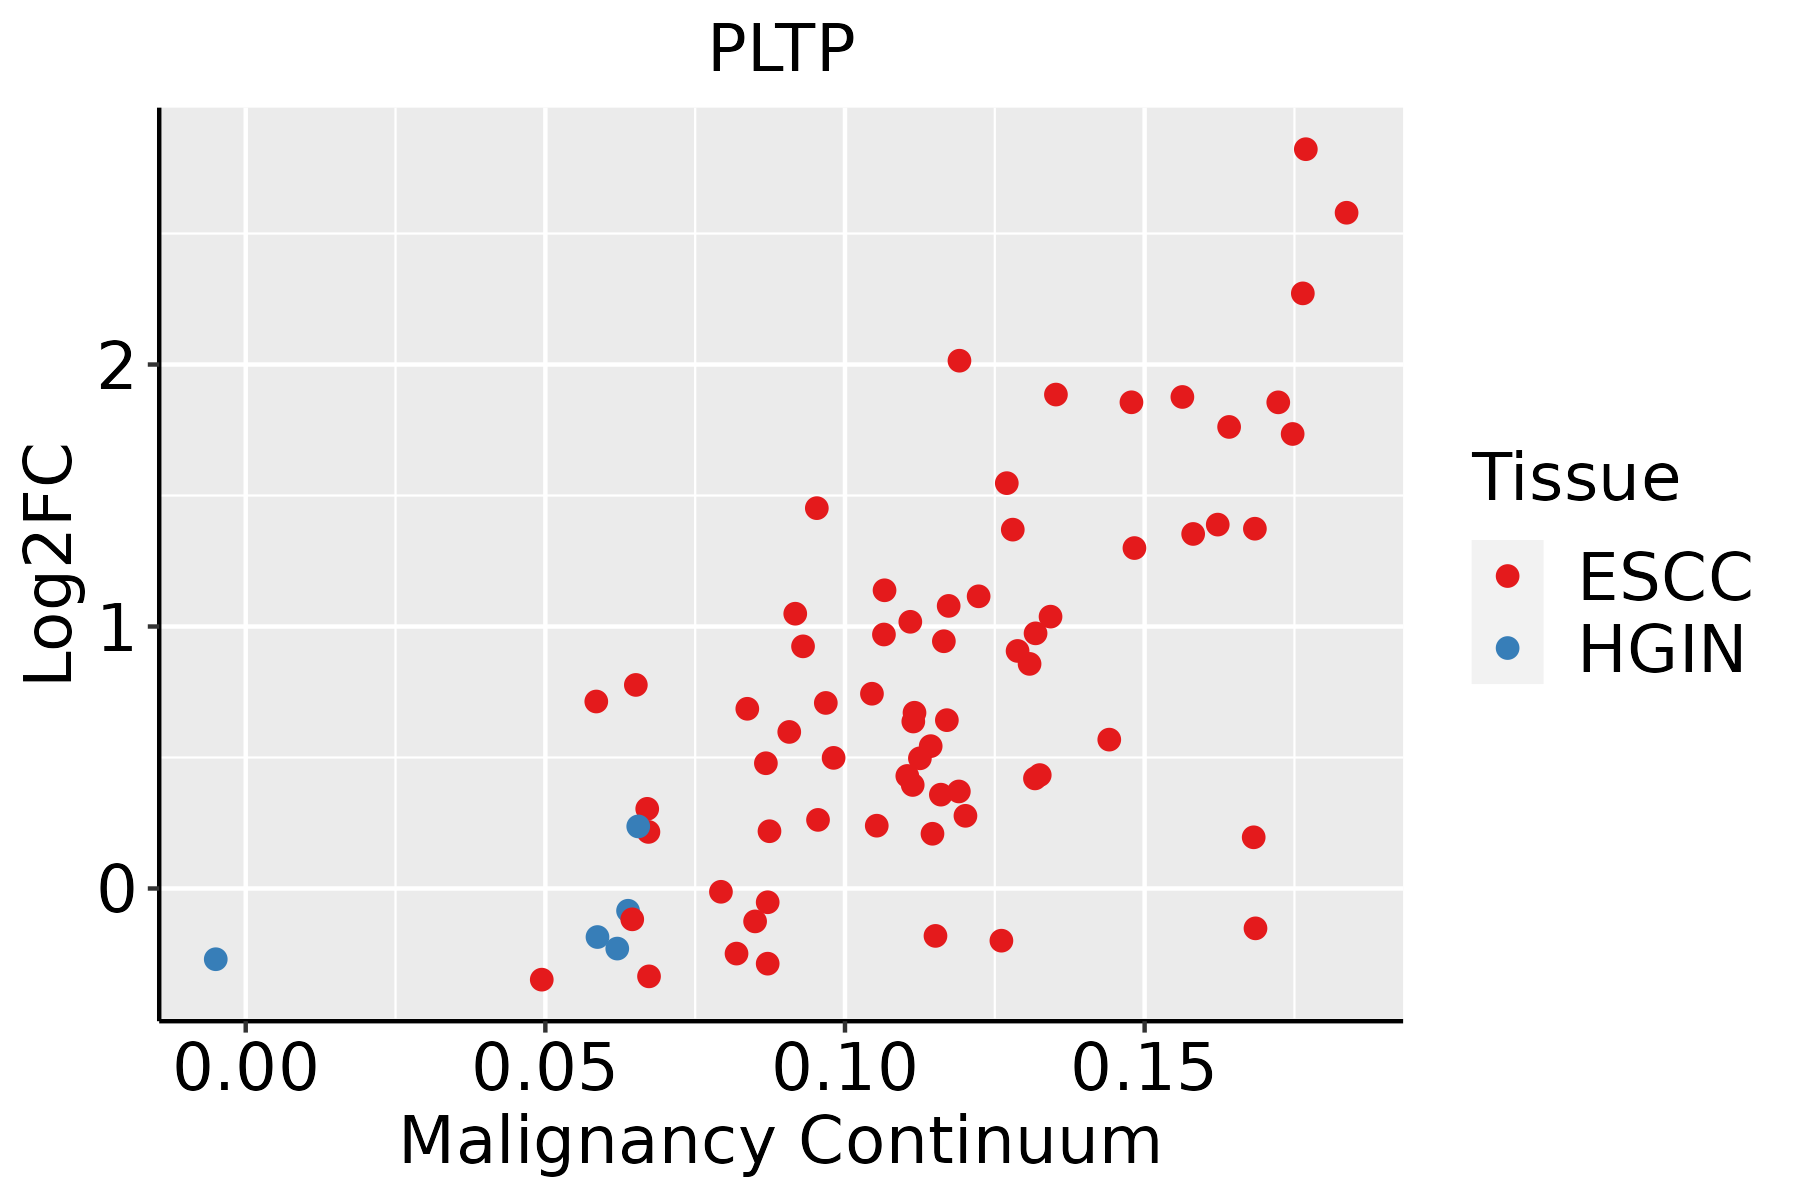 | ESCC: Esophageal squamous cell carcinoma |
| HGIN: High-grade intraepithelial neoplasias | ||
| LGIN: Low-grade intraepithelial neoplasias | ||
| Liver | 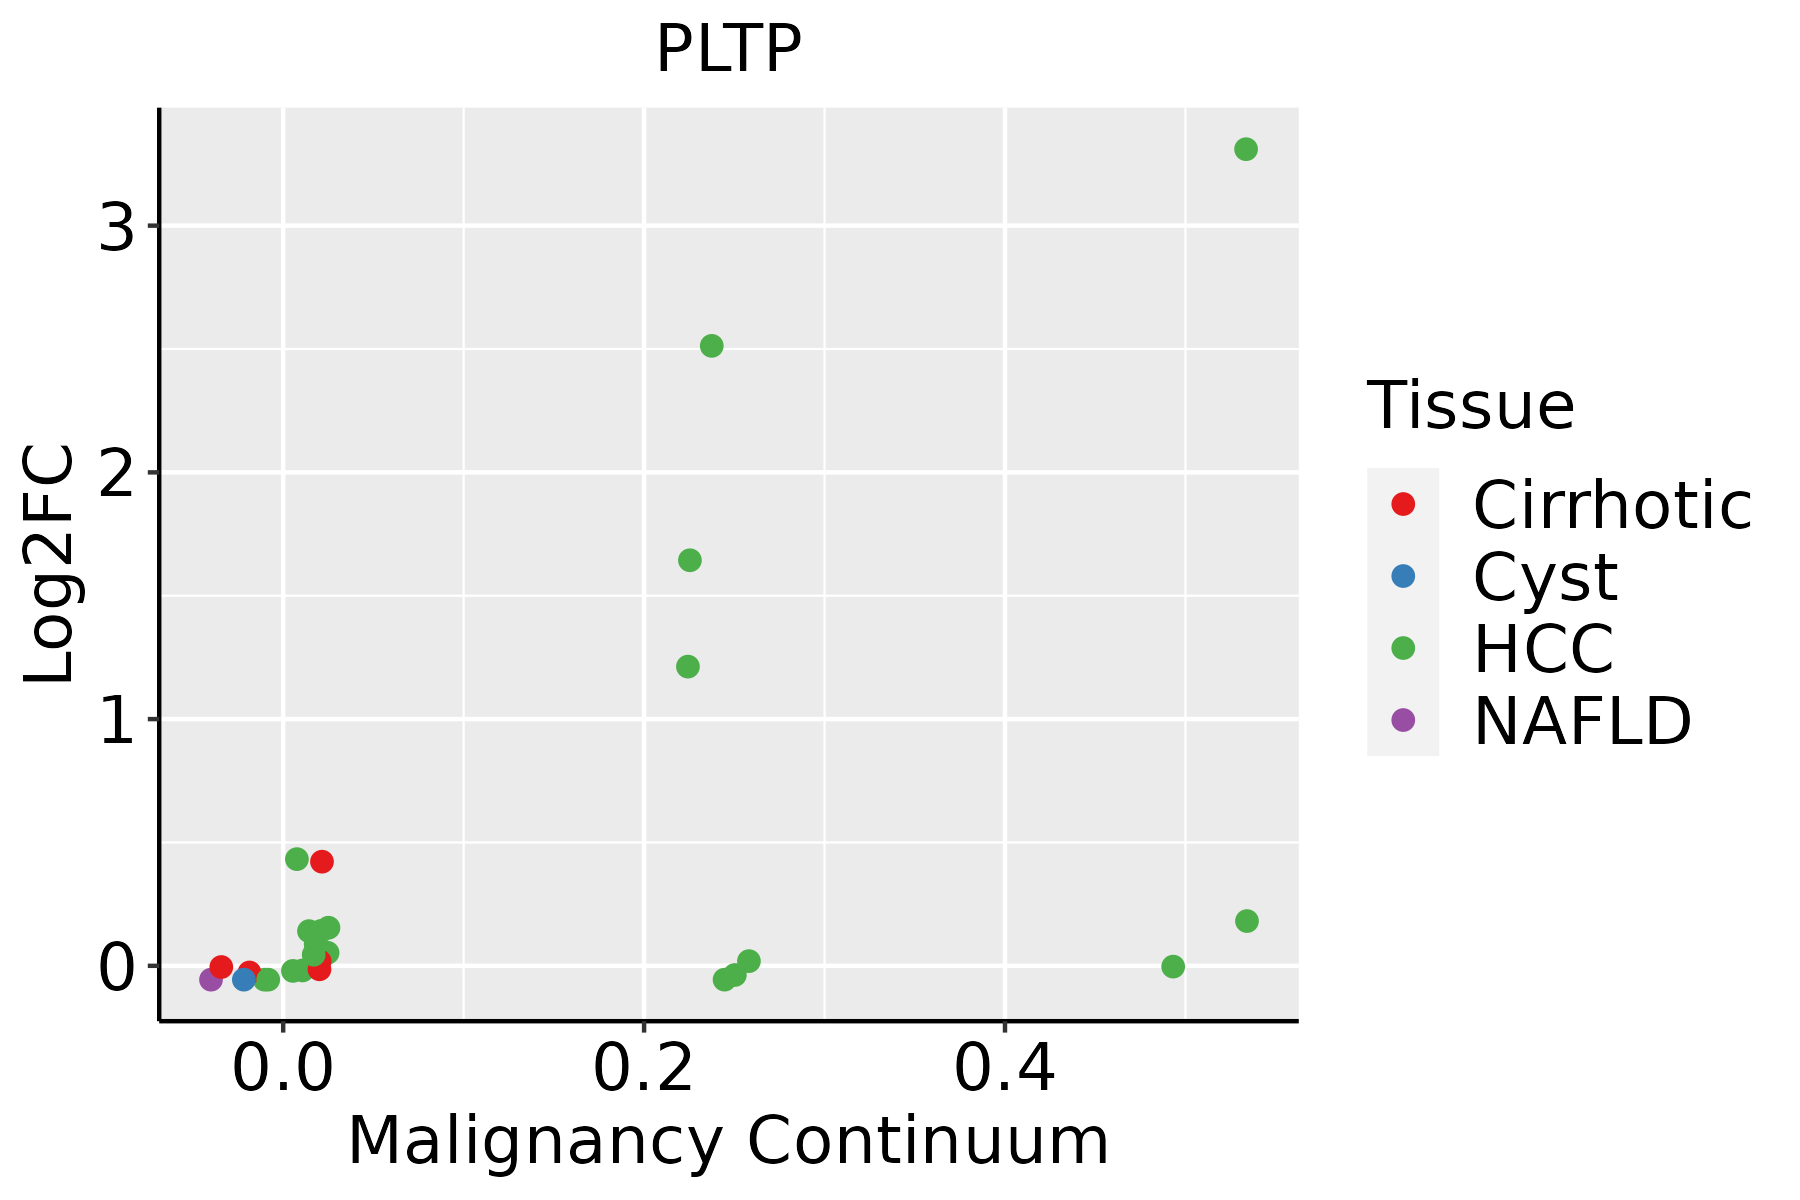 | HCC: Hepatocellular carcinoma |
| NAFLD: Non-alcoholic fatty liver disease | ||
| Lung | 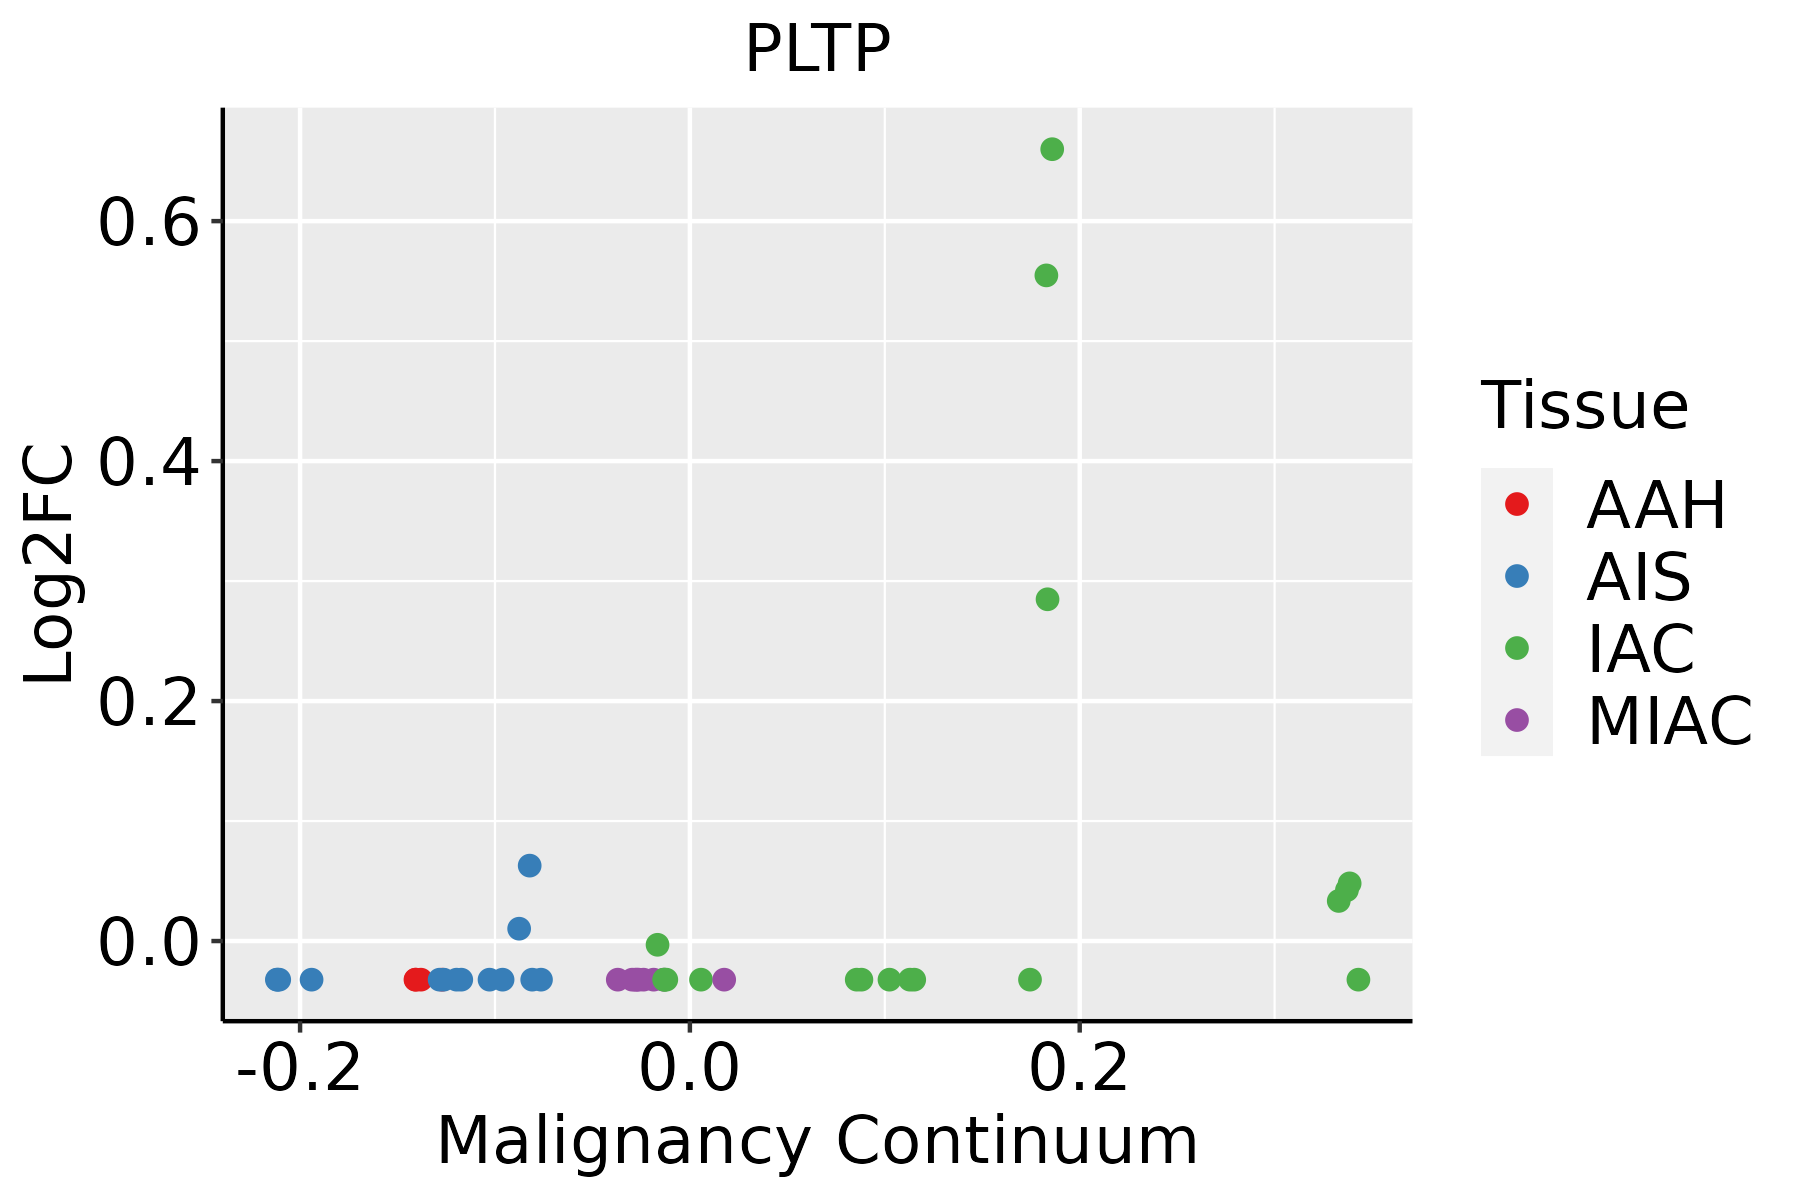 | AAH: Atypical adenomatous hyperplasia |
| AIS: Adenocarcinoma in situ | ||
| IAC: Invasive lung adenocarcinoma | ||
| MIA: Minimally invasive adenocarcinoma | ||
| Oral Cavity | 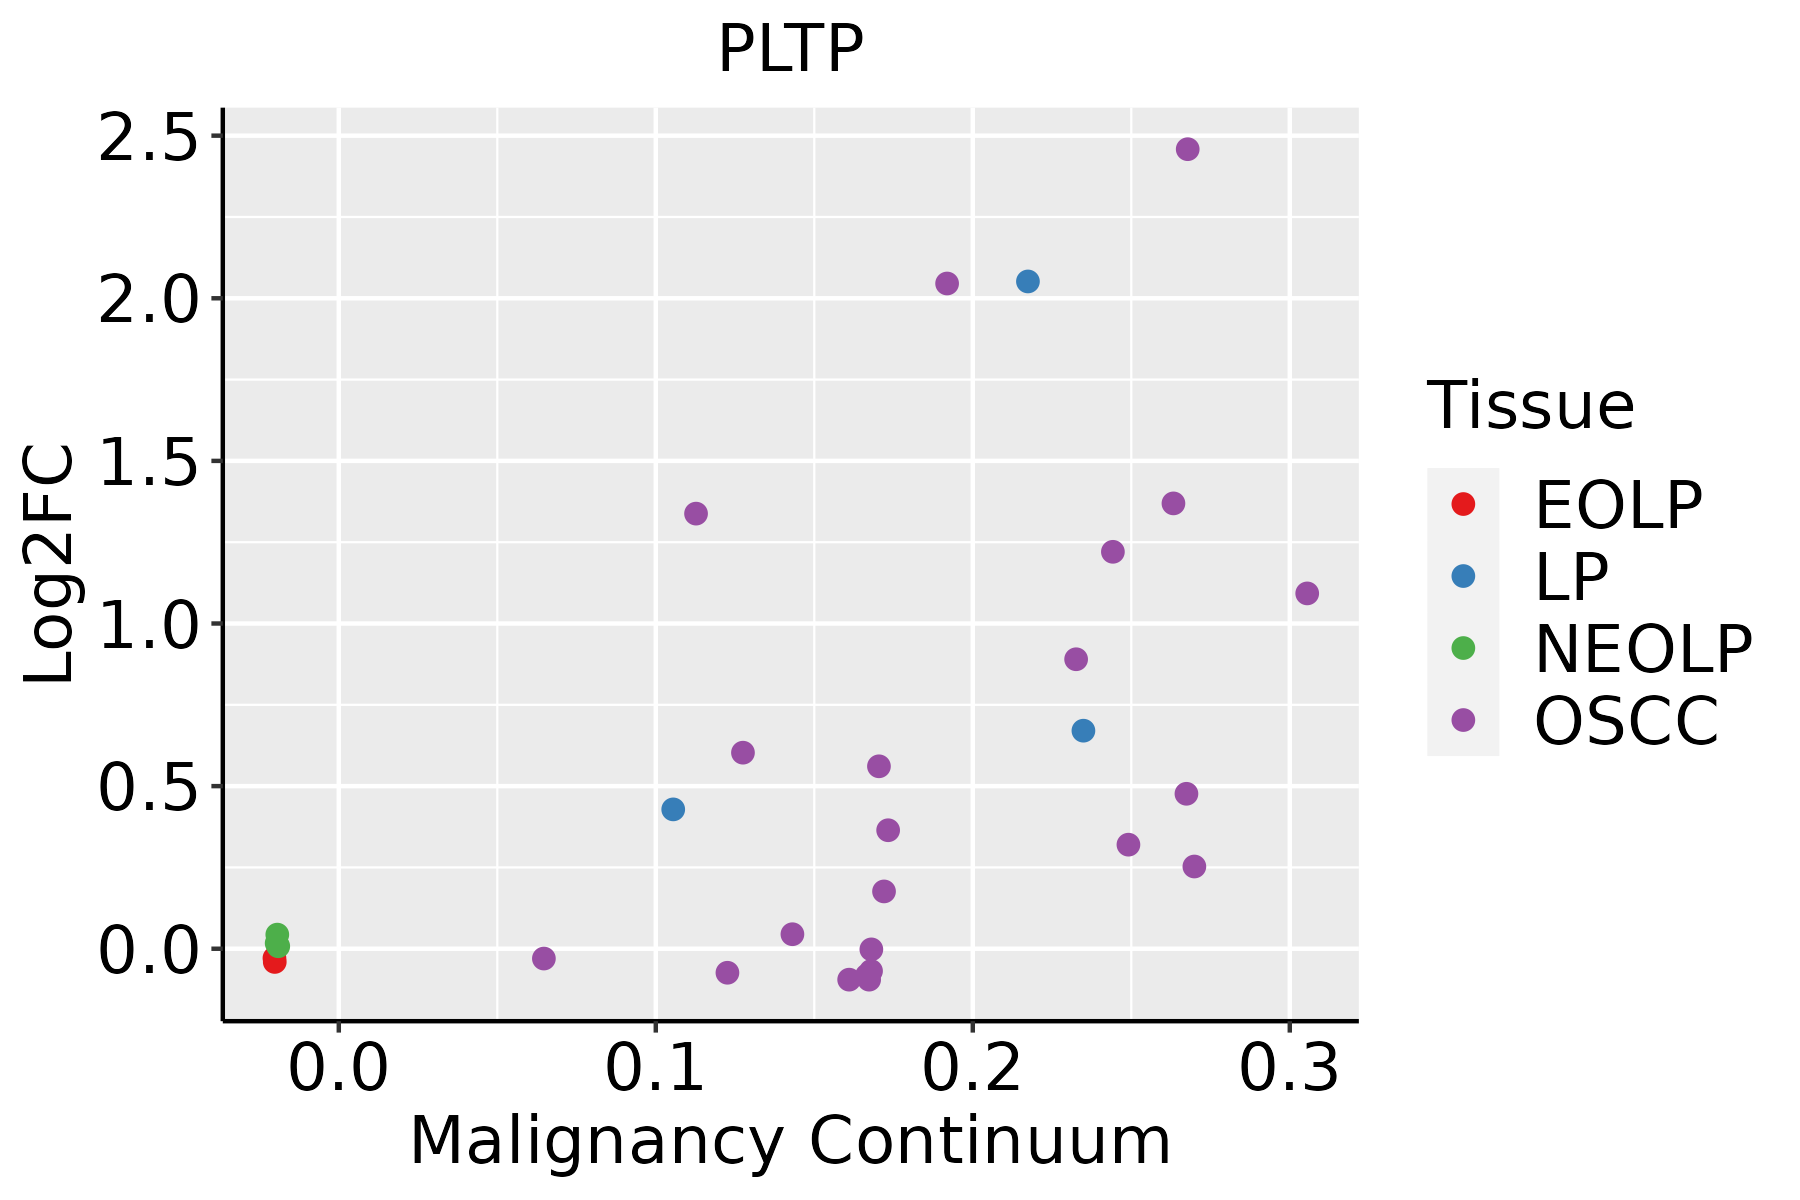 | EOLP: Erosive Oral lichen planus |
| LP: leukoplakia | ||
| NEOLP: Non-erosive oral lichen planus | ||
| OSCC: Oral squamous cell carcinoma | ||
| Skin | 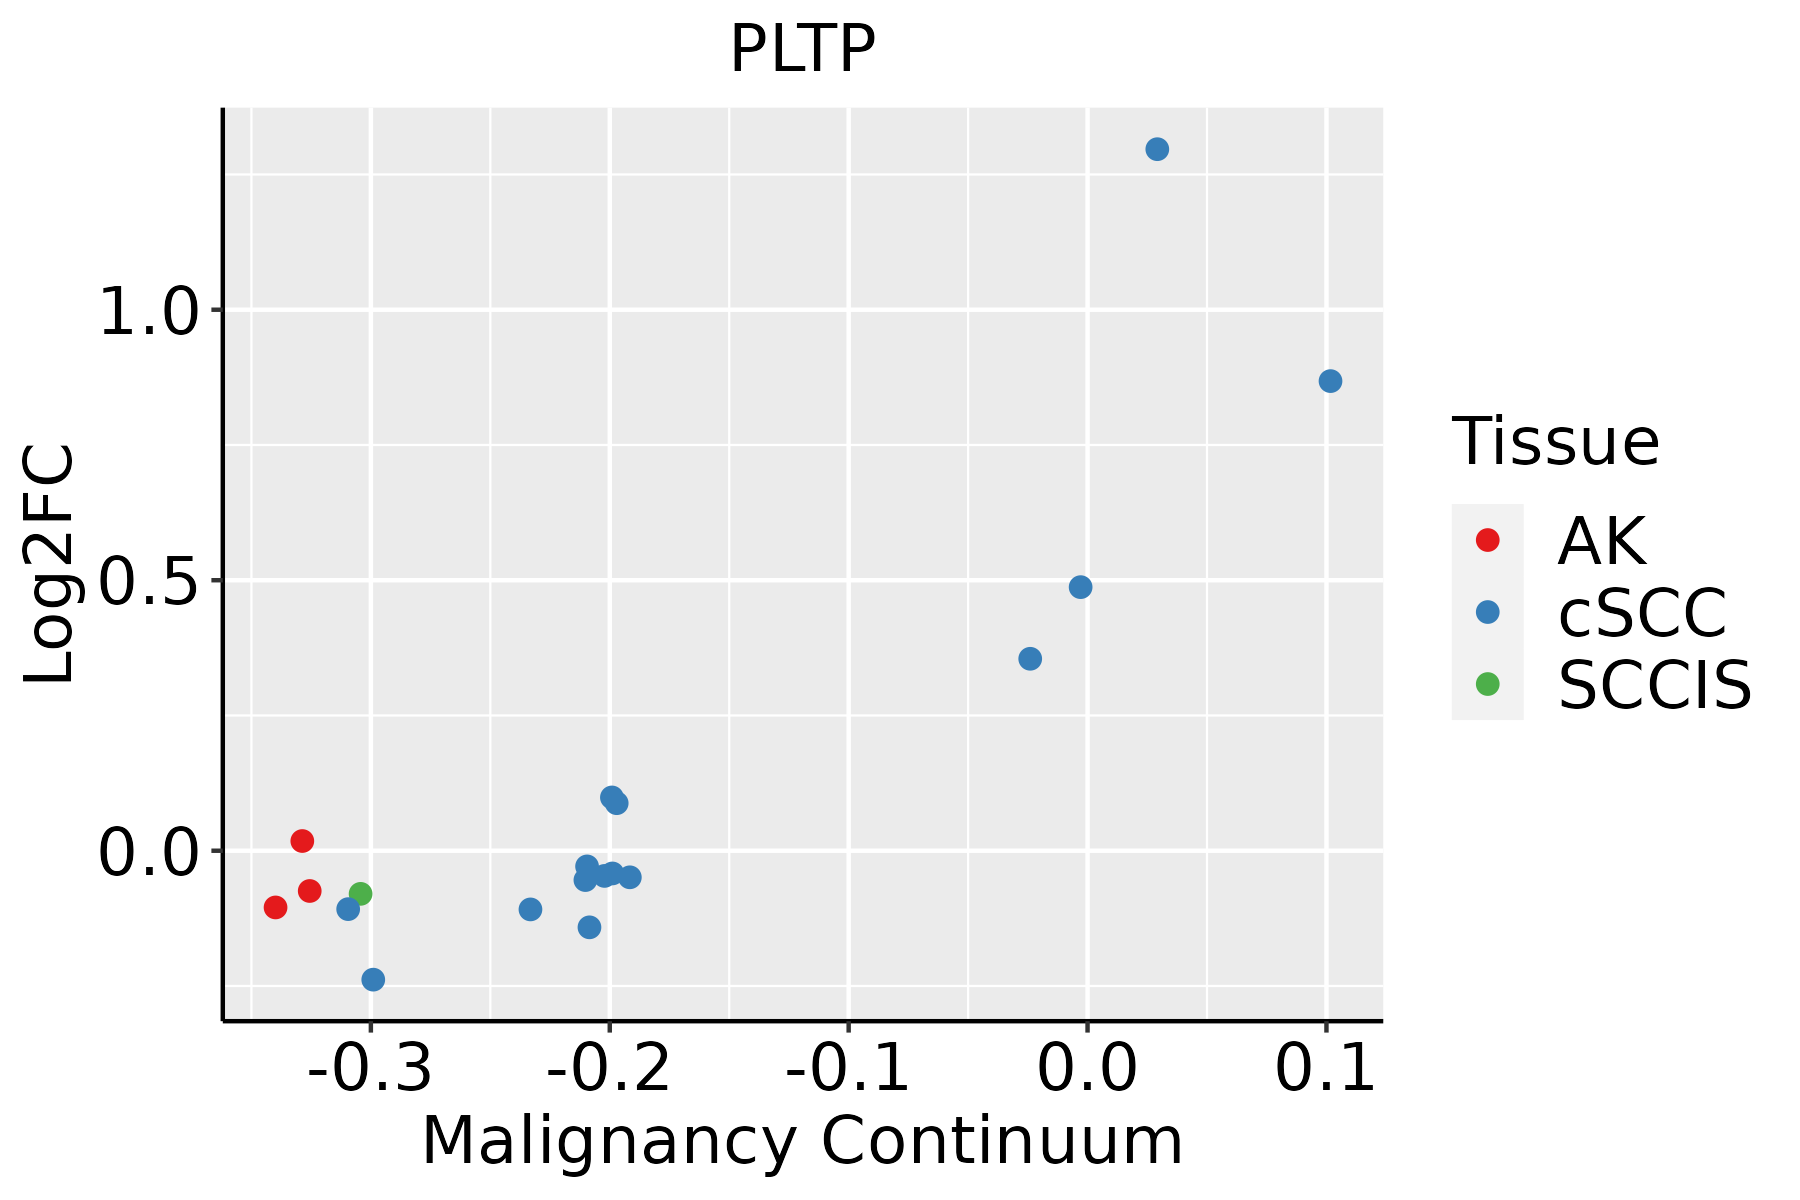 | AK: Actinic keratosis |
| cSCC: Cutaneous squamous cell carcinoma | ||
| SCCIS:squamous cell carcinoma in situ | ||
| Thyroid | 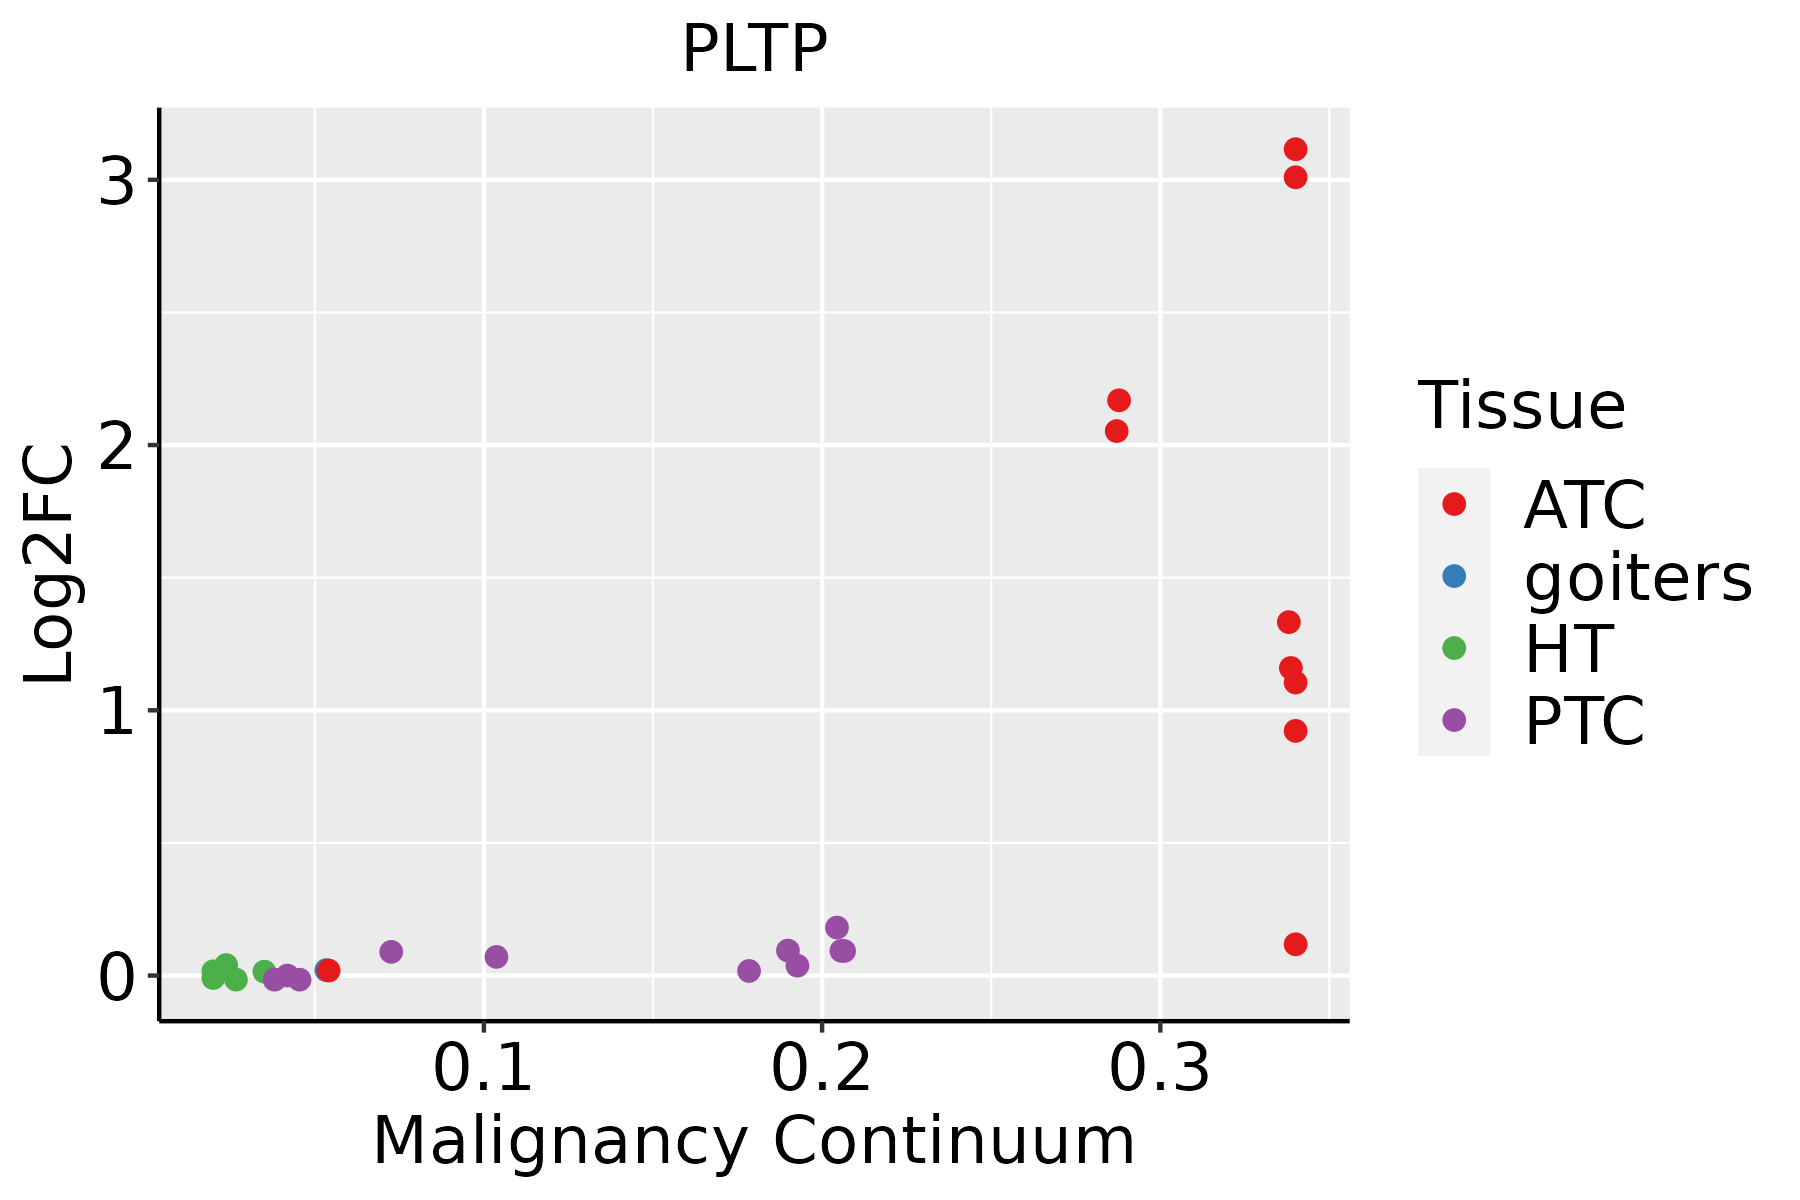 | ATC: Anaplastic thyroid cancer |
| HT: Hashimoto's thyroiditis | ||
| PTC: Papillary thyroid cancer |
| ∗log2FC in expression of this searched gene in stem-like cells from each diseased tissue sample relative to stem-like cells in normal samples in each tissue plotted against the malignancy continuum. Samples are colored based on if they are from different disease stage. |
Top |
Malignant transformation related pathway analysis |
| Find out the enriched GO biological processes and KEGG pathways involved in transition from healthy to precancer to cancer |
| Tissue | Disease Stage | Enriched GO biological Processes |
| Colorectum | AD |  |
| Colorectum | SER |  |
| Colorectum | MSS |  |
| Colorectum | MSI-H |  |
| Colorectum | FAP |  |
| ∗Top 15 enriched GO BP terms are showed in the bar plot of each disease state in each tissue. Each row represents a significant GO biological process which is colored according to the -log10(p.adjust). |
| Page: 1 2 3 4 5 6 7 8 9 |
| GO ID | Tissue | Disease Stage | Description | Gene Ratio | Bg Ratio | pvalue | p.adjust | Count |
| GO:00067661 | Esophagus | ESCC | vitamin metabolic process | 67/8552 | 106/18723 | 2.03e-04 | 1.28e-03 | 67 |
| GO:19016174 | Esophagus | ESCC | organic hydroxy compound biosynthetic process | 128/8552 | 237/18723 | 5.86e-03 | 2.16e-02 | 128 |
| GO:0009110 | Esophagus | ESCC | vitamin biosynthetic process | 15/8552 | 20/18723 | 7.60e-03 | 2.71e-02 | 15 |
| GO:001087611 | Liver | Cirrhotic | lipid localization | 147/4634 | 448/18723 | 6.24e-05 | 7.12e-04 | 147 |
| GO:00108751 | Liver | Cirrhotic | positive regulation of cholesterol efflux | 15/4634 | 26/18723 | 3.43e-04 | 2.93e-03 | 15 |
| GO:000686911 | Liver | Cirrhotic | lipid transport | 128/4634 | 398/18723 | 4.54e-04 | 3.69e-03 | 128 |
| GO:19016171 | Liver | Cirrhotic | organic hydroxy compound biosynthetic process | 81/4634 | 237/18723 | 6.73e-04 | 5.06e-03 | 81 |
| GO:00323731 | Liver | Cirrhotic | positive regulation of sterol transport | 19/4634 | 38/18723 | 6.75e-04 | 5.06e-03 | 19 |
| GO:00323761 | Liver | Cirrhotic | positive regulation of cholesterol transport | 19/4634 | 38/18723 | 6.75e-04 | 5.06e-03 | 19 |
| GO:00343681 | Liver | Cirrhotic | protein-lipid complex remodeling | 16/4634 | 30/18723 | 7.20e-04 | 5.36e-03 | 16 |
| GO:00343691 | Liver | Cirrhotic | plasma lipoprotein particle remodeling | 16/4634 | 30/18723 | 7.20e-04 | 5.36e-03 | 16 |
| GO:00333441 | Liver | Cirrhotic | cholesterol efflux | 29/4634 | 69/18723 | 1.20e-03 | 8.12e-03 | 29 |
| GO:001591811 | Liver | Cirrhotic | sterol transport | 48/4634 | 130/18723 | 1.32e-03 | 8.83e-03 | 48 |
| GO:003030111 | Liver | Cirrhotic | cholesterol transport | 44/4634 | 117/18723 | 1.34e-03 | 8.98e-03 | 44 |
| GO:00343671 | Liver | Cirrhotic | protein-containing complex remodeling | 16/4634 | 32/18723 | 1.77e-03 | 1.13e-02 | 16 |
| GO:00718251 | Liver | Cirrhotic | protein-lipid complex subunit organization | 22/4634 | 50/18723 | 2.26e-03 | 1.37e-02 | 22 |
| GO:00323711 | Liver | Cirrhotic | regulation of sterol transport | 31/4634 | 78/18723 | 2.43e-03 | 1.46e-02 | 31 |
| GO:00323741 | Liver | Cirrhotic | regulation of cholesterol transport | 31/4634 | 78/18723 | 2.43e-03 | 1.46e-02 | 31 |
| GO:19059521 | Liver | Cirrhotic | regulation of lipid localization | 62/4634 | 181/18723 | 2.53e-03 | 1.51e-02 | 62 |
| GO:01200091 | Liver | Cirrhotic | intermembrane lipid transfer | 21/4634 | 48/18723 | 3.06e-03 | 1.73e-02 | 21 |
| Page: 1 2 |
| Pathway ID | Tissue | Disease Stage | Description | Gene Ratio | Bg Ratio | pvalue | p.adjust | qvalue | Count |
| hsa049794 | Liver | HCC | Cholesterol metabolism | 41/4020 | 51/8465 | 1.33e-06 | 1.35e-05 | 7.49e-06 | 41 |
| hsa033204 | Liver | HCC | PPAR signaling pathway | 48/4020 | 75/8465 | 2.83e-03 | 9.37e-03 | 5.21e-03 | 48 |
| hsa049795 | Liver | HCC | Cholesterol metabolism | 41/4020 | 51/8465 | 1.33e-06 | 1.35e-05 | 7.49e-06 | 41 |
| hsa033205 | Liver | HCC | PPAR signaling pathway | 48/4020 | 75/8465 | 2.83e-03 | 9.37e-03 | 5.21e-03 | 48 |
| Page: 1 |
Top |
Cell-cell communication analysis |
| Identification of potential cell-cell interactions between two cell types and their ligand-receptor pairs for different disease states |
| Ligand | Receptor | LRpair | Pathway | Tissue | Disease Stage |
| Page: 1 |
Top |
Single-cell gene regulatory network inference analysis |
| Find out the significant the regulons (TFs) and the target genes of each regulon across cell types for different disease states |
| TF | Cell Type | Tissue | Disease Stage | Target Gene | RSS | Regulon Activity |
| ∗The dot plots of a searched regulon are shown for all cell subpopulations in each disease state of each tissue based on the regulon specific score inferred using pySCENIC and by calculating the average expression. |
| Page: 1 |
Top |
Somatic mutation of malignant transformation related genes |
| Annotation of somatic variants for genes involved in malignant transformation |
| Hugo Symbol | Variant Class | Variant Classification | dbSNP RS | HGVSc | HGVSp | HGVSp Short | SWISSPROT | BIOTYPE | SIFT | PolyPhen | Tumor Sample Barcode | Tissue | Histology | Sex | Age | Stage | Therapy Types | Drugs | Outcome |
| PLTP | SNV | Missense_Mutation | rs758323524 | c.791N>G | p.Val264Gly | p.V264G | P55058 | protein_coding | deleterious(0) | probably_damaging(0.995) | TCGA-B6-A1KF-01 | Breast | breast invasive carcinoma | Female | >=65 | I/II | Unknown | Unknown | SD |
| PLTP | SNV | Missense_Mutation | rs776207299 | c.1361N>A | p.Gly454Glu | p.G454E | P55058 | protein_coding | deleterious(0) | probably_damaging(0.946) | TCGA-BH-A0BZ-01 | Breast | breast invasive carcinoma | Female | <65 | III/IV | Chemotherapy | doxorubicin | CR |
| PLTP | SNV | Missense_Mutation | rs758323524 | c.791N>G | p.Val264Gly | p.V264G | P55058 | protein_coding | deleterious(0) | probably_damaging(0.995) | TCGA-BH-A1F5-01 | Breast | breast invasive carcinoma | Female | <65 | I/II | Unknown | Unknown | SD |
| PLTP | SNV | Missense_Mutation | rs758323524 | c.791T>G | p.Val264Gly | p.V264G | P55058 | protein_coding | deleterious(0) | probably_damaging(0.995) | TCGA-C8-A273-01 | Breast | breast invasive carcinoma | Female | <65 | I/II | Hormone Therapy | tamoxiphen | SD |
| PLTP | SNV | Missense_Mutation | c.976G>C | p.Glu326Gln | p.E326Q | P55058 | protein_coding | tolerated(0.49) | benign(0.076) | TCGA-D8-A1JA-01 | Breast | breast invasive carcinoma | Female | <65 | III/IV | Chemotherapy | adriamycin | PD | |
| PLTP | SNV | Missense_Mutation | rs758323524 | c.791T>G | p.Val264Gly | p.V264G | P55058 | protein_coding | deleterious(0) | probably_damaging(0.995) | TCGA-D8-A1JD-01 | Breast | breast invasive carcinoma | Female | <65 | I/II | Chemotherapy | adriamycin | SD |
| PLTP | SNV | Missense_Mutation | rs758323524 | c.791T>G | p.Val264Gly | p.V264G | P55058 | protein_coding | deleterious(0) | probably_damaging(0.995) | TCGA-D8-A1JI-01 | Breast | breast invasive carcinoma | Female | <65 | I/II | Chemotherapy | doxorubicine | SD |
| PLTP | SNV | Missense_Mutation | rs758323524 | c.791T>G | p.Val264Gly | p.V264G | P55058 | protein_coding | deleterious(0) | probably_damaging(0.995) | TCGA-E9-A1RE-01 | Breast | breast invasive carcinoma | Female | >=65 | III/IV | Hormone Therapy | tamoxiphen | SD |
| PLTP | SNV | Missense_Mutation | rs758323524 | c.791N>G | p.Val264Gly | p.V264G | P55058 | protein_coding | deleterious(0) | probably_damaging(0.995) | TCGA-EW-A1J3-01 | Breast | breast invasive carcinoma | Female | <65 | I/II | Chemotherapy | carboplatin | SD |
| PLTP | insertion | Frame_Shift_Ins | novel | c.998_999insTCTGCCTCCCGGGTTTAGGCAATTCTGCCTCAGCTTCCTGAGTA | p.Arg334LeufsTer49 | p.R334Lfs*49 | P55058 | protein_coding | TCGA-AN-A04C-01 | Breast | breast invasive carcinoma | Female | <65 | I/II | Unknown | Unknown | SD |
| Page: 1 2 3 4 5 6 7 |
Top |
Related drugs of malignant transformation related genes |
| Identification of chemicals and drugs interact with genes involved in malignant transfromation |
| (DGIdb 4.0) |
| Entrez ID | Symbol | Category | Interaction Types | Drug Claim Name | Drug Name | PMIDs |
| 5360 | PLTP | DRUGGABLE GENOME | VITAMIN E | 15734742,15576481,12105225 | ||
| 5360 | PLTP | DRUGGABLE GENOME | ALPHA-TOCOPHEROL | VITAMIN E | 15576481,10224231 | |
| 5360 | PLTP | DRUGGABLE GENOME | SIMVASTATIN | SIMVASTATIN | 11566255 |
| Page: 1 |

Copyright 2023-Present -The University of Texas Health Science Center at Houston |