
|
|||||
|
 | |
| |
| |
| |
| |
| |
|
Gene: PITX2 |
Gene summary for PITX2 |
| Gene information | Species | Human | Gene symbol | PITX2 | Gene ID | 5308 |
| Gene name | paired like homeodomain 2 | |
| Gene Alias | ARP1 | |
| Cytomap | 4q25 | |
| Gene Type | protein-coding | GO ID | GO:0001501 | UniProtAcc | Q99697 |
Top |
Malignant transformation analysis |
| Identification of the aberrant gene expression in precancerous and cancerous lesions by comparing the gene expression of stem-like cells in diseased tissues with normal stem cells |
| Entrez ID | Symbol | Replicates | Species | Organ | Tissue | Adj P-value | Log2FC | Malignancy |
| 5308 | PITX2 | P39T-E | Human | Esophagus | ESCC | 2.12e-11 | 2.06e-01 | 0.0894 |
| 5308 | PITX2 | P40T-E | Human | Esophagus | ESCC | 1.70e-03 | 1.10e-01 | 0.109 |
| 5308 | PITX2 | P42T-E | Human | Esophagus | ESCC | 1.04e-17 | 3.97e-01 | 0.1175 |
| 5308 | PITX2 | P47T-E | Human | Esophagus | ESCC | 1.69e-03 | 6.91e-02 | 0.1067 |
| 5308 | PITX2 | P48T-E | Human | Esophagus | ESCC | 8.50e-15 | 3.41e-01 | 0.0959 |
| 5308 | PITX2 | P49T-E | Human | Esophagus | ESCC | 3.28e-15 | 1.17e+00 | 0.1768 |
| 5308 | PITX2 | P52T-E | Human | Esophagus | ESCC | 8.81e-12 | 2.47e-01 | 0.1555 |
| 5308 | PITX2 | P54T-E | Human | Esophagus | ESCC | 8.97e-37 | 6.53e-01 | 0.0975 |
| 5308 | PITX2 | P56T-E | Human | Esophagus | ESCC | 2.80e-11 | 4.99e-01 | 0.1613 |
| 5308 | PITX2 | P61T-E | Human | Esophagus | ESCC | 1.80e-16 | 3.50e-01 | 0.099 |
| 5308 | PITX2 | P62T-E | Human | Esophagus | ESCC | 2.30e-54 | 1.13e+00 | 0.1302 |
| 5308 | PITX2 | P65T-E | Human | Esophagus | ESCC | 9.91e-08 | 1.53e-01 | 0.0978 |
| 5308 | PITX2 | P74T-E | Human | Esophagus | ESCC | 2.13e-33 | 8.93e-01 | 0.1479 |
| 5308 | PITX2 | P75T-E | Human | Esophagus | ESCC | 4.33e-19 | 4.52e-01 | 0.1125 |
| 5308 | PITX2 | P76T-E | Human | Esophagus | ESCC | 5.71e-08 | 2.06e-01 | 0.1207 |
| 5308 | PITX2 | P79T-E | Human | Esophagus | ESCC | 2.77e-25 | 6.09e-01 | 0.1154 |
| 5308 | PITX2 | P80T-E | Human | Esophagus | ESCC | 2.22e-31 | 7.54e-01 | 0.155 |
| 5308 | PITX2 | P82T-E | Human | Esophagus | ESCC | 9.44e-05 | 3.38e-01 | 0.1072 |
| 5308 | PITX2 | P83T-E | Human | Esophagus | ESCC | 3.53e-13 | 3.70e-01 | 0.1738 |
| 5308 | PITX2 | P84T-E | Human | Esophagus | ESCC | 2.46e-07 | 2.58e-01 | 0.0933 |
| Page: 1 2 3 4 |
| Tissue | Expression Dynamics | Abbreviation |
| Colorectum (GSE201348) |  | FAP: Familial adenomatous polyposis |
| CRC: Colorectal cancer | ||
| Colorectum (HTA11) |  | AD: Adenomas |
| SER: Sessile serrated lesions | ||
| MSI-H: Microsatellite-high colorectal cancer | ||
| MSS: Microsatellite stable colorectal cancer | ||
| Esophagus | 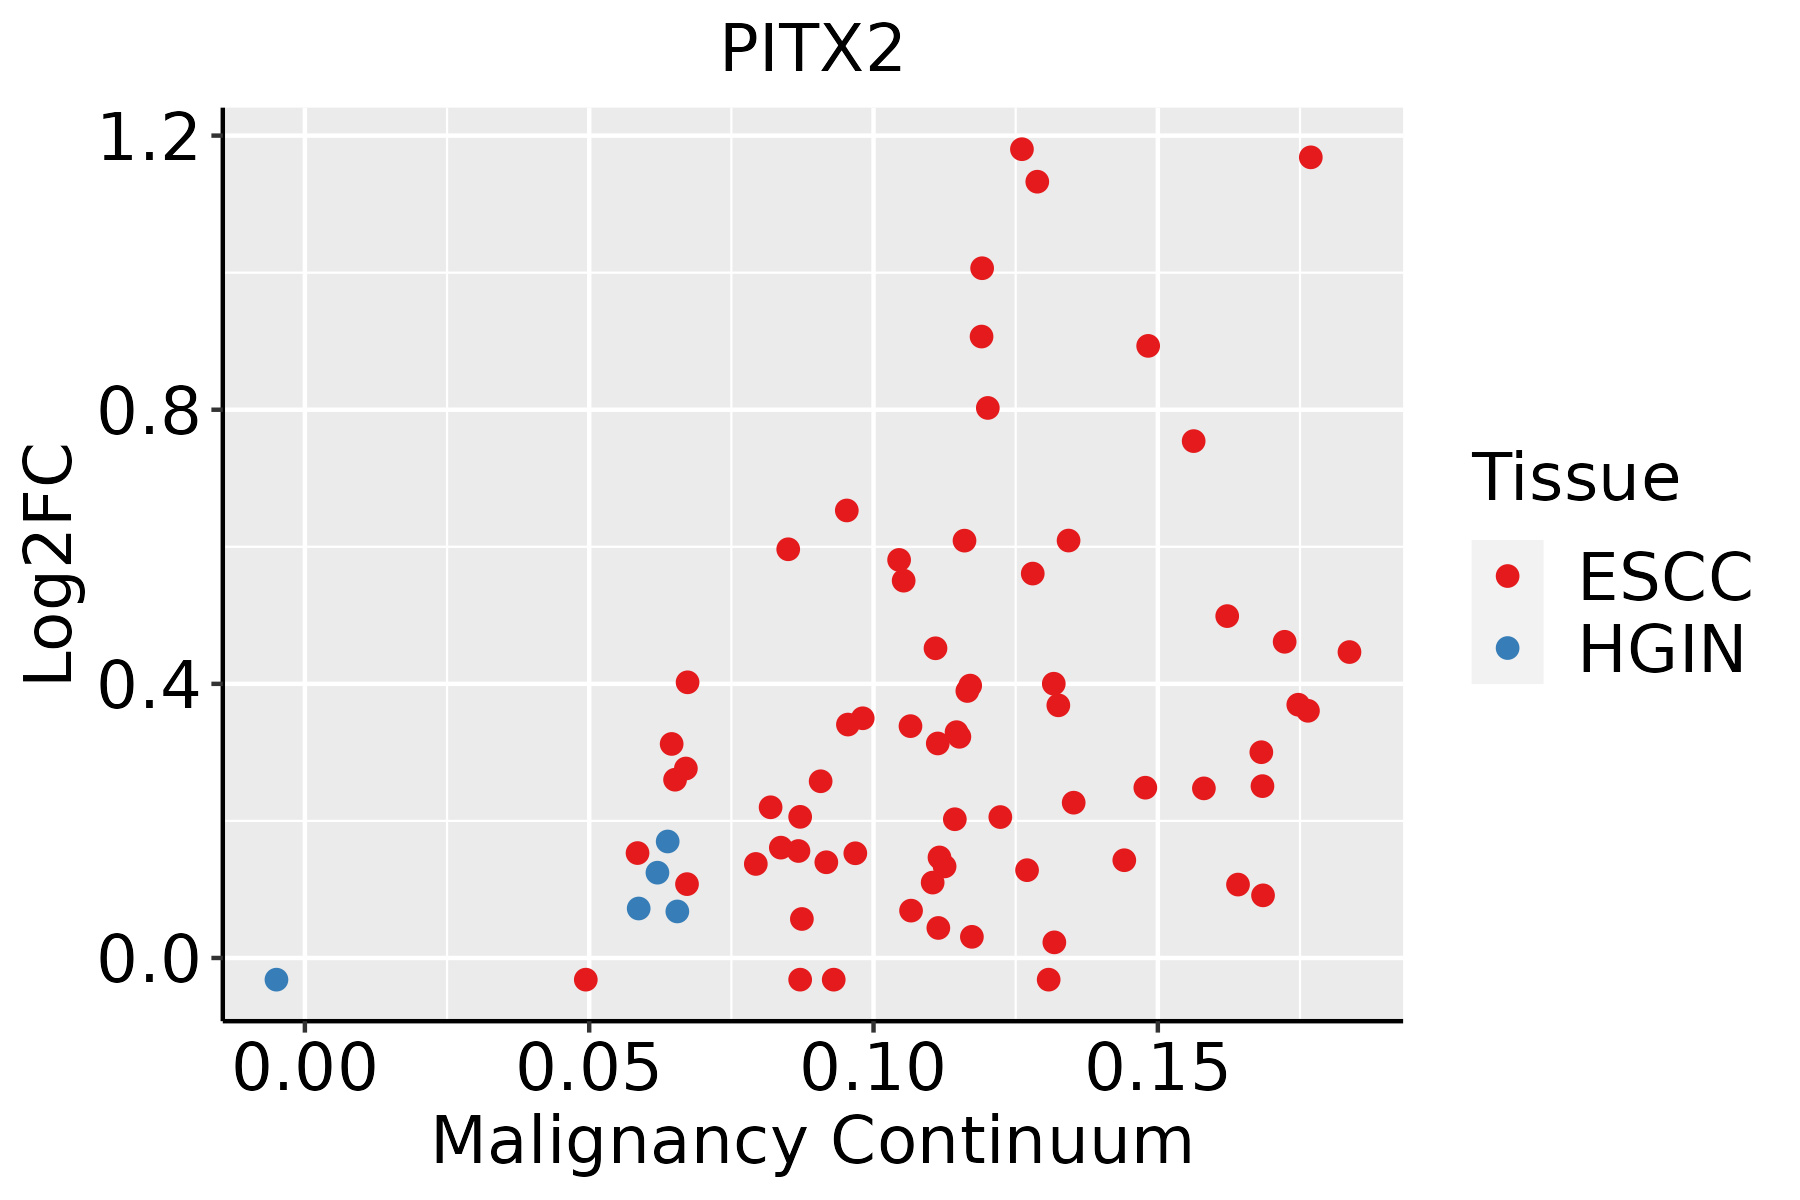 | ESCC: Esophageal squamous cell carcinoma |
| HGIN: High-grade intraepithelial neoplasias | ||
| LGIN: Low-grade intraepithelial neoplasias |
| ∗log2FC in expression of this searched gene in stem-like cells from each diseased tissue sample relative to stem-like cells in normal samples in each tissue plotted against the malignancy continuum. Samples are colored based on if they are from different disease stage. |
Top |
Malignant transformation related pathway analysis |
| Find out the enriched GO biological processes and KEGG pathways involved in transition from healthy to precancer to cancer |
| Tissue | Disease Stage | Enriched GO biological Processes |
| Colorectum | AD |  |
| Colorectum | SER |  |
| Colorectum | MSS |  |
| Colorectum | MSI-H |  |
| Colorectum | FAP |  |
| ∗Top 15 enriched GO BP terms are showed in the bar plot of each disease state in each tissue. Each row represents a significant GO biological process which is colored according to the -log10(p.adjust). |
| Page: 1 2 3 4 5 6 7 8 9 |
| GO ID | Tissue | Disease Stage | Description | Gene Ratio | Bg Ratio | pvalue | p.adjust | Count |
| GO:0048732 | Colorectum | AD | gland development | 149/3918 | 436/18723 | 6.07e-11 | 6.33e-09 | 149 |
| GO:0001667 | Colorectum | AD | ameboidal-type cell migration | 137/3918 | 475/18723 | 2.17e-05 | 4.33e-04 | 137 |
| GO:0035315 | Colorectum | AD | hair cell differentiation | 21/3918 | 47/18723 | 2.14e-04 | 2.82e-03 | 21 |
| GO:0048736 | Colorectum | AD | appendage development | 51/3918 | 172/18723 | 4.20e-03 | 2.89e-02 | 51 |
| GO:0060173 | Colorectum | AD | limb development | 51/3918 | 172/18723 | 4.20e-03 | 2.89e-02 | 51 |
| GO:0048568 | Colorectum | AD | embryonic organ development | 112/3918 | 427/18723 | 4.60e-03 | 3.14e-02 | 112 |
| GO:0009913 | Colorectum | AD | epidermal cell differentiation | 58/3918 | 202/18723 | 5.16e-03 | 3.42e-02 | 58 |
| GO:0008544 | Colorectum | AD | epidermis development | 87/3918 | 324/18723 | 5.99e-03 | 3.76e-02 | 87 |
| GO:00487321 | Colorectum | SER | gland development | 112/2897 | 436/18723 | 1.75e-08 | 1.28e-06 | 112 |
| GO:00016671 | Colorectum | SER | ameboidal-type cell migration | 105/2897 | 475/18723 | 6.97e-05 | 1.59e-03 | 105 |
| GO:00487361 | Colorectum | SER | appendage development | 42/2897 | 172/18723 | 1.43e-03 | 1.55e-02 | 42 |
| GO:00601731 | Colorectum | SER | limb development | 42/2897 | 172/18723 | 1.43e-03 | 1.55e-02 | 42 |
| GO:00353151 | Colorectum | SER | hair cell differentiation | 15/2897 | 47/18723 | 3.68e-03 | 3.07e-02 | 15 |
| GO:00487322 | Colorectum | MSS | gland development | 143/3467 | 436/18723 | 3.85e-13 | 8.01e-11 | 143 |
| GO:00016672 | Colorectum | MSS | ameboidal-type cell migration | 120/3467 | 475/18723 | 1.37e-04 | 2.05e-03 | 120 |
| GO:00353152 | Colorectum | MSS | hair cell differentiation | 19/3467 | 47/18723 | 3.88e-04 | 4.86e-03 | 19 |
| GO:00487362 | Colorectum | MSS | appendage development | 48/3467 | 172/18723 | 1.61e-03 | 1.46e-02 | 48 |
| GO:00601732 | Colorectum | MSS | limb development | 48/3467 | 172/18723 | 1.61e-03 | 1.46e-02 | 48 |
| GO:00485681 | Colorectum | MSS | embryonic organ development | 100/3467 | 427/18723 | 6.00e-03 | 4.03e-02 | 100 |
| GO:00099131 | Colorectum | MSS | epidermal cell differentiation | 52/3467 | 202/18723 | 6.59e-03 | 4.38e-02 | 52 |
| Page: 1 2 |
| Pathway ID | Tissue | Disease Stage | Description | Gene Ratio | Bg Ratio | pvalue | p.adjust | qvalue | Count |
| hsa04350 | Colorectum | SER | TGF-beta signaling pathway | 31/1580 | 108/8465 | 7.00e-03 | 3.77e-02 | 2.74e-02 | 31 |
| hsa043501 | Colorectum | SER | TGF-beta signaling pathway | 31/1580 | 108/8465 | 7.00e-03 | 3.77e-02 | 2.74e-02 | 31 |
| hsa043507 | Esophagus | ESCC | TGF-beta signaling pathway | 69/4205 | 108/8465 | 1.92e-03 | 5.54e-03 | 2.84e-03 | 69 |
| hsa0435014 | Esophagus | ESCC | TGF-beta signaling pathway | 69/4205 | 108/8465 | 1.92e-03 | 5.54e-03 | 2.84e-03 | 69 |
| Page: 1 |
Top |
Cell-cell communication analysis |
| Identification of potential cell-cell interactions between two cell types and their ligand-receptor pairs for different disease states |
| Ligand | Receptor | LRpair | Pathway | Tissue | Disease Stage |
| Page: 1 |
Top |
Single-cell gene regulatory network inference analysis |
| Find out the significant the regulons (TFs) and the target genes of each regulon across cell types for different disease states |
| TF | Cell Type | Tissue | Disease Stage | Target Gene | RSS | Regulon Activity |
| PITX2 | STM | Skin | ADJ | PITX1,THBS2,HOXB7, etc. | 3.27e-01 |  |
| ∗The dot plots of a searched regulon are shown for all cell subpopulations in each disease state of each tissue based on the regulon specific score inferred using pySCENIC and by calculating the average expression. |
| Page: 1 |
Top |
Somatic mutation of malignant transformation related genes |
| Annotation of somatic variants for genes involved in malignant transformation |
| Hugo Symbol | Variant Class | Variant Classification | dbSNP RS | HGVSc | HGVSp | HGVSp Short | SWISSPROT | BIOTYPE | SIFT | PolyPhen | Tumor Sample Barcode | Tissue | Histology | Sex | Age | Stage | Therapy Types | Drugs | Outcome |
| PITX2 | SNV | Missense_Mutation | c.478A>G | p.Lys160Glu | p.K160E | Q99697 | protein_coding | deleterious(0) | probably_damaging(0.961) | TCGA-A8-A09Z-01 | Breast | breast invasive carcinoma | Female | >=65 | I/II | Unknown | Unknown | SD | |
| PITX2 | SNV | Missense_Mutation | rs780968713 | c.610N>G | p.Phe204Val | p.F204V | Q99697 | protein_coding | tolerated(0.08) | benign(0.219) | TCGA-AO-A03T-01 | Breast | breast invasive carcinoma | Female | <65 | I/II | Chemotherapy | cyclophosphamide | SD |
| PITX2 | SNV | Missense_Mutation | c.797N>T | p.Thr266Met | p.T266M | Q99697 | protein_coding | deleterious(0.03) | possibly_damaging(0.886) | TCGA-BH-A1EX-01 | Breast | breast invasive carcinoma | Female | >=65 | I/II | Unknown | Unknown | PD | |
| PITX2 | SNV | Missense_Mutation | c.373N>G | p.Ile125Val | p.I125V | Q99697 | protein_coding | deleterious(0) | probably_damaging(0.978) | TCGA-D8-A1XK-01 | Breast | breast invasive carcinoma | Female | <65 | I/II | Chemotherapy | doxorubicine+cyclophosphamide | SD | |
| PITX2 | insertion | Frame_Shift_Ins | novel | c.271_272insAAAAT | p.Arg91GlnfsTer119 | p.R91Qfs*119 | Q99697 | protein_coding | TCGA-A8-A08H-01 | Breast | breast invasive carcinoma | Female | >=65 | I/II | Unknown | Unknown | SD | ||
| PITX2 | insertion | Frame_Shift_Ins | novel | c.270_271insAAAACAACGATAAAAAGAATAAAGAC | p.Arg91LysfsTer126 | p.R91Kfs*126 | Q99697 | protein_coding | TCGA-A8-A08H-01 | Breast | breast invasive carcinoma | Female | >=65 | I/II | Unknown | Unknown | SD | ||
| PITX2 | SNV | Missense_Mutation | novel | c.242T>C | p.Val81Ala | p.V81A | Q99697 | protein_coding | tolerated(0.69) | benign(0) | TCGA-2W-A8YY-01 | Cervix | cervical & endocervical cancer | Female | <65 | I/II | Chemotherapy | cisplatin | CR |
| PITX2 | SNV | Missense_Mutation | novel | c.100G>A | p.Ala34Thr | p.A34T | Q99697 | protein_coding | tolerated_low_confidence(0.51) | benign(0) | TCGA-VS-A8QA-01 | Cervix | cervical & endocervical cancer | Female | <65 | I/II | Unknown | Unknown | SD |
| PITX2 | SNV | Missense_Mutation | novel | c.848N>T | p.Thr283Met | p.T283M | Q99697 | protein_coding | deleterious(0.01) | probably_damaging(0.983) | TCGA-AA-3845-01 | Colorectum | colon adenocarcinoma | Female | >=65 | I/II | Unknown | Unknown | PD |
| PITX2 | SNV | Missense_Mutation | c.766A>C | p.Ser256Arg | p.S256R | Q99697 | protein_coding | deleterious(0.01) | possibly_damaging(0.726) | TCGA-NH-A6GB-01 | Colorectum | colon adenocarcinoma | Female | >=65 | III/IV | Chemotherapy | oxaliplatin | SD |
| Page: 1 2 3 4 5 6 |
Top |
Related drugs of malignant transformation related genes |
| Identification of chemicals and drugs interact with genes involved in malignant transfromation |
| (DGIdb 4.0) |
| Entrez ID | Symbol | Category | Interaction Types | Drug Claim Name | Drug Name | PMIDs |
| Page: 1 |

Copyright 2023-Present -The University of Texas Health Science Center at Houston |