
|
|||||
|
 | |
| |
| |
| |
| |
| |
|
Gene: PISD |
Gene summary for PISD |
| Gene information | Species | Human | Gene symbol | PISD | Gene ID | 23761 |
| Gene name | phosphatidylserine decarboxylase | |
| Gene Alias | DJ858B16 | |
| Cytomap | 22q12.2 | |
| Gene Type | protein-coding | GO ID | GO:0006508 | UniProtAcc | Q9UG56 |
Top |
Malignant transformation analysis |
| Identification of the aberrant gene expression in precancerous and cancerous lesions by comparing the gene expression of stem-like cells in diseased tissues with normal stem cells |
| Entrez ID | Symbol | Replicates | Species | Organ | Tissue | Adj P-value | Log2FC | Malignancy |
| 23761 | PISD | P54T-E | Human | Esophagus | ESCC | 2.83e-12 | 1.63e-01 | 0.0975 |
| 23761 | PISD | P56T-E | Human | Esophagus | ESCC | 1.39e-02 | 4.37e-01 | 0.1613 |
| 23761 | PISD | P57T-E | Human | Esophagus | ESCC | 8.87e-14 | 1.81e-01 | 0.0926 |
| 23761 | PISD | P61T-E | Human | Esophagus | ESCC | 1.19e-21 | 3.41e-01 | 0.099 |
| 23761 | PISD | P62T-E | Human | Esophagus | ESCC | 2.99e-35 | 7.45e-01 | 0.1302 |
| 23761 | PISD | P65T-E | Human | Esophagus | ESCC | 1.58e-09 | 3.05e-01 | 0.0978 |
| 23761 | PISD | P74T-E | Human | Esophagus | ESCC | 1.64e-19 | 6.71e-01 | 0.1479 |
| 23761 | PISD | P75T-E | Human | Esophagus | ESCC | 1.81e-26 | 5.42e-01 | 0.1125 |
| 23761 | PISD | P76T-E | Human | Esophagus | ESCC | 3.32e-22 | 3.52e-01 | 0.1207 |
| 23761 | PISD | P79T-E | Human | Esophagus | ESCC | 2.68e-22 | 2.94e-01 | 0.1154 |
| 23761 | PISD | P80T-E | Human | Esophagus | ESCC | 3.42e-20 | 7.26e-01 | 0.155 |
| 23761 | PISD | P82T-E | Human | Esophagus | ESCC | 3.09e-09 | 4.18e-01 | 0.1072 |
| 23761 | PISD | P83T-E | Human | Esophagus | ESCC | 1.53e-28 | 8.08e-01 | 0.1738 |
| 23761 | PISD | P84T-E | Human | Esophagus | ESCC | 2.35e-10 | 5.75e-01 | 0.0933 |
| 23761 | PISD | P89T-E | Human | Esophagus | ESCC | 1.81e-07 | 6.77e-01 | 0.1752 |
| 23761 | PISD | P91T-E | Human | Esophagus | ESCC | 3.96e-05 | 8.18e-01 | 0.1828 |
| 23761 | PISD | P104T-E | Human | Esophagus | ESCC | 4.75e-02 | 2.57e-01 | 0.0931 |
| 23761 | PISD | P107T-E | Human | Esophagus | ESCC | 1.85e-27 | 8.26e-01 | 0.171 |
| 23761 | PISD | P126T-E | Human | Esophagus | ESCC | 1.84e-07 | 7.72e-01 | 0.1125 |
| 23761 | PISD | P127T-E | Human | Esophagus | ESCC | 5.33e-18 | 2.32e-01 | 0.0826 |
| Page: 1 2 3 4 5 |
| Tissue | Expression Dynamics | Abbreviation |
| Cervix | 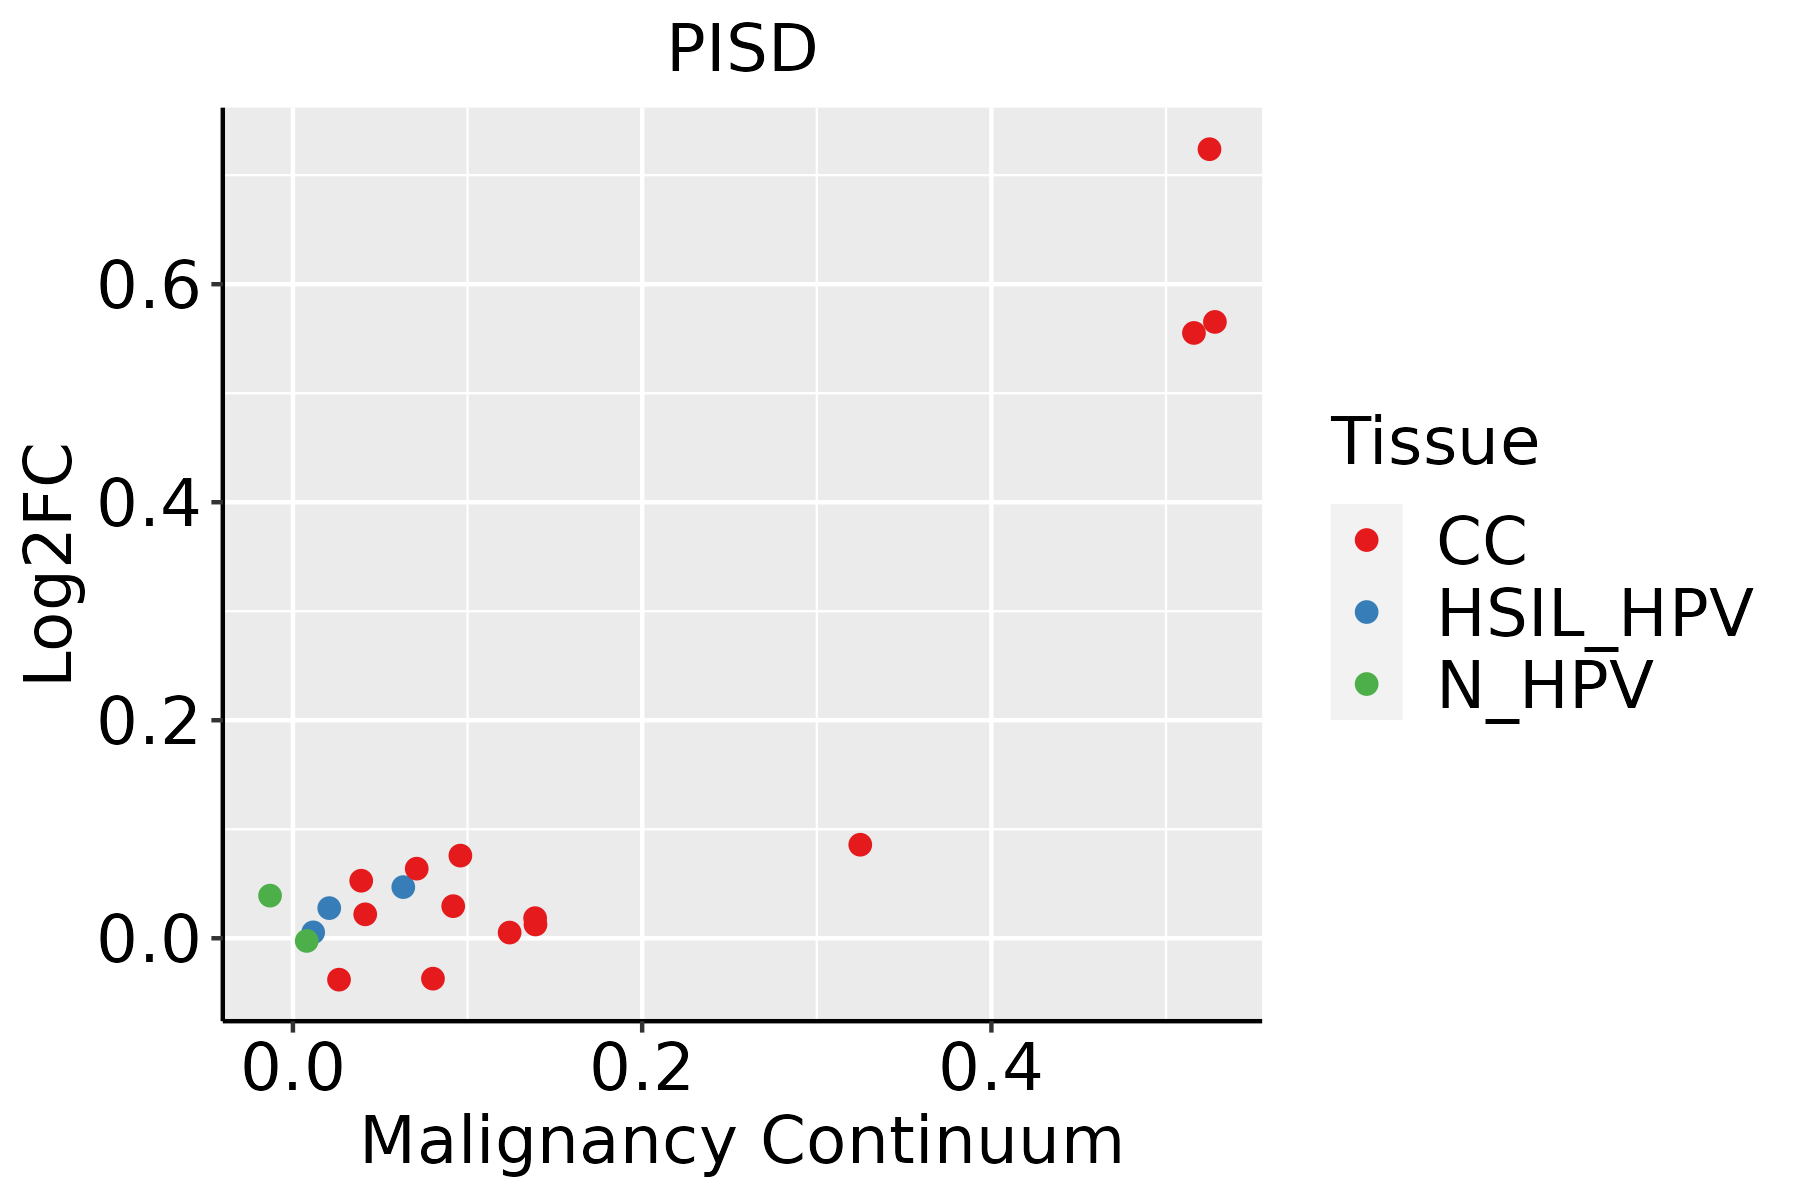 | CC: Cervix cancer |
| HSIL_HPV: HPV-infected high-grade squamous intraepithelial lesions | ||
| N_HPV: HPV-infected normal cervix | ||
| Esophagus |  | ESCC: Esophageal squamous cell carcinoma |
| HGIN: High-grade intraepithelial neoplasias | ||
| LGIN: Low-grade intraepithelial neoplasias | ||
| Oral Cavity | 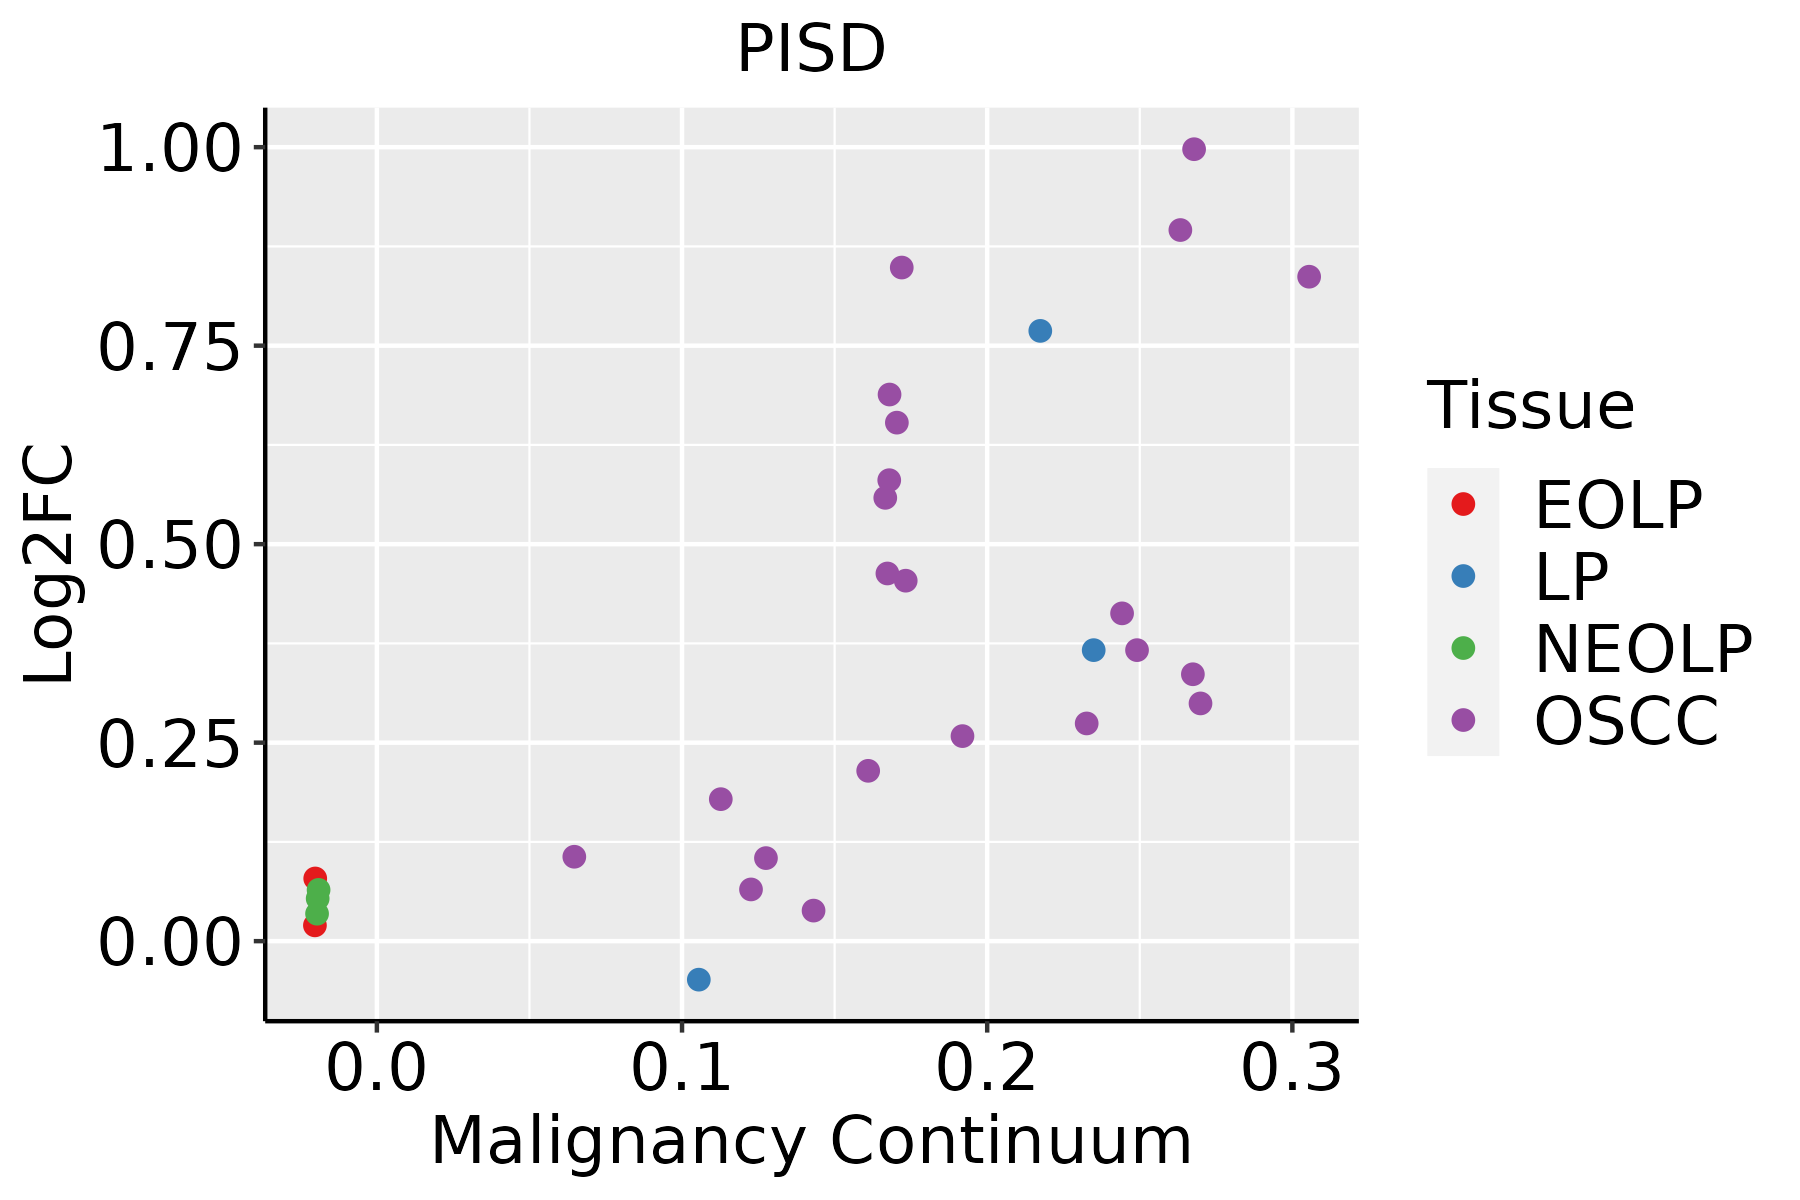 | EOLP: Erosive Oral lichen planus |
| LP: leukoplakia | ||
| NEOLP: Non-erosive oral lichen planus | ||
| OSCC: Oral squamous cell carcinoma | ||
| Prostate |  | BPH: Benign Prostatic Hyperplasia |
| ∗log2FC in expression of this searched gene in stem-like cells from each diseased tissue sample relative to stem-like cells in normal samples in each tissue plotted against the malignancy continuum. Samples are colored based on if they are from different disease stage. |
Top |
Malignant transformation related pathway analysis |
| Find out the enriched GO biological processes and KEGG pathways involved in transition from healthy to precancer to cancer |
| Tissue | Disease Stage | Enriched GO biological Processes |
| Colorectum | AD |  |
| Colorectum | SER |  |
| Colorectum | MSS |  |
| Colorectum | MSI-H |  |
| Colorectum | FAP |  |
| ∗Top 15 enriched GO BP terms are showed in the bar plot of each disease state in each tissue. Each row represents a significant GO biological process which is colored according to the -log10(p.adjust). |
| Page: 1 2 3 4 5 6 7 8 9 |
| GO ID | Tissue | Disease Stage | Description | Gene Ratio | Bg Ratio | pvalue | p.adjust | Count |
| GO:00108218 | Cervix | CC | regulation of mitochondrion organization | 34/2311 | 144/18723 | 1.27e-04 | 1.58e-03 | 34 |
| GO:00516048 | Cervix | CC | protein maturation | 56/2311 | 294/18723 | 5.90e-04 | 5.59e-03 | 56 |
| GO:0010821110 | Esophagus | ESCC | regulation of mitochondrion organization | 107/8552 | 144/18723 | 2.31e-12 | 9.41e-11 | 107 |
| GO:005160418 | Esophagus | ESCC | protein maturation | 189/8552 | 294/18723 | 7.64e-11 | 2.39e-09 | 189 |
| GO:00086544 | Esophagus | ESCC | phospholipid biosynthetic process | 162/8552 | 253/18723 | 2.59e-09 | 5.73e-08 | 162 |
| GO:00464744 | Esophagus | ESCC | glycerophospholipid biosynthetic process | 135/8552 | 211/18723 | 5.75e-08 | 1.02e-06 | 135 |
| GO:00450175 | Esophagus | ESCC | glycerolipid biosynthetic process | 154/8552 | 252/18723 | 5.20e-07 | 6.96e-06 | 154 |
| GO:00066446 | Esophagus | ESCC | phospholipid metabolic process | 218/8552 | 383/18723 | 5.37e-06 | 5.59e-05 | 218 |
| GO:001648514 | Esophagus | ESCC | protein processing | 134/8552 | 225/18723 | 1.81e-05 | 1.60e-04 | 134 |
| GO:00066505 | Esophagus | ESCC | glycerophospholipid metabolic process | 174/8552 | 306/18723 | 4.92e-05 | 3.85e-04 | 174 |
| GO:0006646 | Esophagus | ESCC | phosphatidylethanolamine biosynthetic process | 10/8552 | 10/18723 | 3.94e-04 | 2.26e-03 | 10 |
| GO:00464864 | Esophagus | ESCC | glycerolipid metabolic process | 211/8552 | 392/18723 | 6.51e-04 | 3.46e-03 | 211 |
| GO:001082117 | Oral cavity | OSCC | regulation of mitochondrion organization | 97/7305 | 144/18723 | 4.78e-12 | 1.83e-10 | 97 |
| GO:005160410 | Oral cavity | OSCC | protein maturation | 170/7305 | 294/18723 | 3.97e-11 | 1.28e-09 | 170 |
| GO:00164856 | Oral cavity | OSCC | protein processing | 121/7305 | 225/18723 | 4.56e-06 | 5.23e-05 | 121 |
| GO:00086543 | Oral cavity | OSCC | phospholipid biosynthetic process | 130/7305 | 253/18723 | 3.96e-05 | 3.46e-04 | 130 |
| GO:00464743 | Oral cavity | OSCC | glycerophospholipid biosynthetic process | 102/7305 | 211/18723 | 3.50e-03 | 1.48e-02 | 102 |
| GO:00066445 | Oral cavity | OSCC | phospholipid metabolic process | 175/7305 | 383/18723 | 4.21e-03 | 1.71e-02 | 175 |
| GO:005160416 | Oral cavity | LP | protein maturation | 122/4623 | 294/18723 | 1.37e-10 | 7.72e-09 | 122 |
| GO:001082118 | Oral cavity | LP | regulation of mitochondrion organization | 65/4623 | 144/18723 | 6.61e-08 | 2.24e-06 | 65 |
| Page: 1 2 |
| Pathway ID | Tissue | Disease Stage | Description | Gene Ratio | Bg Ratio | pvalue | p.adjust | qvalue | Count |
| Page: 1 |
Top |
Cell-cell communication analysis |
| Identification of potential cell-cell interactions between two cell types and their ligand-receptor pairs for different disease states |
| Ligand | Receptor | LRpair | Pathway | Tissue | Disease Stage |
| Page: 1 |
Top |
Single-cell gene regulatory network inference analysis |
| Find out the significant the regulons (TFs) and the target genes of each regulon across cell types for different disease states |
| TF | Cell Type | Tissue | Disease Stage | Target Gene | RSS | Regulon Activity |
| ∗The dot plots of a searched regulon are shown for all cell subpopulations in each disease state of each tissue based on the regulon specific score inferred using pySCENIC and by calculating the average expression. |
| Page: 1 |
Top |
Somatic mutation of malignant transformation related genes |
| Annotation of somatic variants for genes involved in malignant transformation |
| Hugo Symbol | Variant Class | Variant Classification | dbSNP RS | HGVSc | HGVSp | HGVSp Short | SWISSPROT | BIOTYPE | SIFT | PolyPhen | Tumor Sample Barcode | Tissue | Histology | Sex | Age | Stage | Therapy Types | Drugs | Outcome |
| PISD | SNV | Missense_Mutation | novel | c.857N>A | p.Ala286Asp | p.A286D | Q9UG56 | protein_coding | deleterious(0.01) | probably_damaging(0.962) | TCGA-BH-A0HF-01 | Breast | breast invasive carcinoma | Female | >=65 | I/II | Hormone Therapy | arimidex | SD |
| PISD | SNV | Missense_Mutation | novel | c.650N>C | p.Leu217Pro | p.L217P | Q9UG56 | protein_coding | deleterious(0) | probably_damaging(0.998) | TCGA-2W-A8YY-01 | Cervix | cervical & endocervical cancer | Female | <65 | I/II | Chemotherapy | cisplatin | CR |
| PISD | SNV | Missense_Mutation | rs553274797 | c.213N>T | p.Arg72Trp | p.R72W | protein_coding | tolerated(0.13) | benign(0.03) | TCGA-DS-A1OB-01 | Cervix | cervical & endocervical cancer | Female | <65 | I/II | Chemotherapy | carboplatin | PD | |
| PISD | SNV | Missense_Mutation | novel | c.248G>A | p.Arg83His | p.R83H | Q9UG56 | protein_coding | deleterious(0) | probably_damaging(0.996) | TCGA-MA-AA42-01 | Cervix | cervical & endocervical cancer | Female | >=65 | I/II | Unknown | Unknown | SD |
| PISD | SNV | Missense_Mutation | novel | c.559N>T | p.Pro187Ser | p.P187S | Q9UG56 | protein_coding | deleterious(0.03) | benign(0.171) | TCGA-ZJ-AAXD-01 | Cervix | cervical & endocervical cancer | Female | <65 | III/IV | Unknown | Unknown | SD |
| PISD | SNV | Missense_Mutation | rs567105342 | c.995N>A | p.Arg332His | p.R332H | Q9UG56 | protein_coding | tolerated(0.17) | benign(0.019) | TCGA-A6-A565-01 | Colorectum | colon adenocarcinoma | Female | <65 | III/IV | Unspecific | 5FU | PD |
| PISD | SNV | Missense_Mutation | rs760491476 | c.111N>T | p.Arg38Cys | p.R38C | protein_coding | tolerated_low_confidence(0.18) | benign(0) | TCGA-AA-3492-01 | Colorectum | colon adenocarcinoma | Female | >=65 | I/II | Unknown | Unknown | SD | |
| PISD | SNV | Missense_Mutation | rs760199435 | c.599C>T | p.Ala200Val | p.A200V | Q9UG56 | protein_coding | tolerated(0.37) | benign(0.003) | TCGA-AD-A5EJ-01 | Colorectum | colon adenocarcinoma | Female | >=65 | I/II | Unknown | Unknown | SD |
| PISD | SNV | Missense_Mutation | c.119N>T | p.Ala40Val | p.A40V | Q9UG56 | protein_coding | deleterious_low_confidence(0.03) | benign(0.022) | TCGA-AZ-6601-01 | Colorectum | colon adenocarcinoma | Male | >=65 | I/II | Unknown | Unknown | PD | |
| PISD | SNV | Missense_Mutation | rs138347447 | c.22N>T | p.Arg8Trp | p.R8W | Q9UG56 | protein_coding | deleterious_low_confidence(0.02) | benign(0.231) | TCGA-CM-6171-01 | Colorectum | colon adenocarcinoma | Female | >=65 | I/II | Unknown | Unknown | SD |
| Page: 1 2 3 4 5 |
Top |
Related drugs of malignant transformation related genes |
| Identification of chemicals and drugs interact with genes involved in malignant transfromation |
| (DGIdb 4.0) |
| Entrez ID | Symbol | Category | Interaction Types | Drug Claim Name | Drug Name | PMIDs |
| Page: 1 |

Copyright 2023-Present -The University of Texas Health Science Center at Houston |