
|
|||||
|
 | |
| |
| |
| |
| |
| |
|
Gene: PHTF1 |
Gene summary for PHTF1 |
| Gene information | Species | Human | Gene symbol | PHTF1 | Gene ID | 10745 |
| Gene name | putative homeodomain transcription factor 1 | |
| Gene Alias | PHTF | |
| Cytomap | 1p13.2 | |
| Gene Type | protein-coding | GO ID | GO:0005575 | UniProtAcc | Q9UMS5 |
Top |
Malignant transformation analysis |
| Identification of the aberrant gene expression in precancerous and cancerous lesions by comparing the gene expression of stem-like cells in diseased tissues with normal stem cells |
| Entrez ID | Symbol | Replicates | Species | Organ | Tissue | Adj P-value | Log2FC | Malignancy |
| 10745 | PHTF1 | P83T-E | Human | Esophagus | ESCC | 2.37e-06 | 2.21e-01 | 0.1738 |
| 10745 | PHTF1 | P91T-E | Human | Esophagus | ESCC | 2.62e-02 | 3.51e-01 | 0.1828 |
| 10745 | PHTF1 | P107T-E | Human | Esophagus | ESCC | 5.44e-04 | 1.16e-01 | 0.171 |
| 10745 | PHTF1 | P127T-E | Human | Esophagus | ESCC | 7.94e-10 | 1.39e-01 | 0.0826 |
| 10745 | PHTF1 | P128T-E | Human | Esophagus | ESCC | 7.07e-20 | 6.15e-01 | 0.1241 |
| 10745 | PHTF1 | P130T-E | Human | Esophagus | ESCC | 5.98e-36 | 6.99e-01 | 0.1676 |
| 10745 | PHTF1 | HCC1_Meng | Human | Liver | HCC | 4.83e-16 | 7.68e-04 | 0.0246 |
| 10745 | PHTF1 | HCC2_Meng | Human | Liver | HCC | 2.73e-10 | 5.09e-02 | 0.0107 |
| 10745 | PHTF1 | HCC2 | Human | Liver | HCC | 9.84e-03 | 1.93e+00 | 0.5341 |
| 10745 | PHTF1 | S014 | Human | Liver | HCC | 2.71e-13 | 5.07e-01 | 0.2254 |
| 10745 | PHTF1 | S015 | Human | Liver | HCC | 1.87e-12 | 5.78e-01 | 0.2375 |
| 10745 | PHTF1 | S016 | Human | Liver | HCC | 1.19e-12 | 4.50e-01 | 0.2243 |
| 10745 | PHTF1 | S027 | Human | Liver | HCC | 2.46e-03 | 4.31e-01 | 0.2446 |
| 10745 | PHTF1 | S028 | Human | Liver | HCC | 7.20e-14 | 5.54e-01 | 0.2503 |
| 10745 | PHTF1 | S029 | Human | Liver | HCC | 3.85e-11 | 4.63e-01 | 0.2581 |
| 10745 | PHTF1 | PTC01 | Human | Thyroid | PTC | 1.74e-06 | 4.51e-02 | 0.1899 |
| 10745 | PHTF1 | PTC06 | Human | Thyroid | PTC | 9.28e-06 | 1.48e-01 | 0.2057 |
| 10745 | PHTF1 | PTC07 | Human | Thyroid | PTC | 3.69e-07 | 7.13e-02 | 0.2044 |
| 10745 | PHTF1 | ATC09 | Human | Thyroid | ATC | 4.41e-03 | 2.01e-01 | 0.2871 |
| 10745 | PHTF1 | ATC11 | Human | Thyroid | ATC | 4.91e-04 | 3.62e-01 | 0.3386 |
| Page: 1 2 3 4 |
| Tissue | Expression Dynamics | Abbreviation |
| Esophagus | 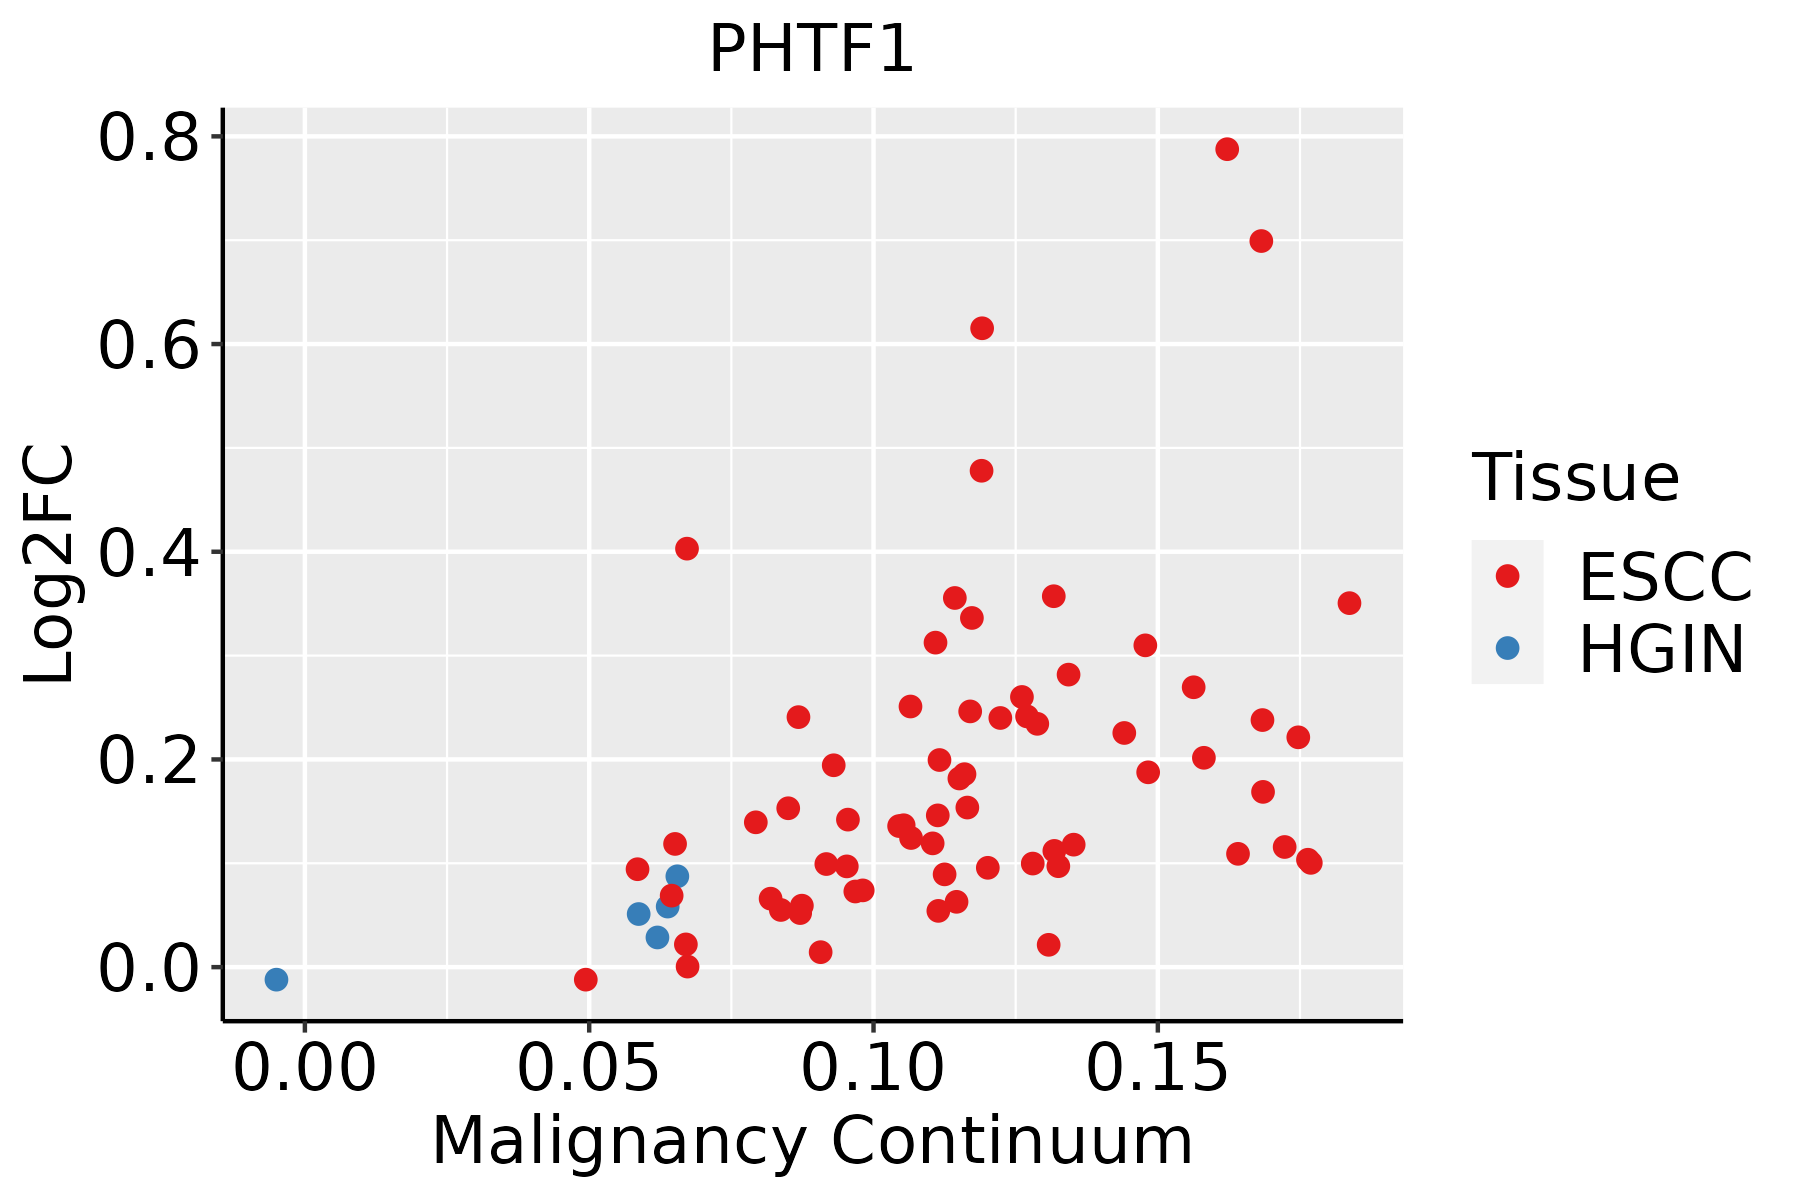 | ESCC: Esophageal squamous cell carcinoma |
| HGIN: High-grade intraepithelial neoplasias | ||
| LGIN: Low-grade intraepithelial neoplasias | ||
| Liver | 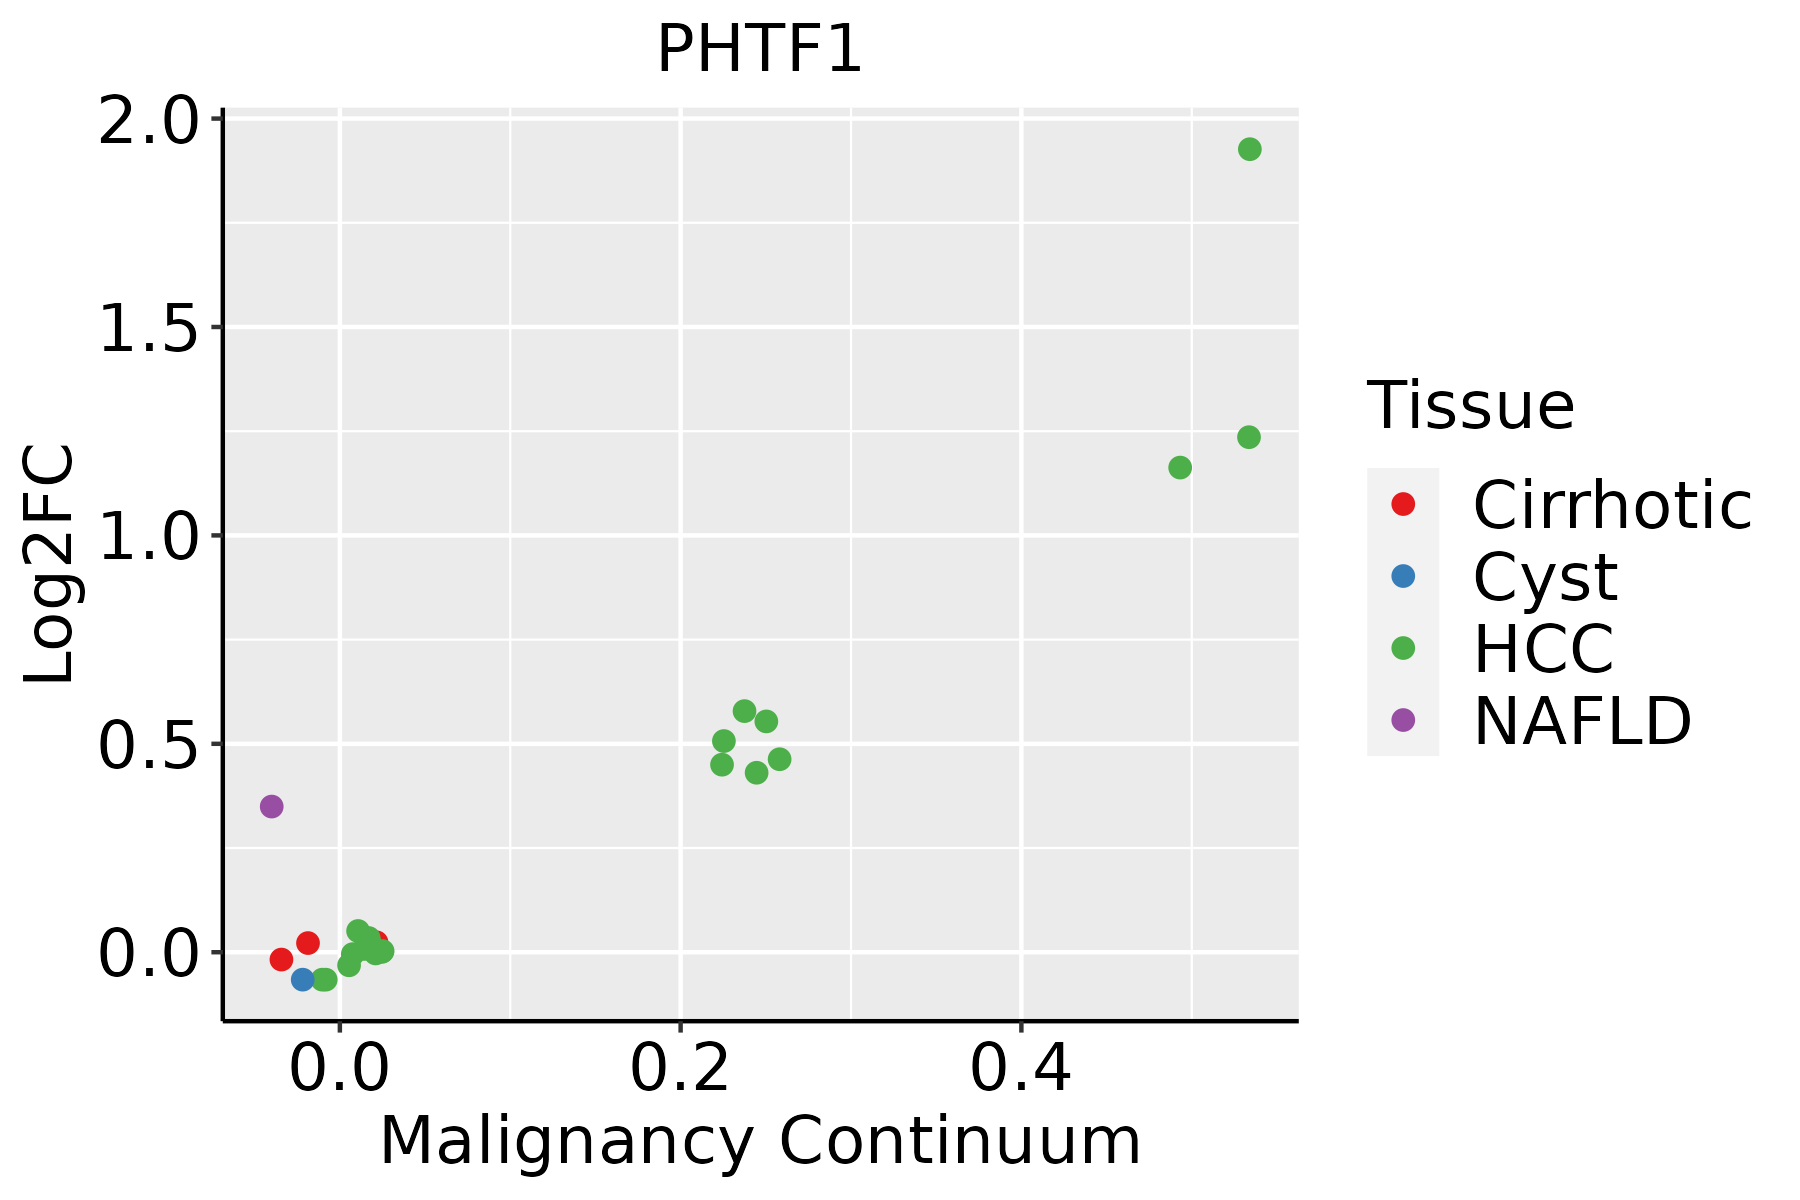 | HCC: Hepatocellular carcinoma |
| NAFLD: Non-alcoholic fatty liver disease | ||
| Thyroid | 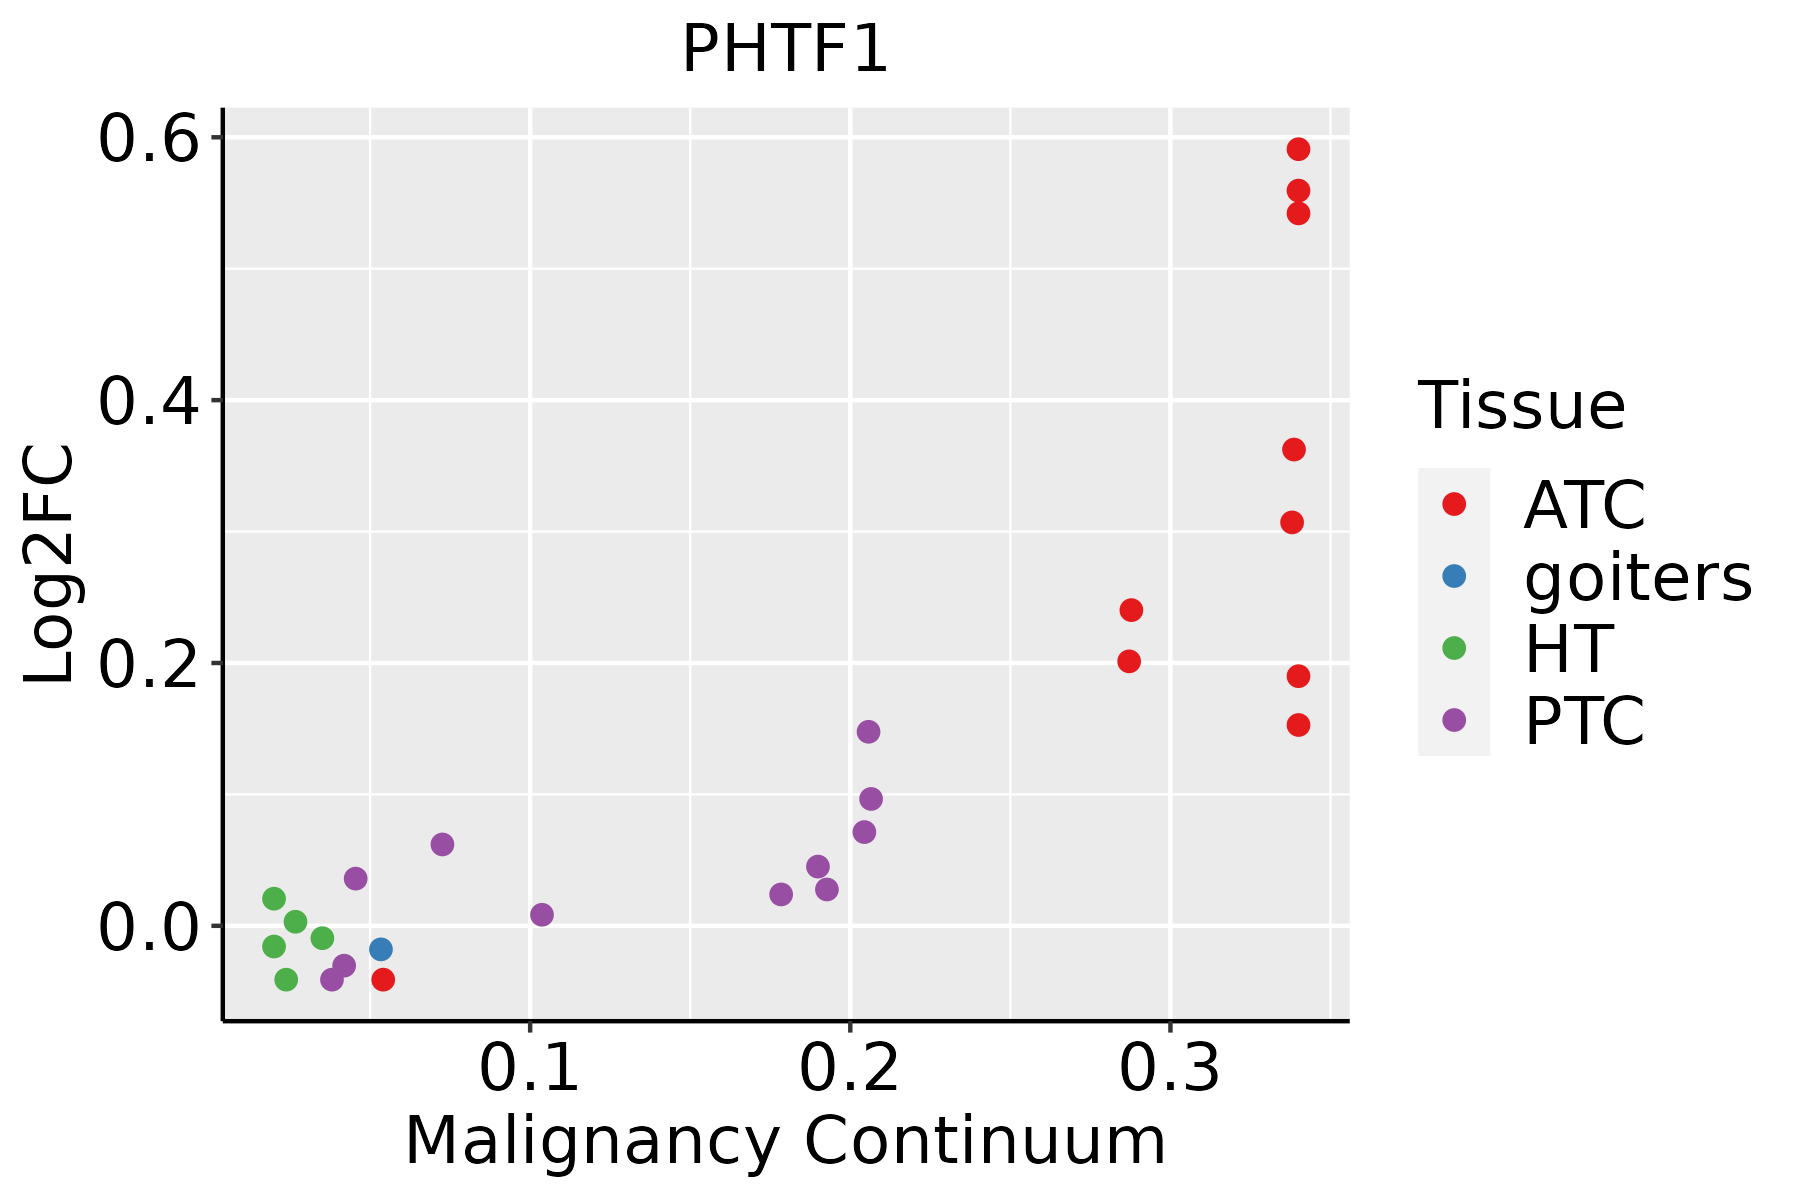 | ATC: Anaplastic thyroid cancer |
| HT: Hashimoto's thyroiditis | ||
| PTC: Papillary thyroid cancer |
| ∗log2FC in expression of this searched gene in stem-like cells from each diseased tissue sample relative to stem-like cells in normal samples in each tissue plotted against the malignancy continuum. Samples are colored based on if they are from different disease stage. |
Top |
Malignant transformation related pathway analysis |
| Find out the enriched GO biological processes and KEGG pathways involved in transition from healthy to precancer to cancer |
| Tissue | Disease Stage | Enriched GO biological Processes |
| Colorectum | AD |  |
| Colorectum | SER |  |
| Colorectum | MSS |  |
| Colorectum | MSI-H |  |
| Colorectum | FAP |  |
| ∗Top 15 enriched GO BP terms are showed in the bar plot of each disease state in each tissue. Each row represents a significant GO biological process which is colored according to the -log10(p.adjust). |
| Page: 1 2 3 4 5 6 7 8 9 |
| GO ID | Tissue | Disease Stage | Description | Gene Ratio | Bg Ratio | pvalue | p.adjust | Count |
| Page: 1 |
| Pathway ID | Tissue | Disease Stage | Description | Gene Ratio | Bg Ratio | pvalue | p.adjust | qvalue | Count |
| Page: 1 |
Top |
Cell-cell communication analysis |
| Identification of potential cell-cell interactions between two cell types and their ligand-receptor pairs for different disease states |
| Ligand | Receptor | LRpair | Pathway | Tissue | Disease Stage |
| Page: 1 |
Top |
Single-cell gene regulatory network inference analysis |
| Find out the significant the regulons (TFs) and the target genes of each regulon across cell types for different disease states |
| TF | Cell Type | Tissue | Disease Stage | Target Gene | RSS | Regulon Activity |
| ∗The dot plots of a searched regulon are shown for all cell subpopulations in each disease state of each tissue based on the regulon specific score inferred using pySCENIC and by calculating the average expression. |
| Page: 1 |
Top |
Somatic mutation of malignant transformation related genes |
| Annotation of somatic variants for genes involved in malignant transformation |
| Hugo Symbol | Variant Class | Variant Classification | dbSNP RS | HGVSc | HGVSp | HGVSp Short | SWISSPROT | BIOTYPE | SIFT | PolyPhen | Tumor Sample Barcode | Tissue | Histology | Sex | Age | Stage | Therapy Types | Drugs | Outcome |
| PHTF1 | SNV | Missense_Mutation | c.29N>G | p.Ser10Trp | p.S10W | Q9UMS5 | protein_coding | deleterious(0.01) | probably_damaging(0.963) | TCGA-A2-A0EQ-01 | Breast | breast invasive carcinoma | Female | <65 | I/II | Chemotherapy | adriamycin | SD | |
| PHTF1 | SNV | Missense_Mutation | c.1677N>A | p.Phe559Leu | p.F559L | Q9UMS5 | protein_coding | tolerated(1) | benign(0.065) | TCGA-A8-A079-01 | Breast | breast invasive carcinoma | Female | >=65 | III/IV | Chemotherapy | 5-fluorouracil | SD | |
| PHTF1 | insertion | Nonsense_Mutation | novel | c.1060_1061insTATAAGTCAGTGAATCAATCAAGTCAGTGATTCAAATCAATAAAT | p.Gly354delinsValTerValSerGluSerIleLysSerValIleGlnIleAsnLysCys | p.G354delinsV*VSESIKSVIQINKC | Q9UMS5 | protein_coding | TCGA-AO-A03T-01 | Breast | breast invasive carcinoma | Female | <65 | I/II | Chemotherapy | cyclophosphamide | SD | ||
| PHTF1 | insertion | Frame_Shift_Ins | rs750248180 | c.1637_1638insT | p.Met547HisfsTer10 | p.M547Hfs*10 | Q9UMS5 | protein_coding | TCGA-D8-A1Y1-01 | Breast | breast invasive carcinoma | Female | >=65 | III/IV | Hormone Therapy | tamoxiphen | PD | ||
| PHTF1 | SNV | Missense_Mutation | c.953N>G | p.Ser318Cys | p.S318C | Q9UMS5 | protein_coding | deleterious(0.01) | benign(0.219) | TCGA-EK-A3GJ-01 | Cervix | cervical & endocervical cancer | Female | <65 | I/II | Unknown | Unknown | SD | |
| PHTF1 | SNV | Missense_Mutation | c.702N>C | p.Lys234Asn | p.K234N | Q9UMS5 | protein_coding | tolerated(0.13) | possibly_damaging(0.704) | TCGA-EK-A3GK-01 | Cervix | cervical & endocervical cancer | Female | <65 | I/II | Unknown | Unknown | SD | |
| PHTF1 | SNV | Missense_Mutation | c.96G>C | p.Gln32His | p.Q32H | Q9UMS5 | protein_coding | deleterious(0.01) | possibly_damaging(0.837) | TCGA-MU-A51Y-01 | Cervix | cervical & endocervical cancer | Female | <65 | I/II | Unknown | Unknown | SD | |
| PHTF1 | SNV | Missense_Mutation | novel | c.1648G>A | p.Val550Met | p.V550M | Q9UMS5 | protein_coding | deleterious(0) | probably_damaging(0.999) | TCGA-VS-A9U6-01 | Cervix | cervical & endocervical cancer | Female | <65 | I/II | Chemotherapy | cisplatin | PD |
| PHTF1 | SNV | Missense_Mutation | novel | c.632N>C | p.Arg211Thr | p.R211T | Q9UMS5 | protein_coding | deleterious(0.05) | benign(0.069) | TCGA-VS-A9UZ-01 | Cervix | cervical & endocervical cancer | Female | <65 | I/II | Unknown | Unknown | SD |
| PHTF1 | SNV | Missense_Mutation | c.1476N>G | p.Phe492Leu | p.F492L | Q9UMS5 | protein_coding | tolerated(0.21) | benign(0.015) | TCGA-A6-4105-01 | Colorectum | colon adenocarcinoma | Male | >=65 | I/II | Unknown | Unknown | PD |
| Page: 1 2 3 4 5 6 7 8 9 |
Top |
Related drugs of malignant transformation related genes |
| Identification of chemicals and drugs interact with genes involved in malignant transfromation |
| (DGIdb 4.0) |
| Entrez ID | Symbol | Category | Interaction Types | Drug Claim Name | Drug Name | PMIDs |
| Page: 1 |

Copyright 2023-Present -The University of Texas Health Science Center at Houston |