Schematic overview of the cellular and molecular mechanisms involved in the cancer progression, including the proposed cellular and molecular mechanisms in cancer cells trajectory. AT1: alveolar type 1 cells; AT2: alveolar type 2 cells; AAH: atypical adenomatous hyperplasia; AIS: adenocarcinoma in situ; MIA: minimally invasive adenocarcinoma; IA: invasive adenocarcinoma; EMT: epithelial-mesenchymal transition

Home

Download

Statistics

Help

Contact

Center for Computational Systems Medicine
leaf

Gene summary

leaf

Malignant transformation analysis

leaf

Malignant transformation related pathway analysis

leaf

Cell-cell communication analysis

leaf

Single-cell gene regulatory network inference analysis

leaf

Somatic mutation of malignant transformation related genes

leaf

Related drugs of malignant transformation related genes

Gene: PHF23

Gene summary for PHF23

check button Gene summary.

Gene informationSpeciesHuman
Gene symbol

PHF23

Gene ID

79142

Gene namePHD finger protein 23
Gene AliashJUNE-1b
Cytomap17p13.1
Gene Typeprotein-coding
GO ID

GO:0000045

UniProtAcc

Q9BUL5


Top

Malignant transformation analysis

check button Identification of the aberrant gene expression in precancerous and cancerous lesions by comparing the gene expression of stem-like cells in diseased tissues with normal stem cells
check button Malignant transformation involving gene list.
Entrez IDSymbolReplicatesSpeciesOrganTissueAdj P-valueLog2FCMalignancy
79142PHF23P65T-EHumanEsophagusESCC1.63e-111.58e-010.0978
79142PHF23P74T-EHumanEsophagusESCC2.30e-185.86e-010.1479
79142PHF23P75T-EHumanEsophagusESCC3.60e-041.72e-010.1125
79142PHF23P76T-EHumanEsophagusESCC9.70e-043.84e-020.1207
79142PHF23P79T-EHumanEsophagusESCC1.20e-101.17e-010.1154
79142PHF23P80T-EHumanEsophagusESCC4.71e-175.24e-010.155
79142PHF23P82T-EHumanEsophagusESCC5.64e-074.06e-010.1072
79142PHF23P83T-EHumanEsophagusESCC1.58e-134.97e-010.1738
79142PHF23P91T-EHumanEsophagusESCC2.82e-026.36e-010.1828
79142PHF23P107T-EHumanEsophagusESCC1.71e-091.80e-010.171
79142PHF23P127T-EHumanEsophagusESCC1.28e-119.03e-020.0826
79142PHF23P128T-EHumanEsophagusESCC4.85e-228.32e-010.1241
79142PHF23P130T-EHumanEsophagusESCC4.39e-276.92e-010.1676
79142PHF23HCC1_MengHumanLiverHCC6.58e-402.43e-020.0246
79142PHF23HCC2_MengHumanLiverHCC3.90e-105.05e-020.0107
79142PHF23cirrhotic1HumanLiverCirrhotic2.24e-071.37e-010.0202
79142PHF23HCC2HumanLiverHCC8.97e-052.23e+000.5341
79142PHF23Pt13.bHumanLiverHCC1.81e-024.73e-020.0251
79142PHF23S014HumanLiverHCC6.53e-155.01e-010.2254
79142PHF23S015HumanLiverHCC5.81e-094.34e-010.2375
Page: 1 2 3 4 

check button Transcriptomic changes along malignancy continuum.
TissueExpression DynamicsAbbreviation
EsophagusThe image shows the transcriptomic changes along malignancy continuum.log2FC in expression of this searched gene in stem-like cells from each diseased tissue sample relative to stem-like cells in normal samples in each tissue plotted against the malignancy continuum. Samples are colored based on if they are from different disease stage.
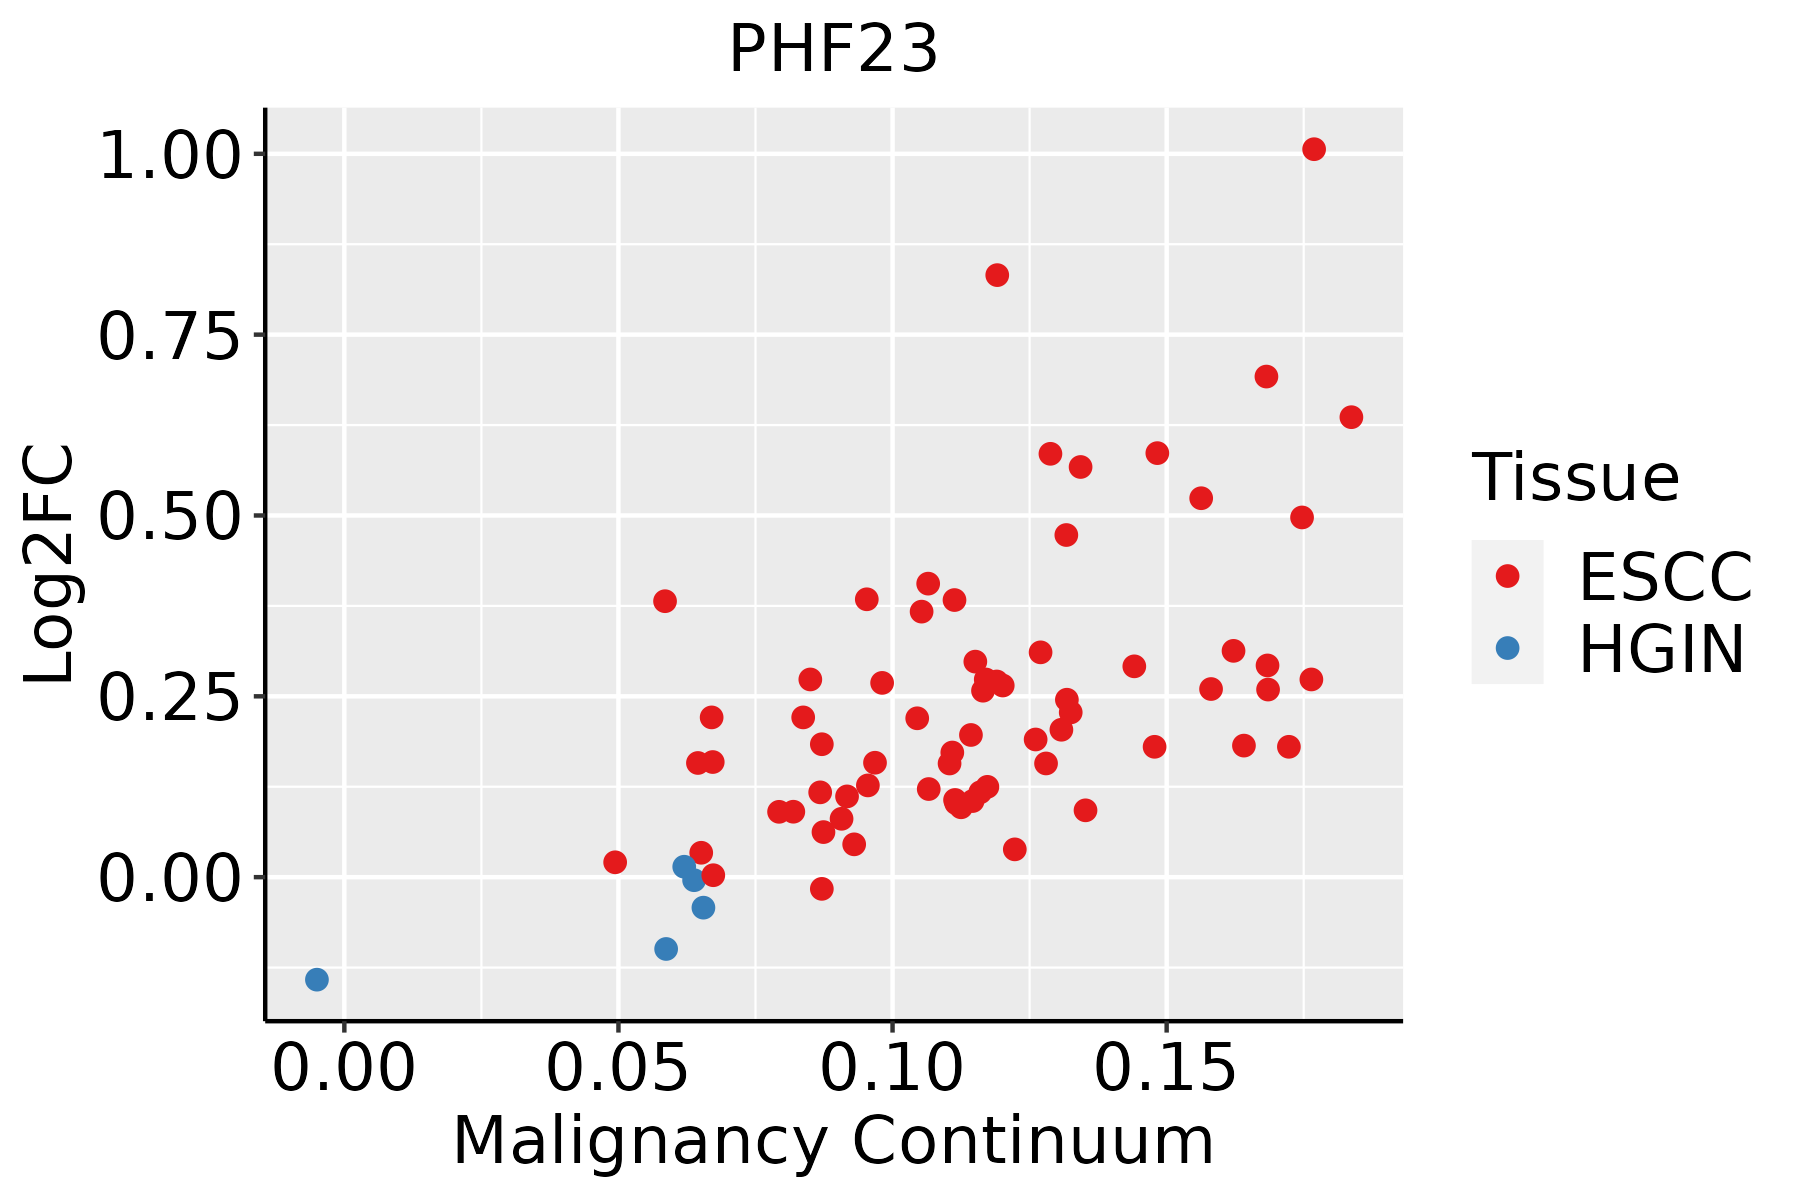
ESCC: Esophageal squamous cell carcinoma
HGIN: High-grade intraepithelial neoplasias
LGIN: Low-grade intraepithelial neoplasias
LiverThe image shows the transcriptomic changes along malignancy continuum.log2FC in expression of this searched gene in stem-like cells from each diseased tissue sample relative to stem-like cells in normal samples in each tissue plotted against the malignancy continuum. Samples are colored based on if they are from different disease stage.
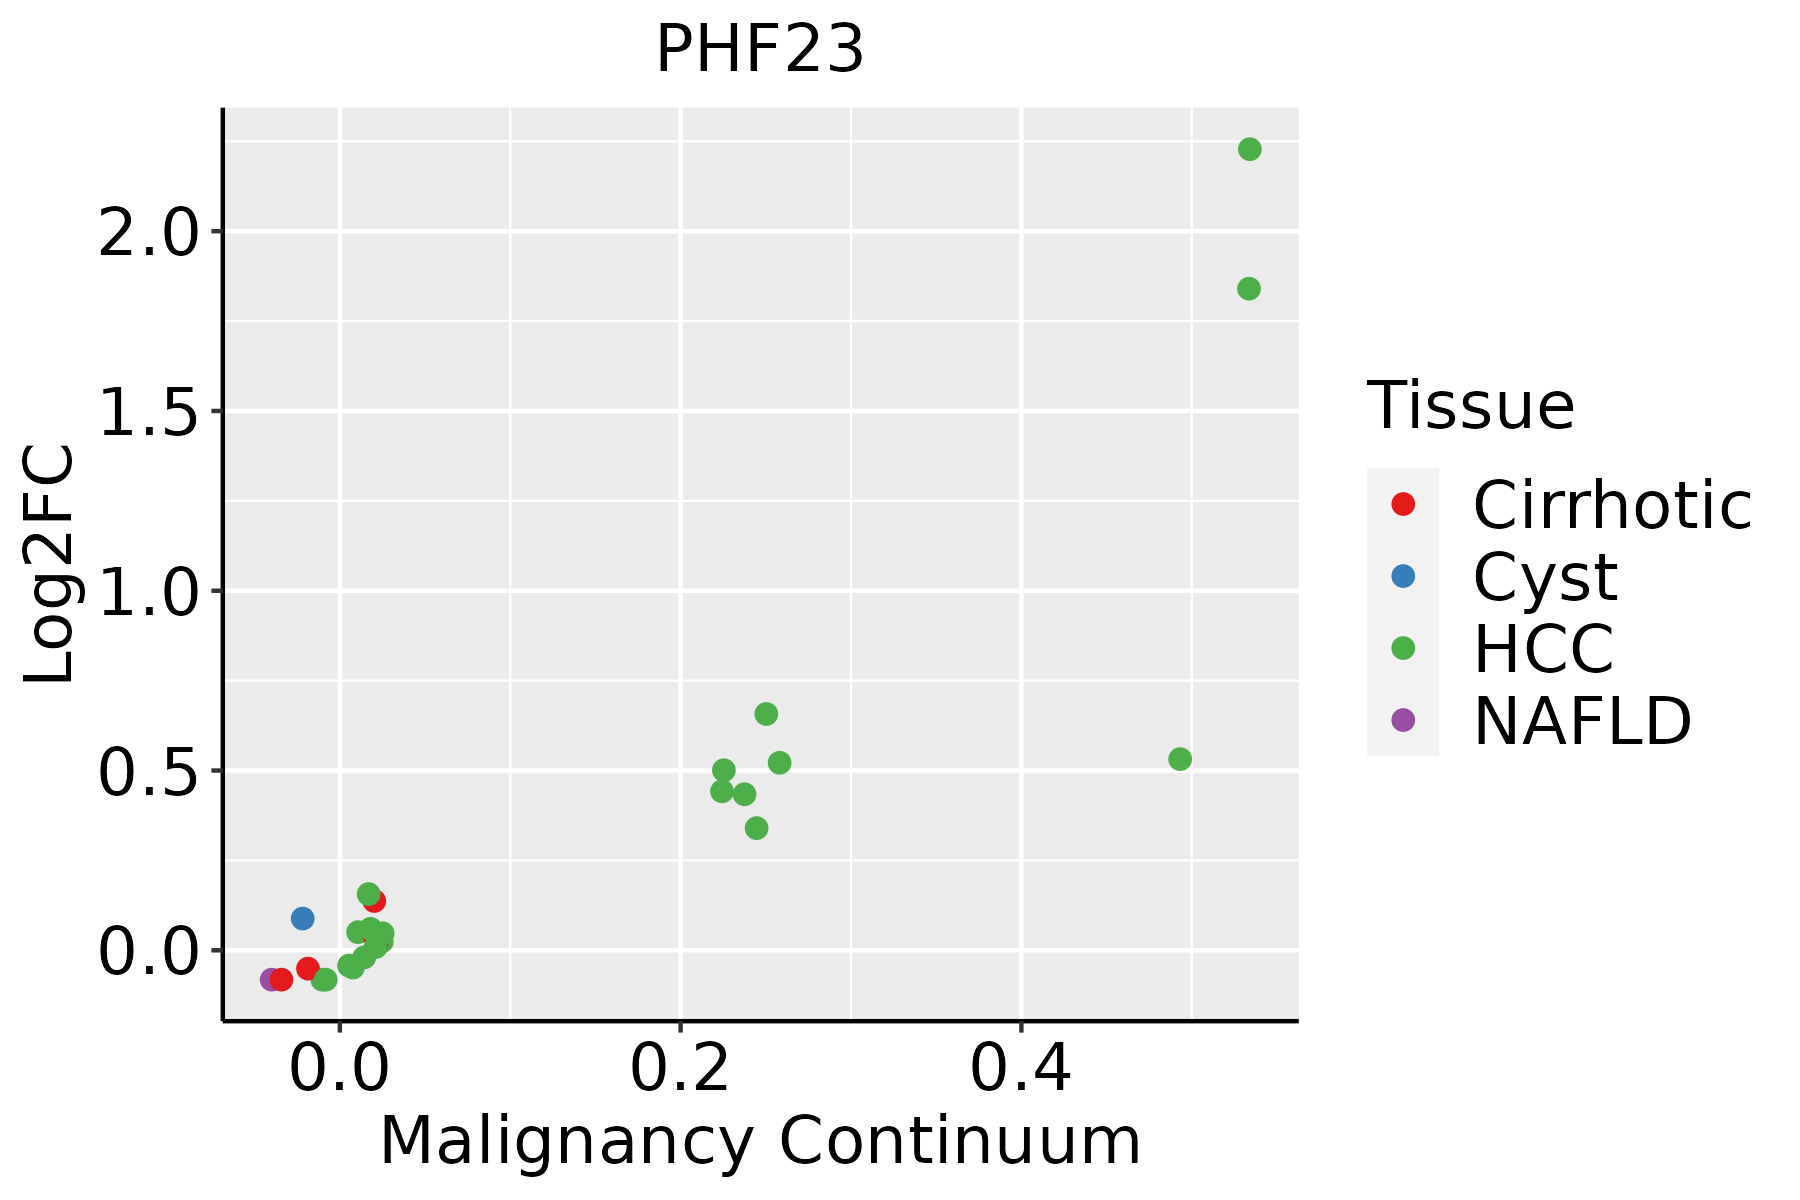
HCC: Hepatocellular carcinoma
NAFLD: Non-alcoholic fatty liver disease
Oral CavityThe image shows the transcriptomic changes along malignancy continuum.log2FC in expression of this searched gene in stem-like cells from each diseased tissue sample relative to stem-like cells in normal samples in each tissue plotted against the malignancy continuum. Samples are colored based on if they are from different disease stage.
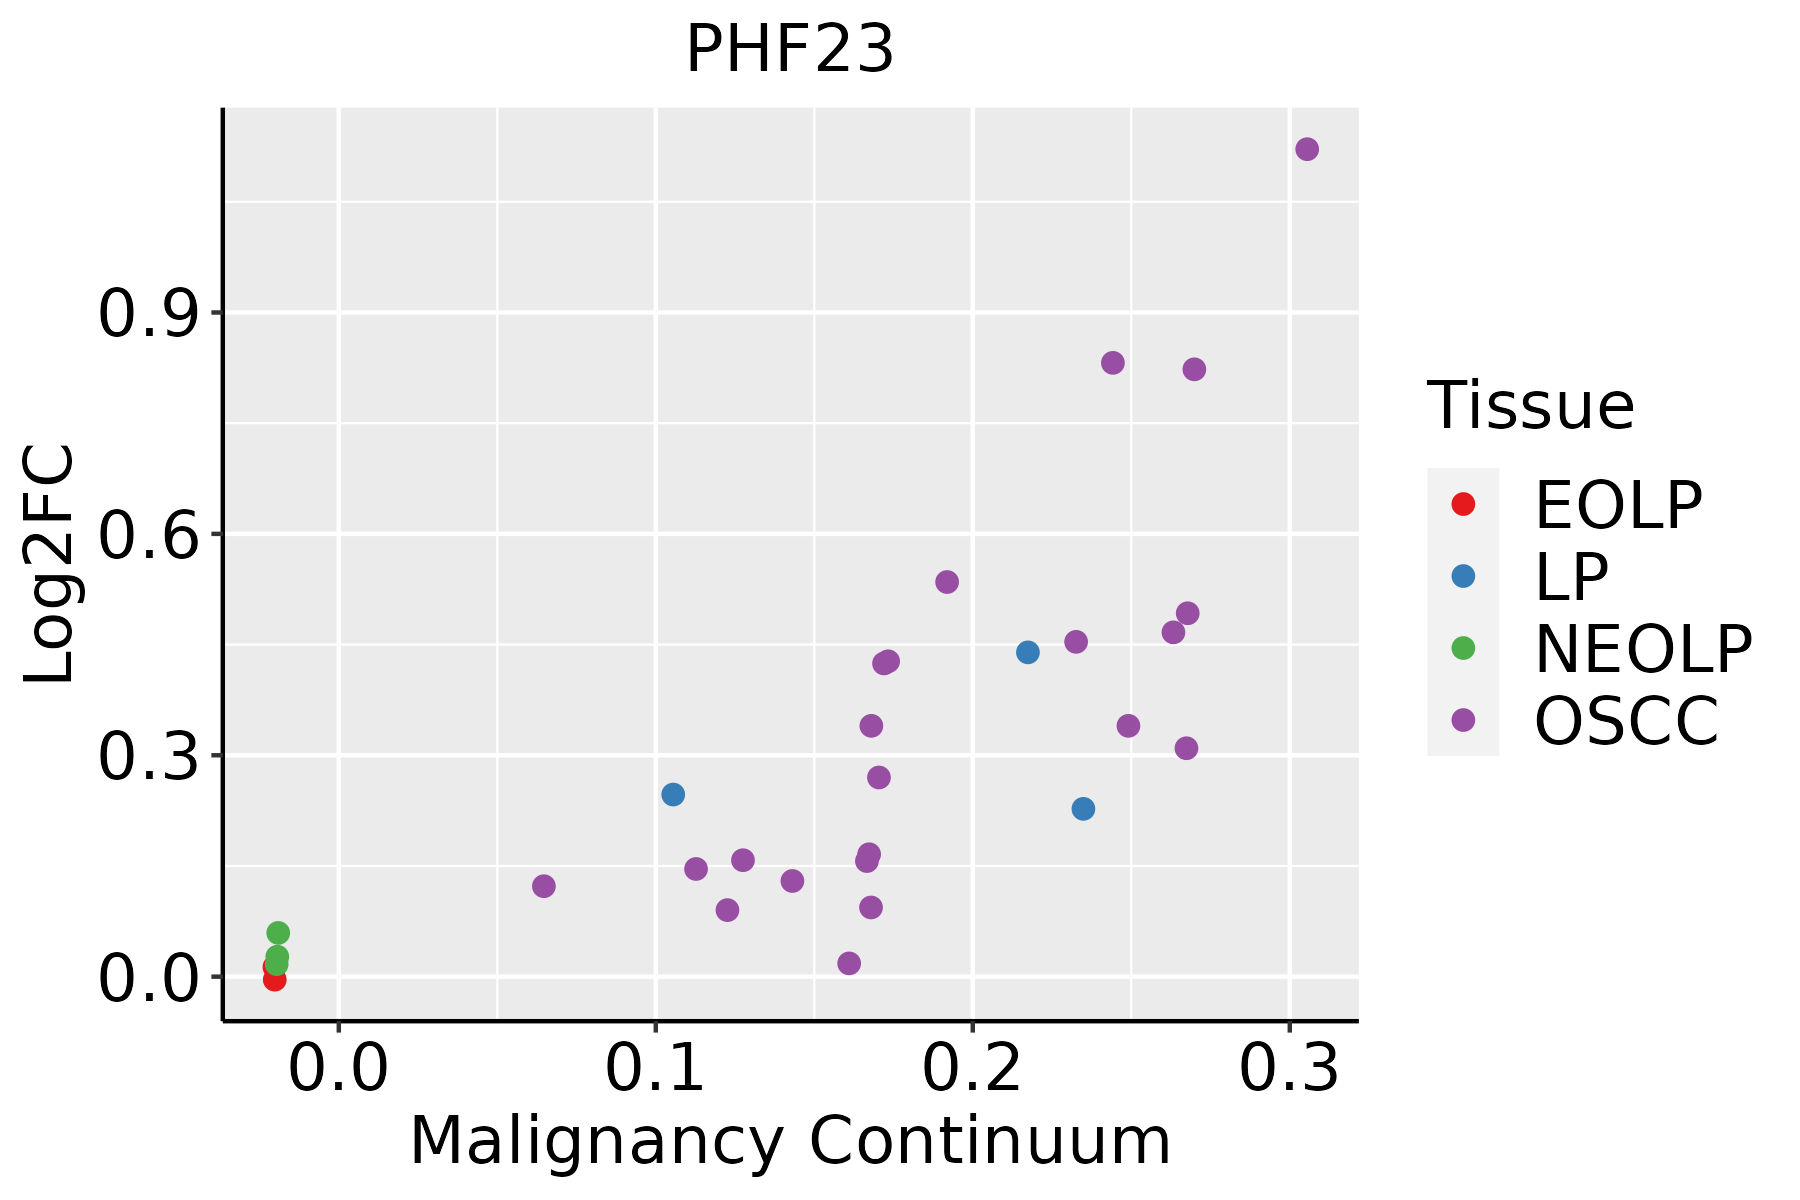
EOLP: Erosive Oral lichen planus
LP: leukoplakia
NEOLP: Non-erosive oral lichen planus
OSCC: Oral squamous cell carcinoma
SkinThe image shows the transcriptomic changes along malignancy continuum.log2FC in expression of this searched gene in stem-like cells from each diseased tissue sample relative to stem-like cells in normal samples in each tissue plotted against the malignancy continuum. Samples are colored based on if they are from different disease stage.
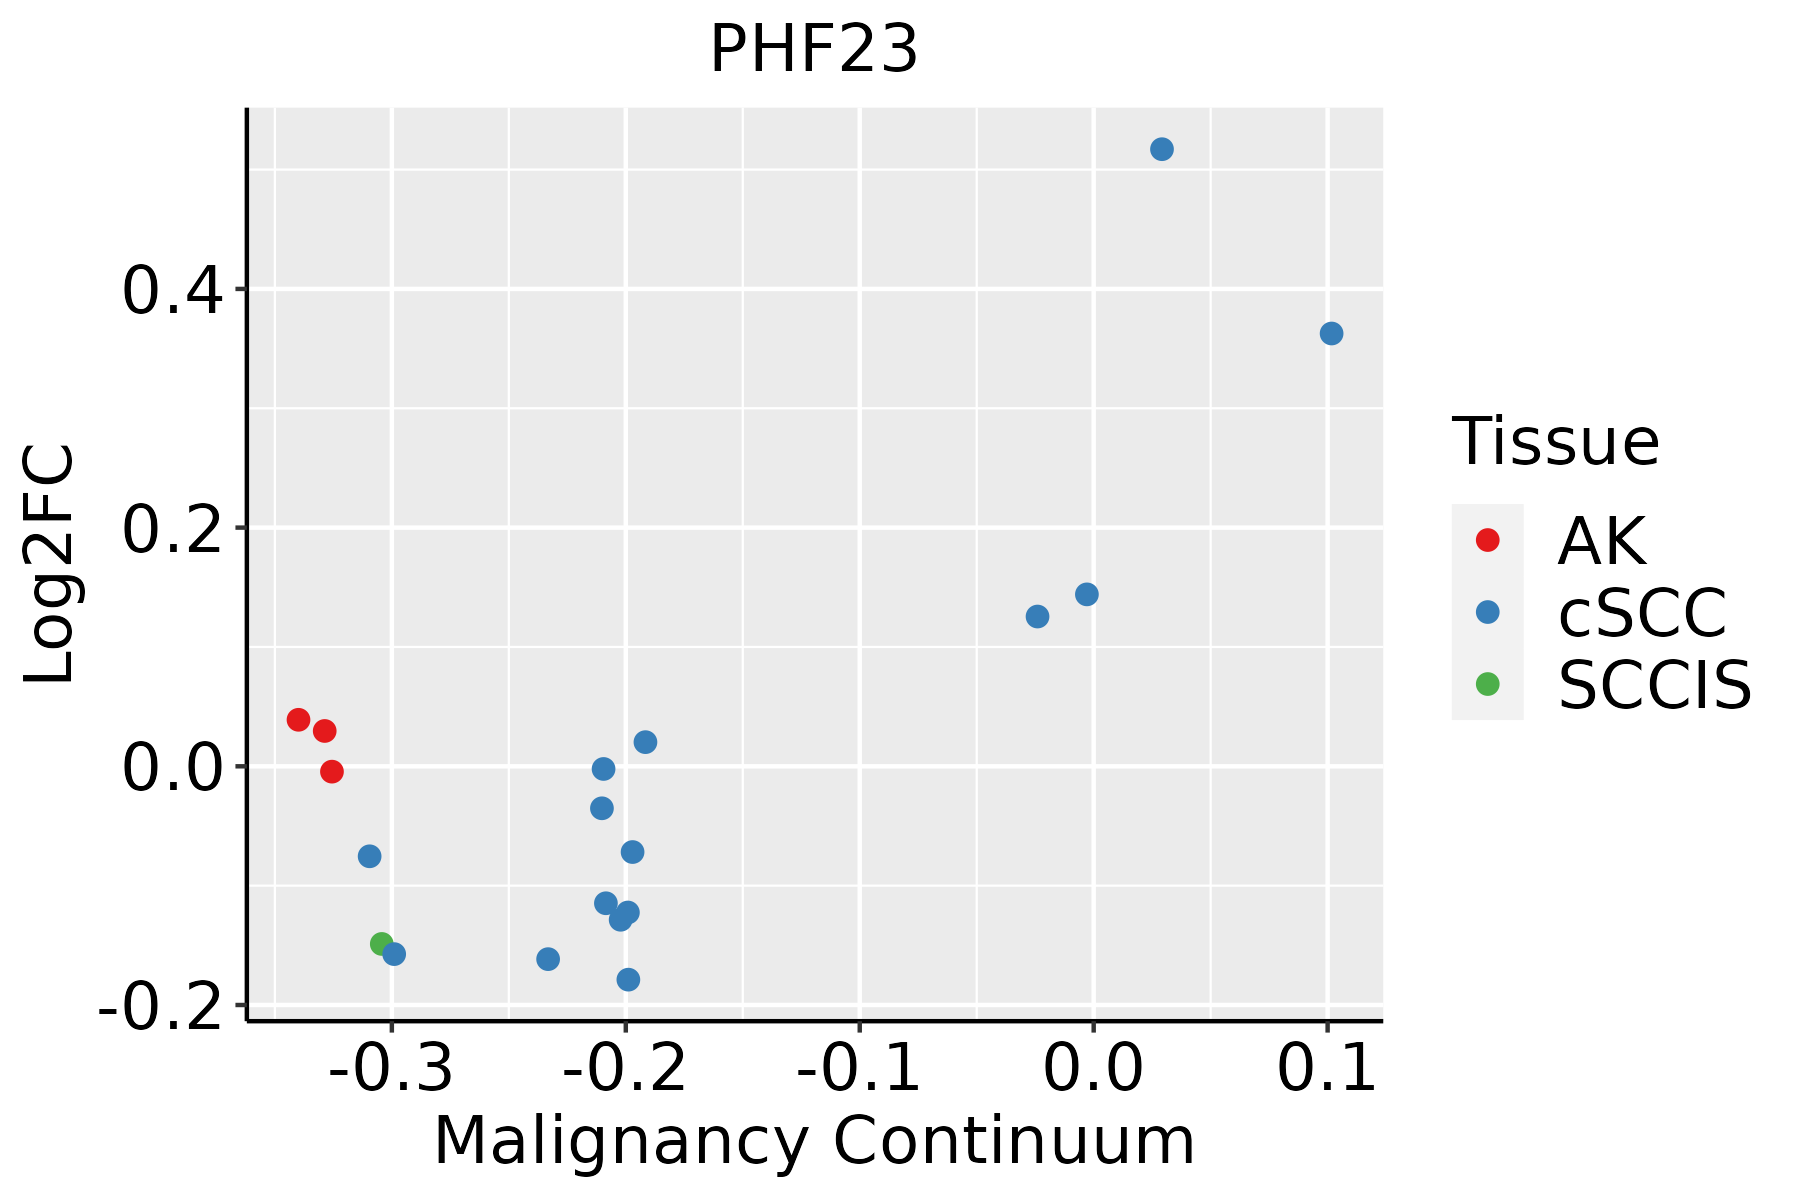
AK: Actinic keratosis
cSCC: Cutaneous squamous cell carcinoma
SCCIS:squamous cell carcinoma in situ
∗log2FC in expression of this searched gene in stem-like cells from each diseased tissue sample relative to stem-like cells in normal samples in each tissue plotted against the malignancy continuum. Samples are colored based on if they are from different disease stage.

Top

Malignant transformation related pathway analysis

check buttonFind out the enriched GO biological processes and KEGG pathways involved in transition from healthy to precancer to cancer
check button Figure of enriched GO biological processes.
TissueDisease StageEnriched GO biological Processes
ColorectumADGO analysis - Figure of enriched GO biological processes: Top 15 enriched GO BP terms are showed in the bar plot of each disease state in each tissue. Each row represents a significant GO biological process which is colored according to the -log10(p.adjust).
ColorectumSERGO analysis - Figure of enriched GO biological processes: Top 15 enriched GO BP terms are showed in the bar plot of each disease state in each tissue. Each row represents a significant GO biological process which is colored according to the -log10(p.adjust).
ColorectumMSSGO analysis - Figure of enriched GO biological processes: Top 15 enriched GO BP terms are showed in the bar plot of each disease state in each tissue. Each row represents a significant GO biological process which is colored according to the -log10(p.adjust).
ColorectumMSI-HGO analysis - Figure of enriched GO biological processes: Top 15 enriched GO BP terms are showed in the bar plot of each disease state in each tissue. Each row represents a significant GO biological process which is colored according to the -log10(p.adjust).
ColorectumFAPGO analysis - Figure of enriched GO biological processes: Top 15 enriched GO BP terms are showed in the bar plot of each disease state in each tissue. Each row represents a significant GO biological process which is colored according to the -log10(p.adjust).
∗Top 15 enriched GO BP terms are showed in the bar plot of each disease state in each tissue. Each row represents a significant GO biological process which is colored according to the -log10(p.adjust).
Page: 1 2 3 4 5 6 7 8 9 

check button Enriched GO biological processes.
GO IDTissueDisease StageDescriptionGene RatioBg Ratiopvaluep.adjustCount
GO:001623617EsophagusESCCmacroautophagy216/8552291/187231.94e-234.57e-21216
GO:0022411111EsophagusESCCcellular component disassembly305/8552443/187231.94e-234.57e-21305
GO:1903320111EsophagusESCCregulation of protein modification by small protein conjugation or removal181/8552242/187231.80e-202.60e-18181
GO:001050617EsophagusESCCregulation of autophagy220/8552317/187236.72e-186.36e-16220
GO:0031396111EsophagusESCCregulation of protein ubiquitination154/8552210/187232.70e-162.04e-14154
GO:000703314EsophagusESCCvacuole organization127/8552180/187231.04e-113.85e-10127
GO:003298416EsophagusESCCprotein-containing complex disassembly151/8552224/187233.45e-111.15e-09151
GO:001624114EsophagusESCCregulation of macroautophagy102/8552141/187231.09e-103.27e-09102
GO:0009895111EsophagusESCCnegative regulation of catabolic process201/8552320/187233.88e-101.05e-08201
GO:190332216EsophagusESCCpositive regulation of protein modification by small protein conjugation or removal99/8552138/187234.39e-101.16e-0899
GO:0010639110EsophagusESCCnegative regulation of organelle organization215/8552348/187238.20e-102.01e-08215
GO:0031330111EsophagusESCCnegative regulation of cellular catabolic process166/8552262/187235.17e-091.08e-07166
GO:190503712EsophagusESCCautophagosome organization73/8552103/187231.88e-072.93e-0673
GO:003139816EsophagusESCCpositive regulation of protein ubiquitination82/8552119/187232.41e-073.64e-0682
GO:000004513EsophagusESCCautophagosome assembly69/855299/187231.10e-061.38e-0569
GO:190211514EsophagusESCCregulation of organelle assembly116/8552186/187233.15e-063.53e-05116
GO:00973523EsophagusESCCautophagosome maturation31/855240/187234.04e-053.26e-0431
GO:001050712EsophagusESCCnegative regulation of autophagy56/855285/187231.34e-049.09e-0456
GO:00432446EsophagusESCCregulation of protein-containing complex disassembly75/8552121/187232.17e-041.36e-0375
GO:001624211EsophagusESCCnegative regulation of macroautophagy26/855234/187232.53e-041.55e-0326
Page: 1 2 3 4 5 6 

check button Enriched KEGG pathways.
Pathway IDTissueDisease StageDescriptionGene RatioBg Ratiopvaluep.adjustqvalueCount
Page: 1 

Top

Cell-cell communication analysis

check buttonIdentification of potential cell-cell interactions between two cell types and their ligand-receptor pairs for different disease states
LigandReceptorLRpairPathwayTissueDisease Stage
Page: 1 

Top

Single-cell gene regulatory network inference analysis

check buttonFind out the significant the regulons (TFs) and the target genes of each regulon across cell types for different disease states
TFCell TypeTissueDisease StageTarget GeneRSSRegulon Activity
∗The dot plots of a searched regulon are shown for all cell subpopulations in each disease state of each tissue based on the regulon specific score inferred using pySCENIC and by calculating the average expression.
Page: 1 

Top

Somatic mutation of malignant transformation related genes

check buttonAnnotation of somatic variants for genes involved in malignant transformation
Hugo SymbolVariant ClassVariant ClassificationdbSNP RSHGVScHGVSpHGVSp ShortSWISSPROTBIOTYPESIFTPolyPhenTumor Sample BarcodeTissueHistologySexAgeStageTherapy TypesDrugsOutcome
PHF23SNVMissense_Mutationnovelc.536N>Ap.Arg179Glnp.R179QQ9BUL5protein_codingtolerated_low_confidence(0.17)possibly_damaging(0.457)TCGA-AN-A046-01Breastbreast invasive carcinomaFemale>=65I/IIUnknownUnknownSD
PHF23SNVMissense_Mutationc.157N>Cp.Glu53Glnp.E53QQ9BUL5protein_codingtolerated(0.05)benign(0.27)TCGA-D8-A1J8-01Breastbreast invasive carcinomaFemale>=65I/IIHormone TherapynolvadexSD
PHF23insertionFrame_Shift_Insnovelc.1087_1088insCTTCCTGGGTATCp.Ile363ThrfsTer11p.I363Tfs*11Q9BUL5protein_codingTCGA-B6-A0IN-01Breastbreast invasive carcinomaFemale<65I/IIUnknownUnknownPD
PHF23SNVMissense_Mutationrs201898433c.557N>Ap.Arg186Glnp.R186QQ9BUL5protein_codingtolerated_low_confidence(0.05)possibly_damaging(0.629)TCGA-2W-A8YY-01Cervixcervical & endocervical cancerFemale<65I/IIChemotherapycisplatinCR
PHF23SNVMissense_Mutationc.64N>Ap.Gln22Lysp.Q22KQ9BUL5protein_codingtolerated(1)benign(0.258)TCGA-EK-A2PL-01Cervixcervical & endocervical cancerFemale<65III/IVUnknownUnknownSD
PHF23SNVMissense_Mutationc.552N>Tp.Lys184Asnp.K184NQ9BUL5protein_codingdeleterious_low_confidence(0.02)probably_damaging(0.991)TCGA-AA-3977-01Colorectumcolon adenocarcinomaMale>=65I/IIUnknownUnknownSD
PHF23SNVMissense_Mutationnovelc.86N>Tp.Arg29Ilep.R29IQ9BUL5protein_codingdeleterious(0)possibly_damaging(0.694)TCGA-AA-A00N-01Colorectumcolon adenocarcinomaMale>=65I/IIUnknownUnknownPD
PHF23SNVMissense_Mutationnovelc.815N>Cp.Val272Alap.V272AQ9BUL5protein_codingtolerated_low_confidence(0.89)benign(0)TCGA-AZ-6598-01Colorectumcolon adenocarcinomaFemale>=65I/IIUnknownUnknownSD
PHF23SNVMissense_Mutationc.1072N>Ap.Leu358Metp.L358MQ9BUL5protein_codingtolerated(0.14)possibly_damaging(0.652)TCGA-G4-6586-01Colorectumcolon adenocarcinomaFemale>=65I/IIUnknownUnknownSD
PHF23SNVMissense_Mutationrs201898433c.557N>Ap.Arg186Glnp.R186QQ9BUL5protein_codingtolerated_low_confidence(0.05)possibly_damaging(0.629)TCGA-A5-A0G2-01Endometriumuterine corpus endometrioid carcinomaFemale<65III/IVUnknownUnknownSD
Page: 1 2 3 4 5 

Top

Related drugs of malignant transformation related genes

check buttonIdentification of chemicals and drugs interact with genes involved in malignant transfromation
(DGIdb 4.0)
Entrez IDSymbolCategoryInteraction TypesDrug Claim NameDrug NamePMIDs
Page: 1