
|
|||||
|
 | |
| |
| |
| |
| |
| |
|
Gene: PDCD7 |
Gene summary for PDCD7 |
| Gene information | Species | Human | Gene symbol | PDCD7 | Gene ID | 10081 |
| Gene name | programmed cell death 7 | |
| Gene Alias | 59K | |
| Cytomap | 15q22.31 | |
| Gene Type | protein-coding | GO ID | GO:0006139 | UniProtAcc | Q6IEG3 |
Top |
Malignant transformation analysis |
| Identification of the aberrant gene expression in precancerous and cancerous lesions by comparing the gene expression of stem-like cells in diseased tissues with normal stem cells |
| Entrez ID | Symbol | Replicates | Species | Organ | Tissue | Adj P-value | Log2FC | Malignancy |
| 10081 | PDCD7 | P65T-E | Human | Esophagus | ESCC | 7.54e-13 | 2.76e-01 | 0.0978 |
| 10081 | PDCD7 | P74T-E | Human | Esophagus | ESCC | 6.80e-09 | 1.76e-01 | 0.1479 |
| 10081 | PDCD7 | P75T-E | Human | Esophagus | ESCC | 4.47e-05 | 1.48e-01 | 0.1125 |
| 10081 | PDCD7 | P76T-E | Human | Esophagus | ESCC | 4.18e-06 | 2.40e-01 | 0.1207 |
| 10081 | PDCD7 | P79T-E | Human | Esophagus | ESCC | 7.02e-08 | 1.42e-01 | 0.1154 |
| 10081 | PDCD7 | P80T-E | Human | Esophagus | ESCC | 3.40e-11 | 4.71e-01 | 0.155 |
| 10081 | PDCD7 | P83T-E | Human | Esophagus | ESCC | 2.05e-13 | 3.54e-01 | 0.1738 |
| 10081 | PDCD7 | P89T-E | Human | Esophagus | ESCC | 5.17e-04 | 2.01e-01 | 0.1752 |
| 10081 | PDCD7 | P107T-E | Human | Esophagus | ESCC | 1.79e-13 | 3.18e-01 | 0.171 |
| 10081 | PDCD7 | P126T-E | Human | Esophagus | ESCC | 1.62e-02 | 6.11e-01 | 0.1125 |
| 10081 | PDCD7 | P127T-E | Human | Esophagus | ESCC | 5.30e-13 | 3.09e-01 | 0.0826 |
| 10081 | PDCD7 | P128T-E | Human | Esophagus | ESCC | 1.55e-23 | 7.94e-01 | 0.1241 |
| 10081 | PDCD7 | P130T-E | Human | Esophagus | ESCC | 3.19e-74 | 1.51e+00 | 0.1676 |
| 10081 | PDCD7 | HCC1_Meng | Human | Liver | HCC | 8.25e-73 | 9.05e-02 | 0.0246 |
| 10081 | PDCD7 | HCC2_Meng | Human | Liver | HCC | 5.33e-23 | 1.69e-01 | 0.0107 |
| 10081 | PDCD7 | cirrhotic2 | Human | Liver | Cirrhotic | 1.78e-05 | 1.37e-01 | 0.0201 |
| 10081 | PDCD7 | HCC2 | Human | Liver | HCC | 2.27e-10 | 2.78e+00 | 0.5341 |
| 10081 | PDCD7 | Pt13.b | Human | Liver | HCC | 1.53e-18 | 1.93e-01 | 0.0251 |
| 10081 | PDCD7 | S014 | Human | Liver | HCC | 2.45e-06 | 3.61e-01 | 0.2254 |
| 10081 | PDCD7 | S015 | Human | Liver | HCC | 4.42e-03 | 3.60e-01 | 0.2375 |
| Page: 1 2 3 4 5 6 |
| Tissue | Expression Dynamics | Abbreviation |
| Esophagus | 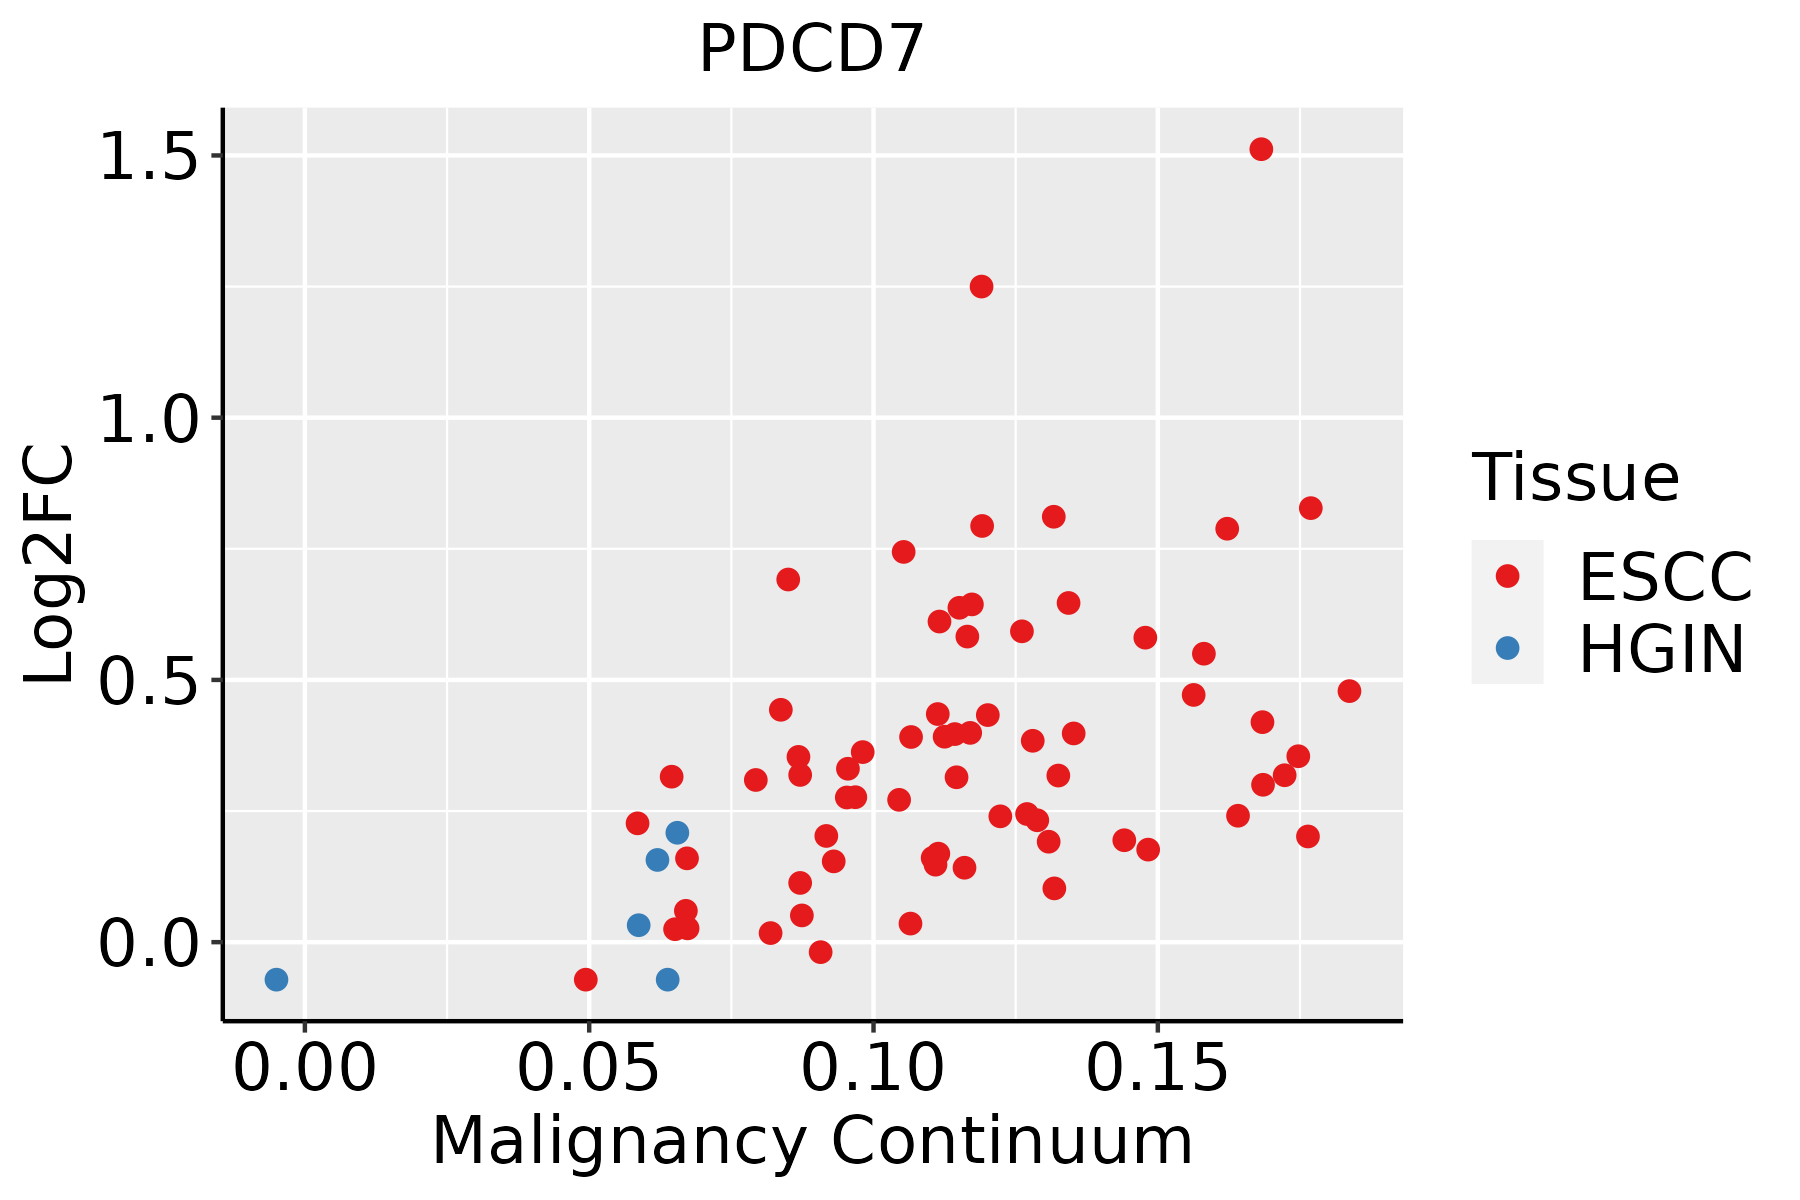 | ESCC: Esophageal squamous cell carcinoma |
| HGIN: High-grade intraepithelial neoplasias | ||
| LGIN: Low-grade intraepithelial neoplasias | ||
| Liver | 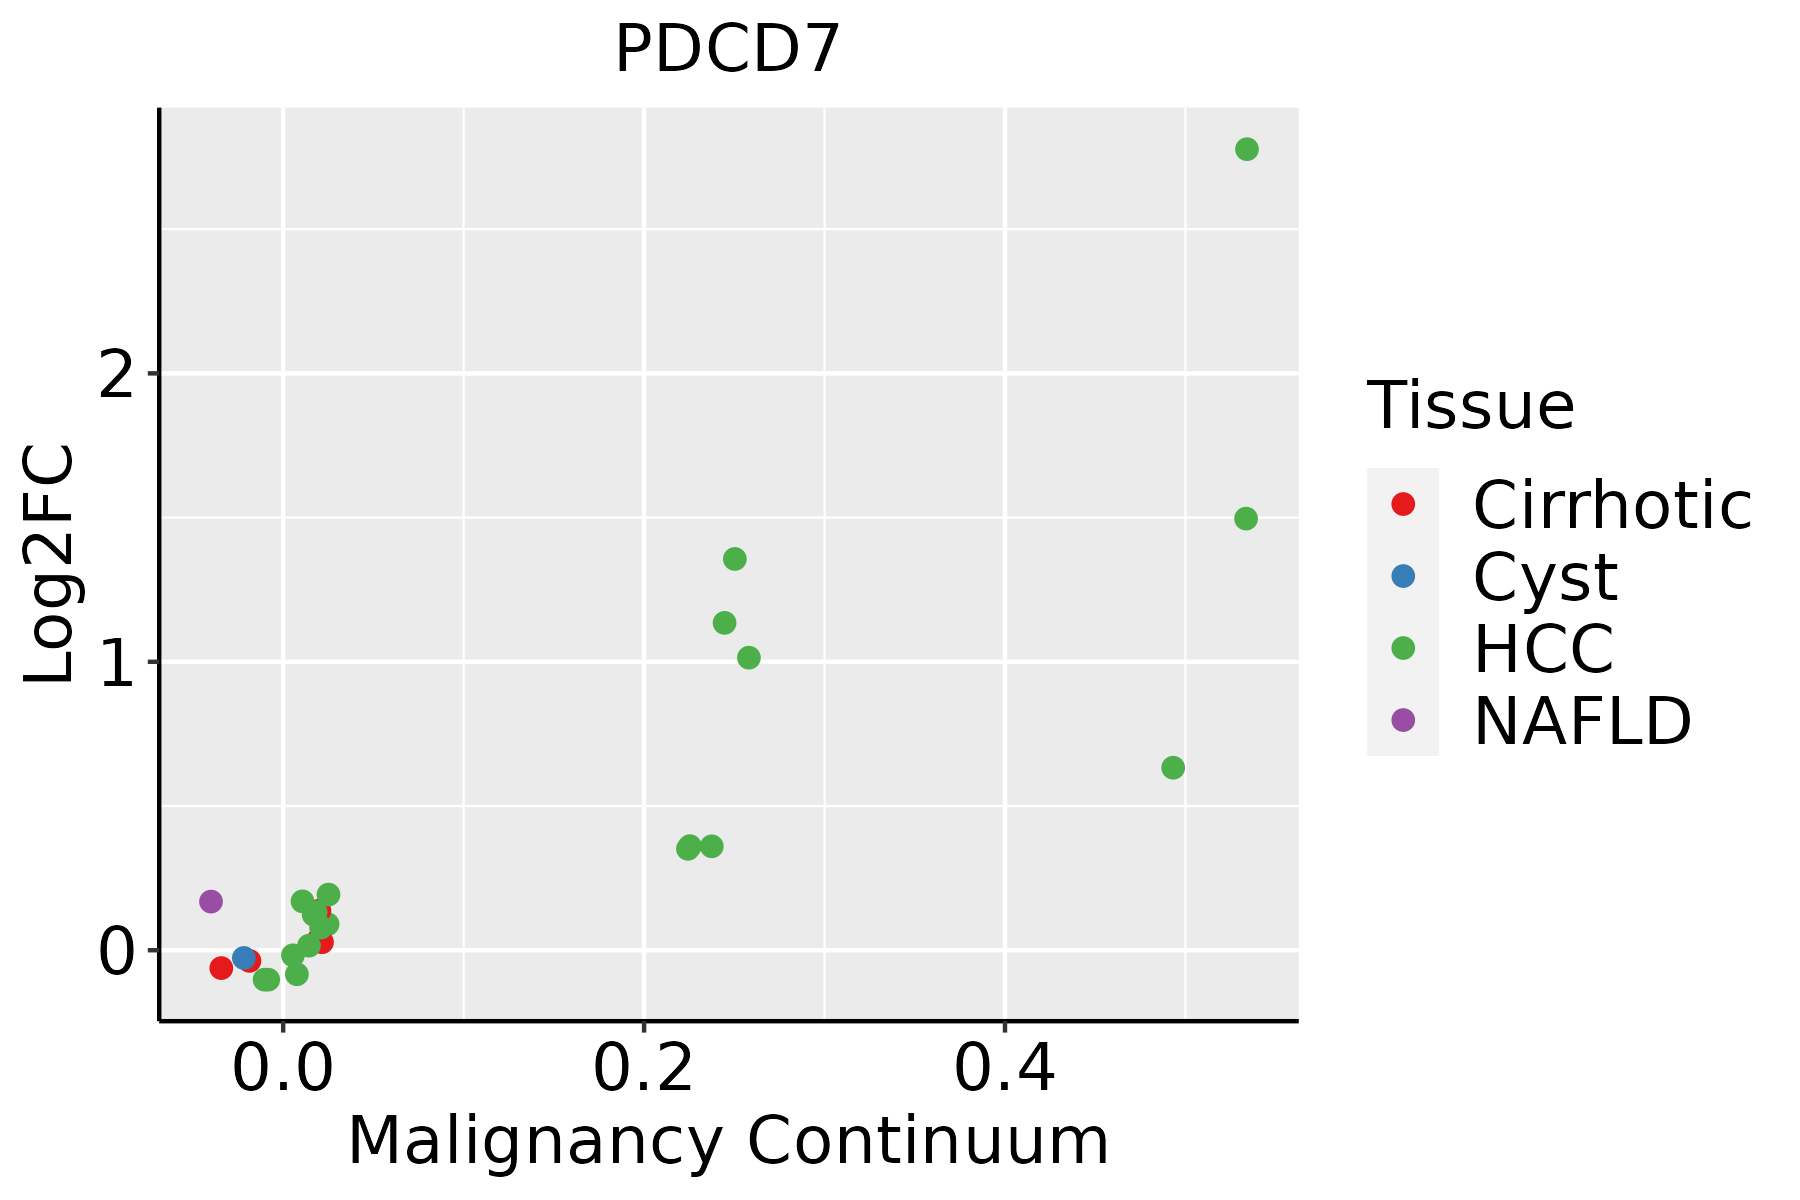 | HCC: Hepatocellular carcinoma |
| NAFLD: Non-alcoholic fatty liver disease | ||
| Oral Cavity | 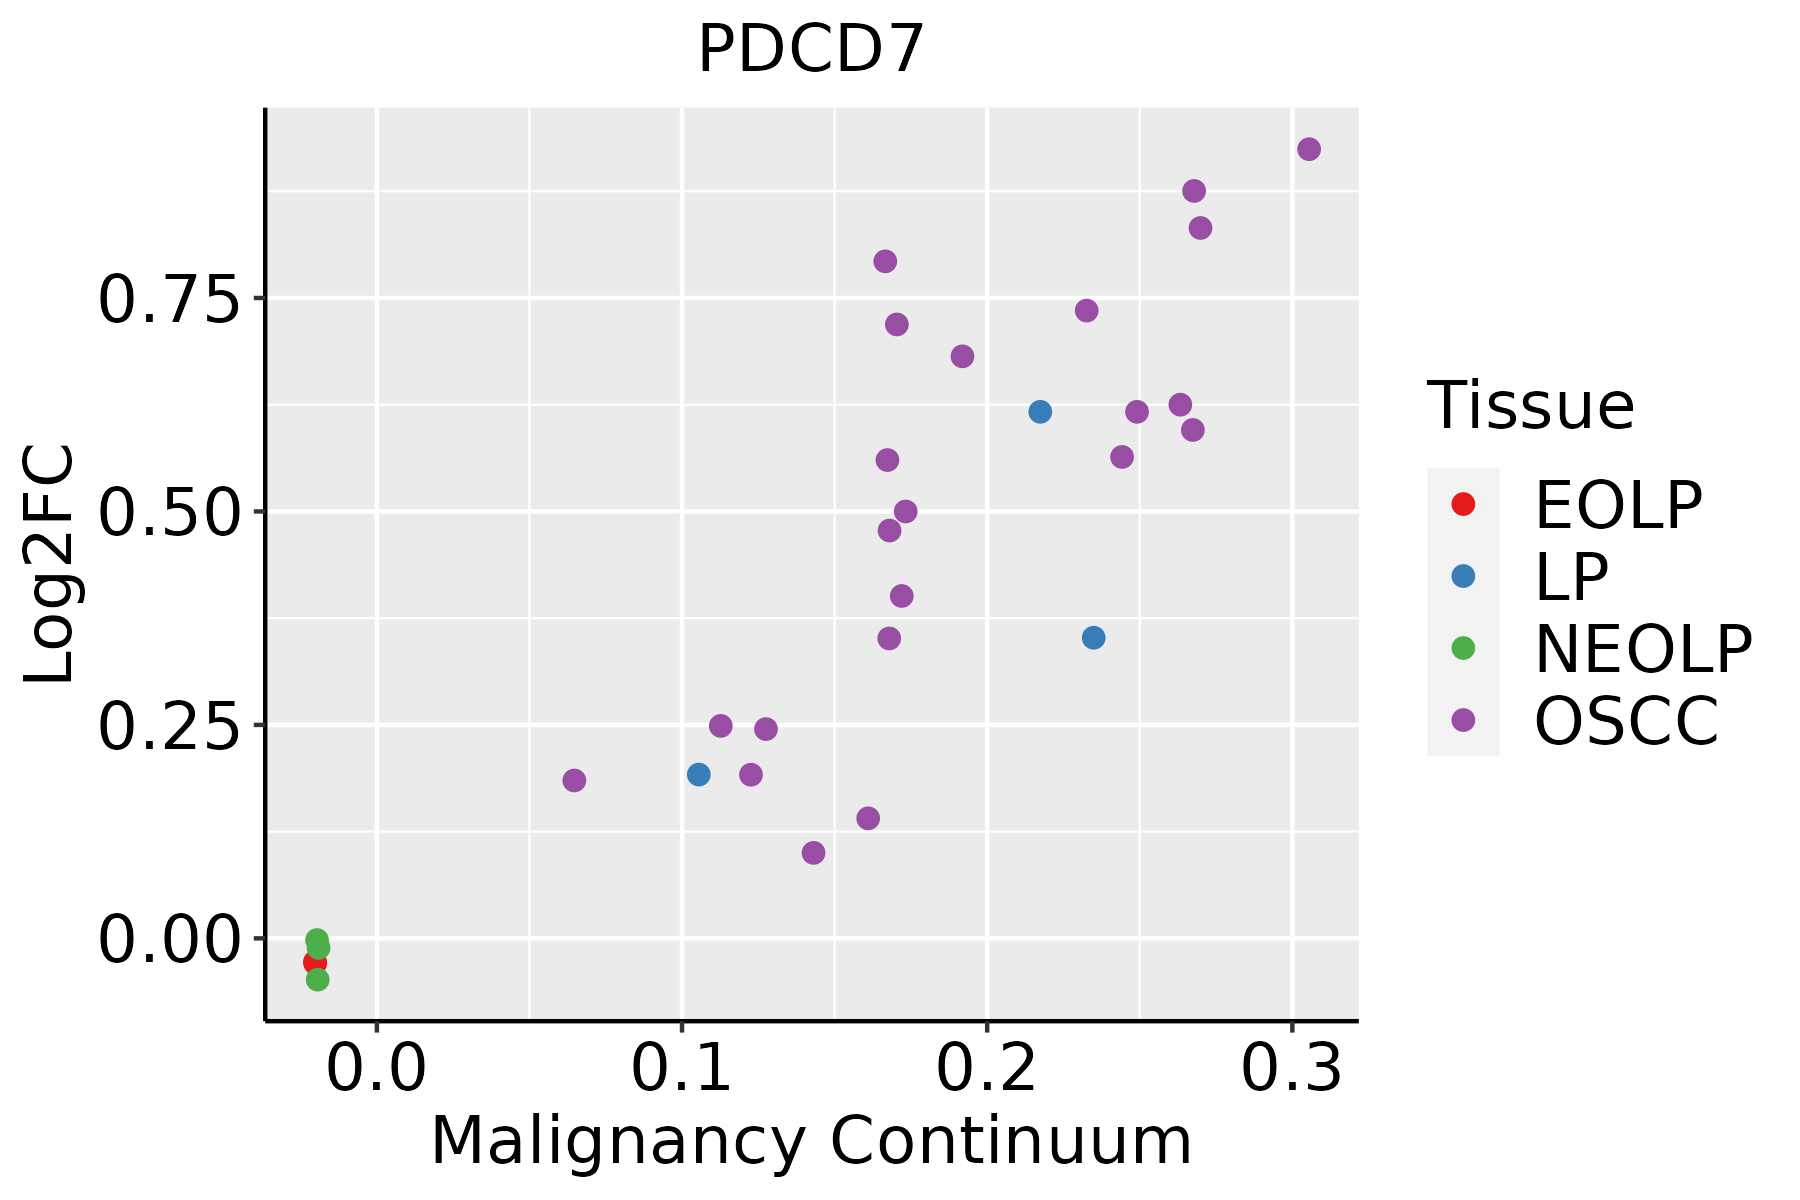 | EOLP: Erosive Oral lichen planus |
| LP: leukoplakia | ||
| NEOLP: Non-erosive oral lichen planus | ||
| OSCC: Oral squamous cell carcinoma | ||
| Skin | 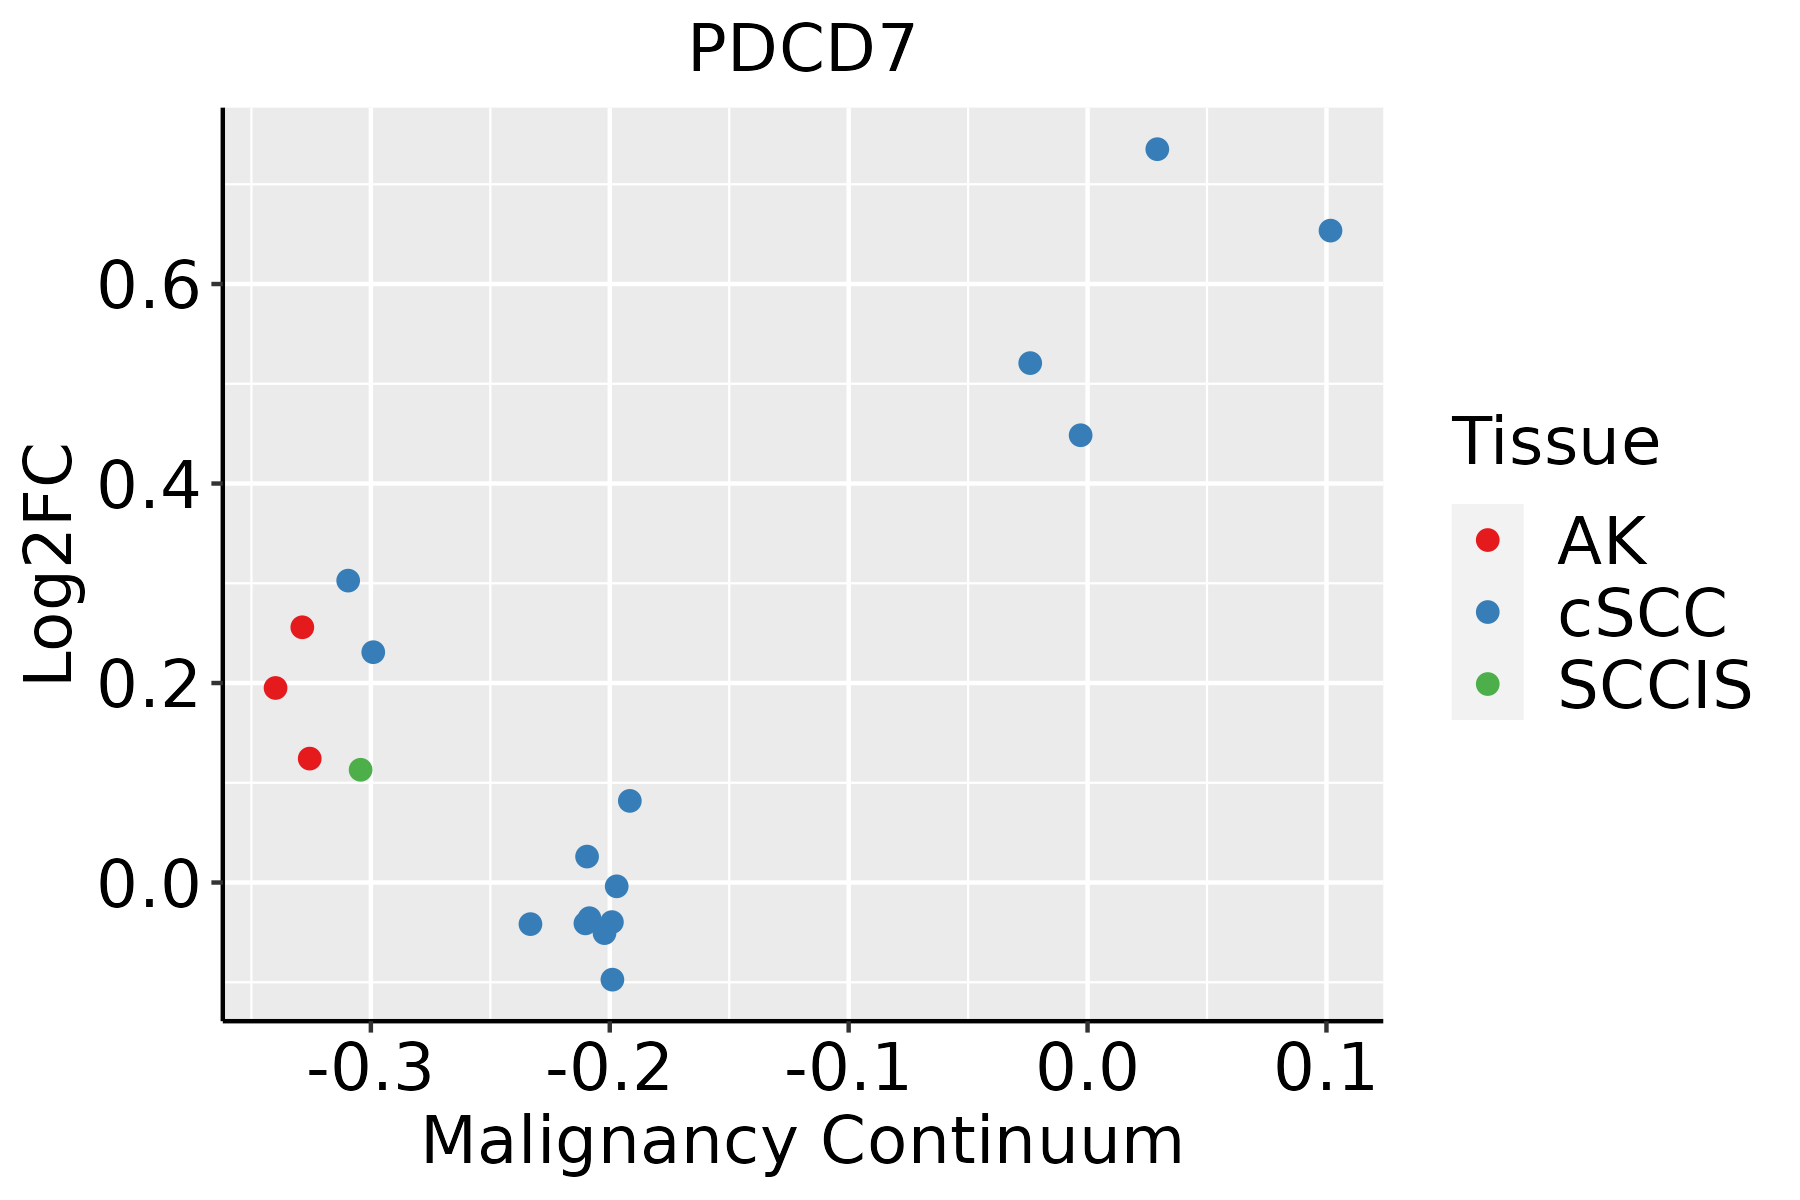 | AK: Actinic keratosis |
| cSCC: Cutaneous squamous cell carcinoma | ||
| SCCIS:squamous cell carcinoma in situ | ||
| Thyroid | 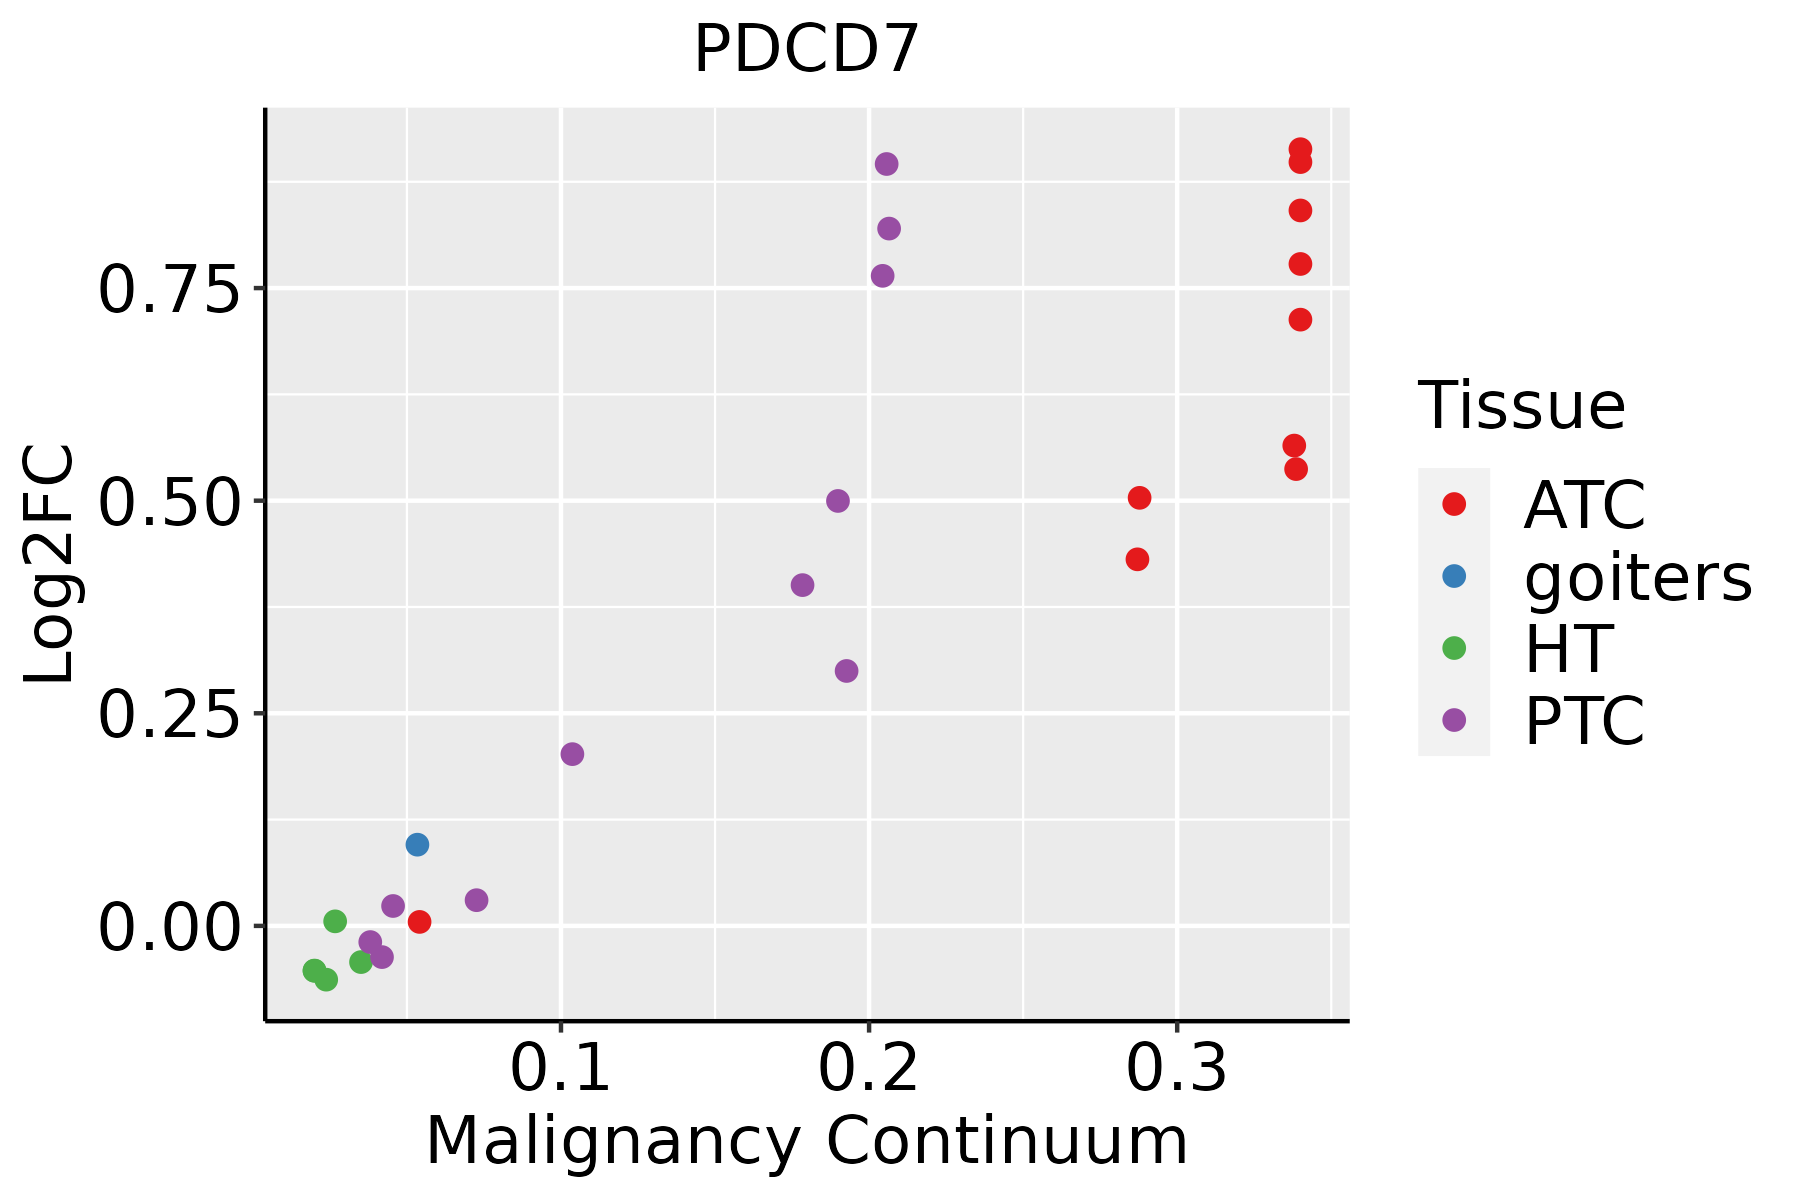 | ATC: Anaplastic thyroid cancer |
| HT: Hashimoto's thyroiditis | ||
| PTC: Papillary thyroid cancer |
| ∗log2FC in expression of this searched gene in stem-like cells from each diseased tissue sample relative to stem-like cells in normal samples in each tissue plotted against the malignancy continuum. Samples are colored based on if they are from different disease stage. |
Top |
Malignant transformation related pathway analysis |
| Find out the enriched GO biological processes and KEGG pathways involved in transition from healthy to precancer to cancer |
| Tissue | Disease Stage | Enriched GO biological Processes |
| Colorectum | AD |  |
| Colorectum | SER |  |
| Colorectum | MSS |  |
| Colorectum | MSI-H |  |
| Colorectum | FAP |  |
| ∗Top 15 enriched GO BP terms are showed in the bar plot of each disease state in each tissue. Each row represents a significant GO biological process which is colored according to the -log10(p.adjust). |
| Page: 1 2 3 4 5 6 7 8 9 |
| GO ID | Tissue | Disease Stage | Description | Gene Ratio | Bg Ratio | pvalue | p.adjust | Count |
| GO:0008380111 | Esophagus | ESCC | RNA splicing | 336/8552 | 434/18723 | 1.74e-42 | 3.67e-39 | 336 |
| GO:0048545111 | Esophagus | ESCC | response to steroid hormone | 204/8552 | 339/18723 | 4.47e-08 | 8.11e-07 | 204 |
| GO:003196020 | Esophagus | ESCC | response to corticosteroid | 95/8552 | 167/18723 | 2.27e-03 | 9.99e-03 | 95 |
| GO:005138420 | Esophagus | ESCC | response to glucocorticoid | 85/8552 | 148/18723 | 2.60e-03 | 1.11e-02 | 85 |
| GO:000838012 | Liver | Cirrhotic | RNA splicing | 229/4634 | 434/18723 | 9.13e-37 | 2.86e-33 | 229 |
| GO:004854512 | Liver | Cirrhotic | response to steroid hormone | 146/4634 | 339/18723 | 7.87e-14 | 6.76e-12 | 146 |
| GO:005138411 | Liver | Cirrhotic | response to glucocorticoid | 65/4634 | 148/18723 | 2.53e-07 | 6.41e-06 | 65 |
| GO:003196011 | Liver | Cirrhotic | response to corticosteroid | 70/4634 | 167/18723 | 7.73e-07 | 1.62e-05 | 70 |
| GO:000838022 | Liver | HCC | RNA splicing | 313/7958 | 434/18723 | 1.36e-36 | 1.73e-33 | 313 |
| GO:004854522 | Liver | HCC | response to steroid hormone | 206/7958 | 339/18723 | 6.81e-12 | 2.92e-10 | 206 |
| GO:005138421 | Liver | HCC | response to glucocorticoid | 90/7958 | 148/18723 | 5.18e-06 | 6.47e-05 | 90 |
| GO:003196021 | Liver | HCC | response to corticosteroid | 98/7958 | 167/18723 | 1.73e-05 | 1.87e-04 | 98 |
| GO:000838020 | Oral cavity | OSCC | RNA splicing | 308/7305 | 434/18723 | 2.43e-42 | 7.70e-39 | 308 |
| GO:004854520 | Oral cavity | OSCC | response to steroid hormone | 186/7305 | 339/18723 | 1.86e-09 | 4.42e-08 | 186 |
| GO:003196018 | Oral cavity | OSCC | response to corticosteroid | 86/7305 | 167/18723 | 6.79e-04 | 3.79e-03 | 86 |
| GO:005138418 | Oral cavity | OSCC | response to glucocorticoid | 76/7305 | 148/18723 | 1.49e-03 | 7.15e-03 | 76 |
| GO:000838027 | Skin | AK | RNA splicing | 111/1910 | 434/18723 | 1.85e-20 | 5.49e-17 | 111 |
| GO:004854528 | Skin | AK | response to steroid hormone | 73/1910 | 339/18723 | 4.51e-10 | 5.24e-08 | 73 |
| GO:003196025 | Skin | AK | response to corticosteroid | 37/1910 | 167/18723 | 4.28e-06 | 1.05e-04 | 37 |
| GO:005138425 | Skin | AK | response to glucocorticoid | 33/1910 | 148/18723 | 1.20e-05 | 2.46e-04 | 33 |
| Page: 1 2 |
| Pathway ID | Tissue | Disease Stage | Description | Gene Ratio | Bg Ratio | pvalue | p.adjust | qvalue | Count |
| Page: 1 |
Top |
Cell-cell communication analysis |
| Identification of potential cell-cell interactions between two cell types and their ligand-receptor pairs for different disease states |
| Ligand | Receptor | LRpair | Pathway | Tissue | Disease Stage |
| Page: 1 |
Top |
Single-cell gene regulatory network inference analysis |
| Find out the significant the regulons (TFs) and the target genes of each regulon across cell types for different disease states |
| TF | Cell Type | Tissue | Disease Stage | Target Gene | RSS | Regulon Activity |
| ∗The dot plots of a searched regulon are shown for all cell subpopulations in each disease state of each tissue based on the regulon specific score inferred using pySCENIC and by calculating the average expression. |
| Page: 1 |
Top |
Somatic mutation of malignant transformation related genes |
| Annotation of somatic variants for genes involved in malignant transformation |
| Hugo Symbol | Variant Class | Variant Classification | dbSNP RS | HGVSc | HGVSp | HGVSp Short | SWISSPROT | BIOTYPE | SIFT | PolyPhen | Tumor Sample Barcode | Tissue | Histology | Sex | Age | Stage | Therapy Types | Drugs | Outcome |
| PDCD7 | SNV | Missense_Mutation | c.1021C>T | p.Pro341Ser | p.P341S | Q8N8D1 | protein_coding | tolerated(0.18) | probably_damaging(0.935) | TCGA-AC-A23H-01 | Breast | breast invasive carcinoma | Female | >=65 | I/II | Unknown | Unknown | PD | |
| PDCD7 | SNV | Missense_Mutation | c.953N>A | p.Ile318Asn | p.I318N | Q8N8D1 | protein_coding | deleterious(0) | possibly_damaging(0.598) | TCGA-D8-A1XK-01 | Breast | breast invasive carcinoma | Female | <65 | I/II | Chemotherapy | doxorubicine+cyclophosphamide | SD | |
| PDCD7 | insertion | Frame_Shift_Ins | novel | c.894_895insTTCATATTATTATTCTTTTTATTATCAA | p.Asp299PhefsTer15 | p.D299Ffs*15 | Q8N8D1 | protein_coding | TCGA-AO-A0JB-01 | Breast | breast invasive carcinoma | Female | <65 | III/IV | Chemotherapy | cyclophosphamide | SD | ||
| PDCD7 | SNV | Missense_Mutation | rs779528128 | c.1366N>A | p.Asp456Asn | p.D456N | Q8N8D1 | protein_coding | deleterious(0.02) | benign(0.071) | TCGA-DG-A2KH-01 | Cervix | cervical & endocervical cancer | Female | <65 | I/II | Unknown | Unknown | SD |
| PDCD7 | SNV | Missense_Mutation | novel | c.1199N>C | p.Ile400Thr | p.I400T | Q8N8D1 | protein_coding | tolerated(0.18) | benign(0.028) | TCGA-DS-A1OA-01 | Cervix | cervical & endocervical cancer | Female | >=65 | I/II | Chemotherapy | carboplatin | PD |
| PDCD7 | SNV | Missense_Mutation | novel | c.1339N>A | p.Asp447Asn | p.D447N | Q8N8D1 | protein_coding | deleterious(0.03) | possibly_damaging(0.691) | TCGA-VS-A9UC-01 | Cervix | cervical & endocervical cancer | Female | <65 | I/II | Chemotherapy | cisplatin | SD |
| PDCD7 | SNV | Missense_Mutation | novel | c.769G>A | p.Glu257Lys | p.E257K | Q8N8D1 | protein_coding | tolerated(0.72) | benign(0.018) | TCGA-VS-A9V5-01 | Cervix | cervical & endocervical cancer | Female | <65 | I/II | Chemotherapy | carboplatin | PD |
| PDCD7 | insertion | Frame_Shift_Ins | novel | c.1200_1201insGAGCCTATGA | p.Leu401GlufsTer9 | p.L401Efs*9 | Q8N8D1 | protein_coding | TCGA-DS-A1OA-01 | Cervix | cervical & endocervical cancer | Female | >=65 | I/II | Chemotherapy | carboplatin | PD | ||
| PDCD7 | SNV | Missense_Mutation | rs774717943 | c.1213N>T | p.Arg405Cys | p.R405C | Q8N8D1 | protein_coding | deleterious(0) | possibly_damaging(0.502) | TCGA-AA-3966-01 | Colorectum | colon adenocarcinoma | Female | >=65 | I/II | Unknown | Unknown | SD |
| PDCD7 | SNV | Missense_Mutation | c.1426N>A | p.Asp476Asn | p.D476N | Q8N8D1 | protein_coding | deleterious(0.01) | probably_damaging(0.998) | TCGA-AZ-4682-01 | Colorectum | colon adenocarcinoma | Male | <65 | I/II | Chemotherapy | camptosar | PD |
| Page: 1 2 3 4 5 |
Top |
Related drugs of malignant transformation related genes |
| Identification of chemicals and drugs interact with genes involved in malignant transfromation |
| (DGIdb 4.0) |
| Entrez ID | Symbol | Category | Interaction Types | Drug Claim Name | Drug Name | PMIDs |
| Page: 1 |

Copyright 2023-Present -The University of Texas Health Science Center at Houston |