
|
|||||
|
 | |
| |
| |
| |
| |
| |
|
Gene: PCGF5 |
Gene summary for PCGF5 |
| Gene information | Species | Human | Gene symbol | PCGF5 | Gene ID | 84333 |
| Gene name | polycomb group ring finger 5 | |
| Gene Alias | RNF159 | |
| Cytomap | 10q23.32 | |
| Gene Type | protein-coding | GO ID | GO:0006139 | UniProtAcc | Q86SE9 |
Top |
Malignant transformation analysis |
| Identification of the aberrant gene expression in precancerous and cancerous lesions by comparing the gene expression of stem-like cells in diseased tissues with normal stem cells |
| Entrez ID | Symbol | Replicates | Species | Organ | Tissue | Adj P-value | Log2FC | Malignancy |
| 84333 | PCGF5 | P16T-E | Human | Esophagus | ESCC | 1.59e-16 | 2.70e-01 | 0.1153 |
| 84333 | PCGF5 | P19T-E | Human | Esophagus | ESCC | 1.39e-05 | 4.24e-01 | 0.1662 |
| 84333 | PCGF5 | P20T-E | Human | Esophagus | ESCC | 2.24e-13 | 5.53e-01 | 0.1124 |
| 84333 | PCGF5 | P21T-E | Human | Esophagus | ESCC | 1.96e-15 | 3.81e-01 | 0.1617 |
| 84333 | PCGF5 | P22T-E | Human | Esophagus | ESCC | 9.11e-24 | 2.82e-01 | 0.1236 |
| 84333 | PCGF5 | P23T-E | Human | Esophagus | ESCC | 1.56e-35 | 8.42e-01 | 0.108 |
| 84333 | PCGF5 | P24T-E | Human | Esophagus | ESCC | 6.35e-15 | 3.39e-01 | 0.1287 |
| 84333 | PCGF5 | P26T-E | Human | Esophagus | ESCC | 2.84e-44 | 7.48e-01 | 0.1276 |
| 84333 | PCGF5 | P27T-E | Human | Esophagus | ESCC | 3.58e-18 | 3.77e-01 | 0.1055 |
| 84333 | PCGF5 | P28T-E | Human | Esophagus | ESCC | 1.11e-35 | 5.92e-01 | 0.1149 |
| 84333 | PCGF5 | P30T-E | Human | Esophagus | ESCC | 1.58e-17 | 5.56e-01 | 0.137 |
| 84333 | PCGF5 | P31T-E | Human | Esophagus | ESCC | 4.24e-12 | 7.19e-02 | 0.1251 |
| 84333 | PCGF5 | P32T-E | Human | Esophagus | ESCC | 1.86e-14 | 1.69e-01 | 0.1666 |
| 84333 | PCGF5 | P36T-E | Human | Esophagus | ESCC | 1.42e-15 | 3.90e-01 | 0.1187 |
| 84333 | PCGF5 | P37T-E | Human | Esophagus | ESCC | 7.36e-16 | 2.51e-01 | 0.1371 |
| 84333 | PCGF5 | P38T-E | Human | Esophagus | ESCC | 8.64e-08 | 1.86e-01 | 0.127 |
| 84333 | PCGF5 | P39T-E | Human | Esophagus | ESCC | 8.25e-11 | 2.03e-01 | 0.0894 |
| 84333 | PCGF5 | P40T-E | Human | Esophagus | ESCC | 3.10e-11 | 2.33e-01 | 0.109 |
| 84333 | PCGF5 | P42T-E | Human | Esophagus | ESCC | 5.87e-07 | 5.93e-02 | 0.1175 |
| 84333 | PCGF5 | P44T-E | Human | Esophagus | ESCC | 4.50e-08 | 1.67e-01 | 0.1096 |
| Page: 1 2 3 4 5 6 7 |
| Tissue | Expression Dynamics | Abbreviation |
| Colorectum (GSE201348) |  | FAP: Familial adenomatous polyposis |
| CRC: Colorectal cancer | ||
| Colorectum (HTA11) |  | AD: Adenomas |
| SER: Sessile serrated lesions | ||
| MSI-H: Microsatellite-high colorectal cancer | ||
| MSS: Microsatellite stable colorectal cancer | ||
| Esophagus | 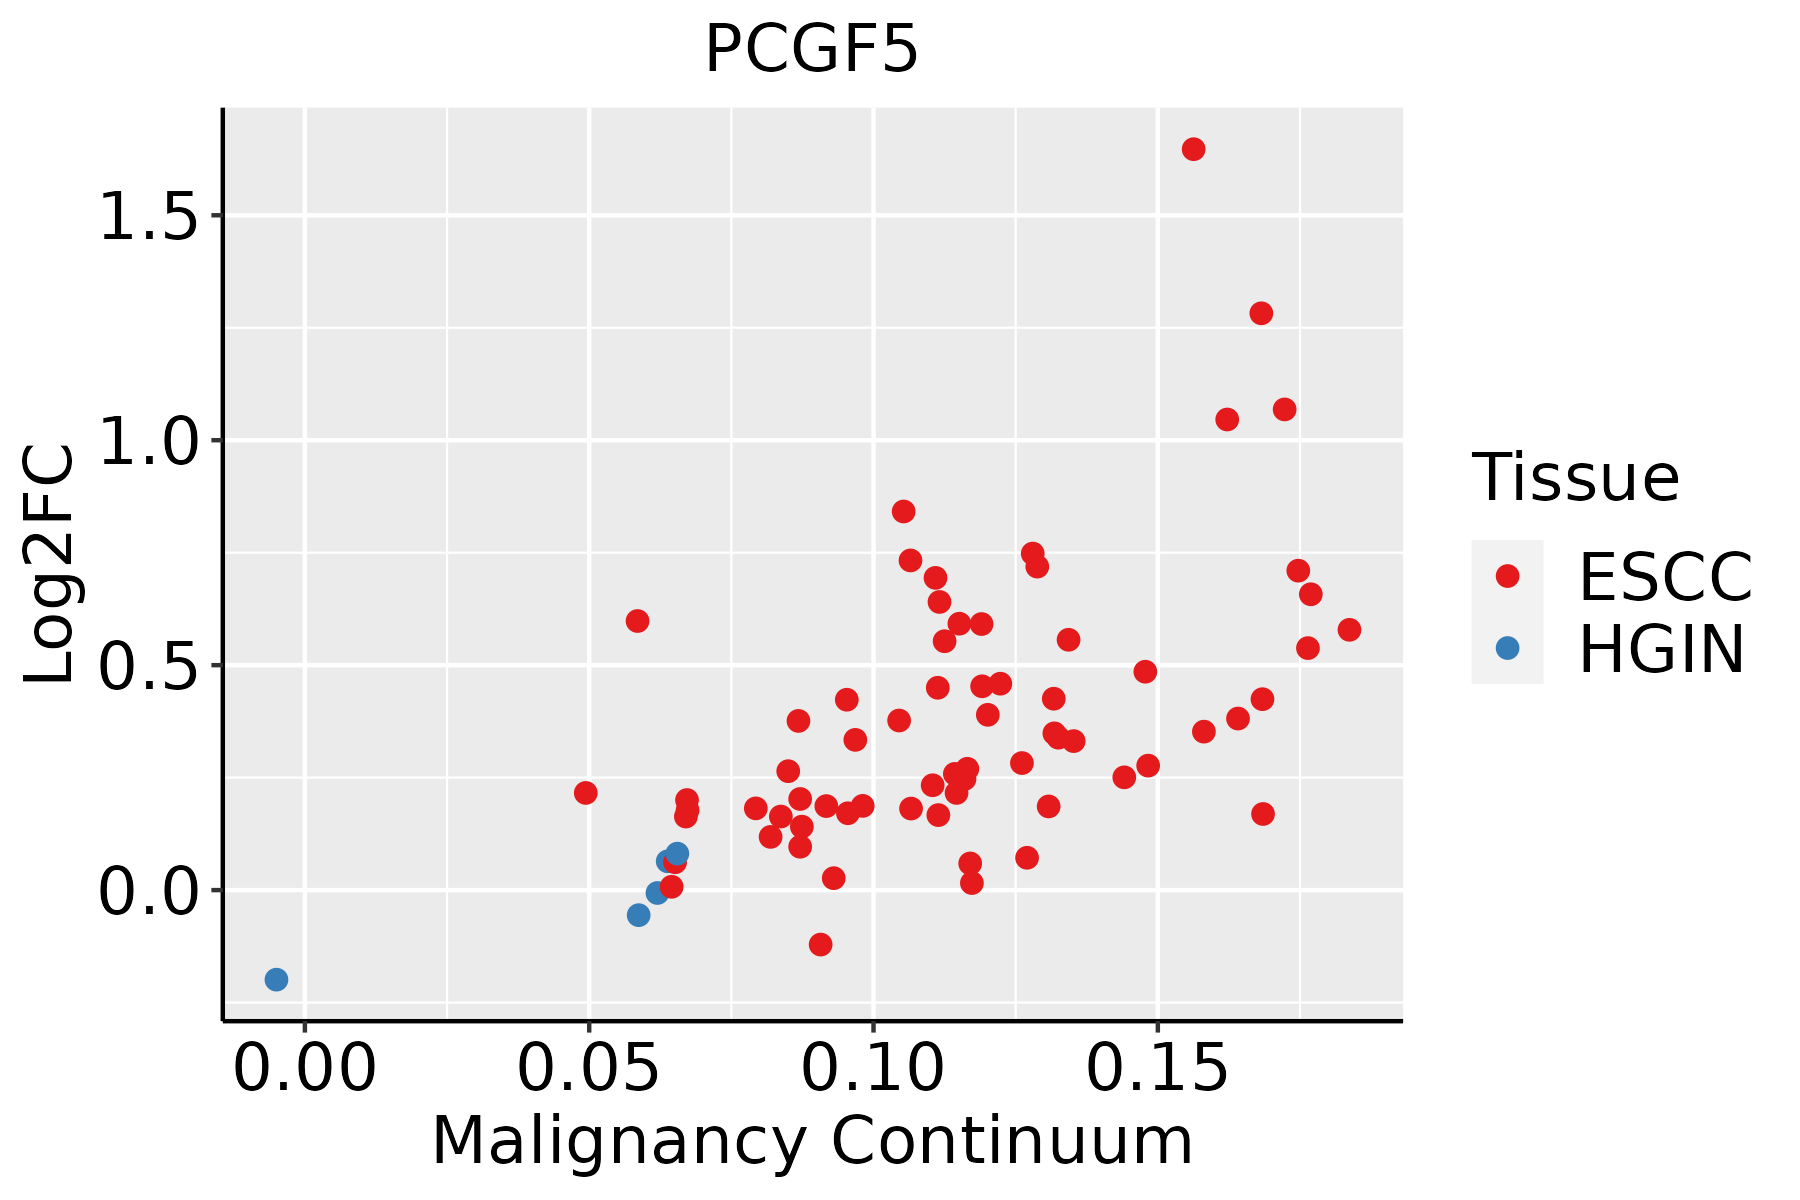 | ESCC: Esophageal squamous cell carcinoma |
| HGIN: High-grade intraepithelial neoplasias | ||
| LGIN: Low-grade intraepithelial neoplasias | ||
| Liver | 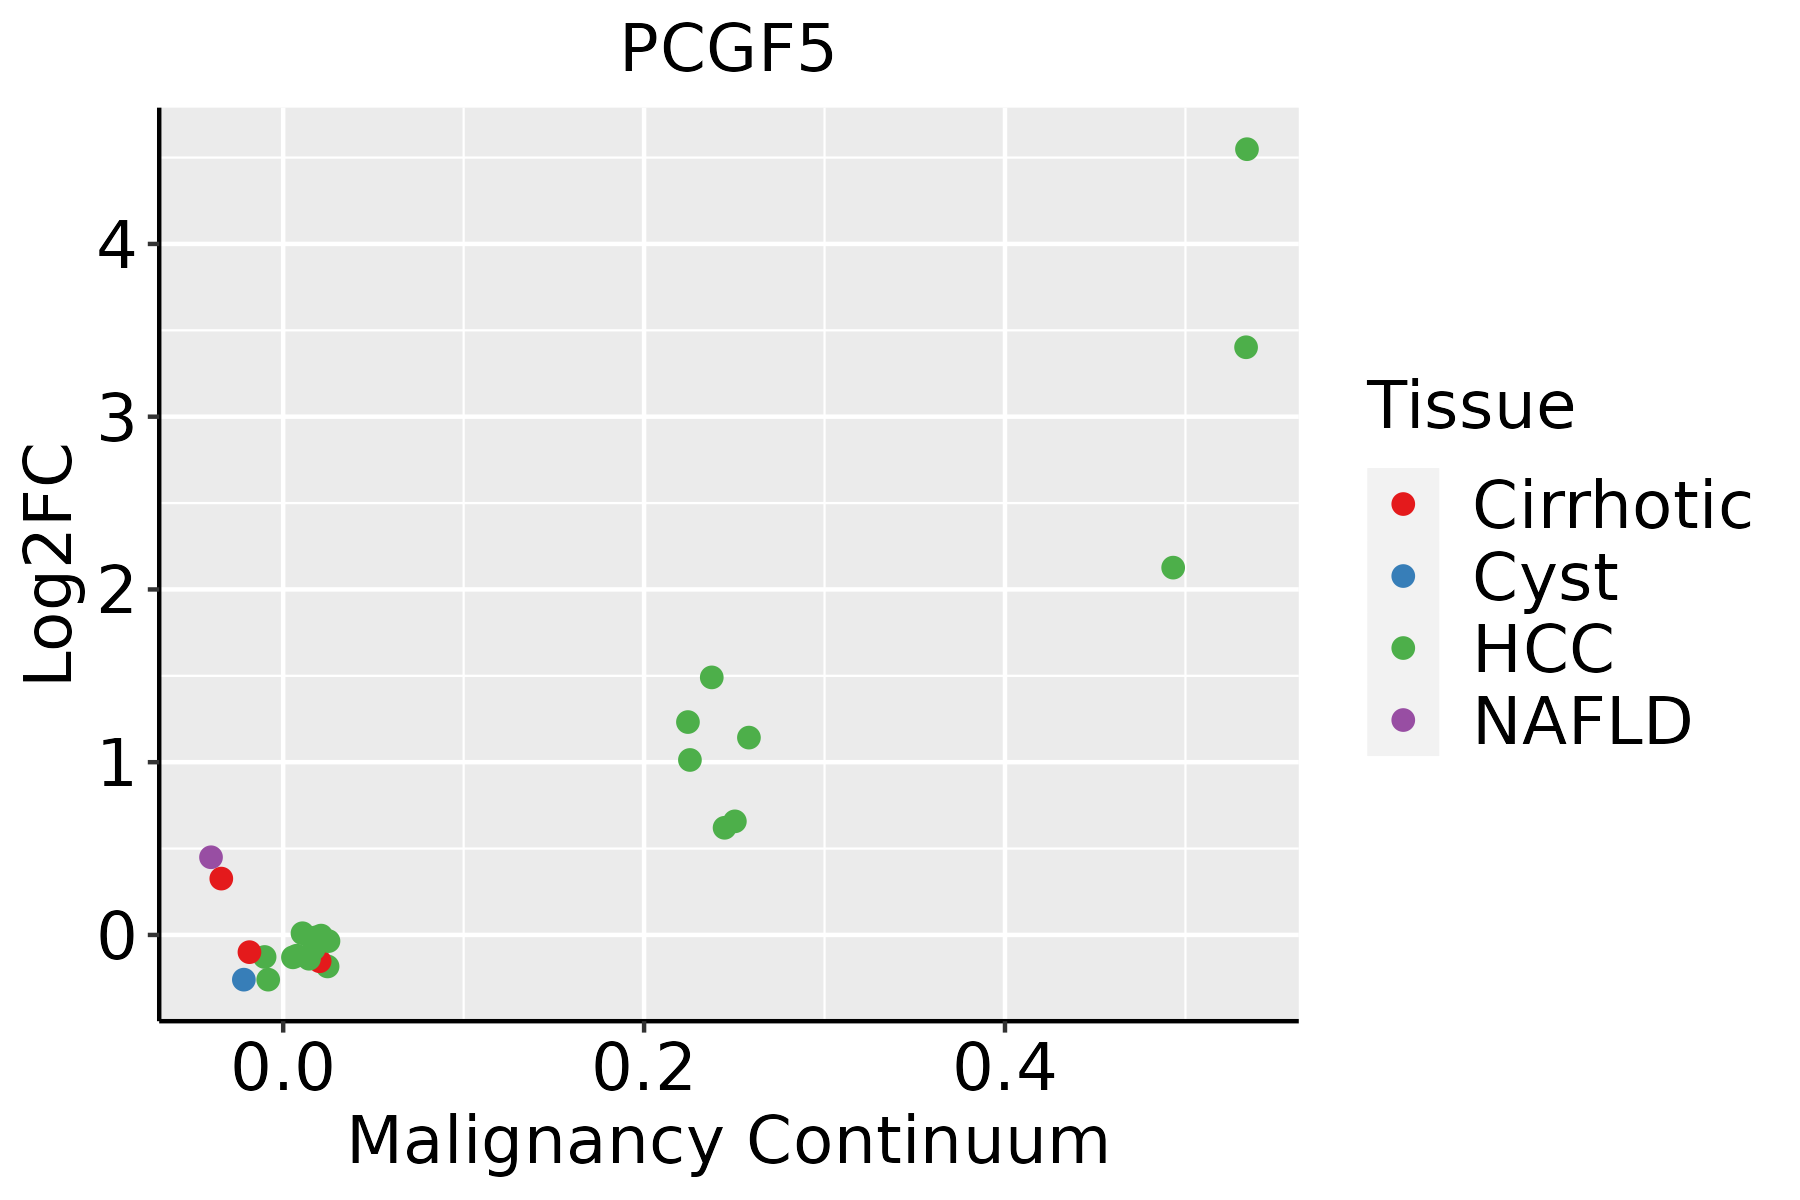 | HCC: Hepatocellular carcinoma |
| NAFLD: Non-alcoholic fatty liver disease | ||
| Oral Cavity | 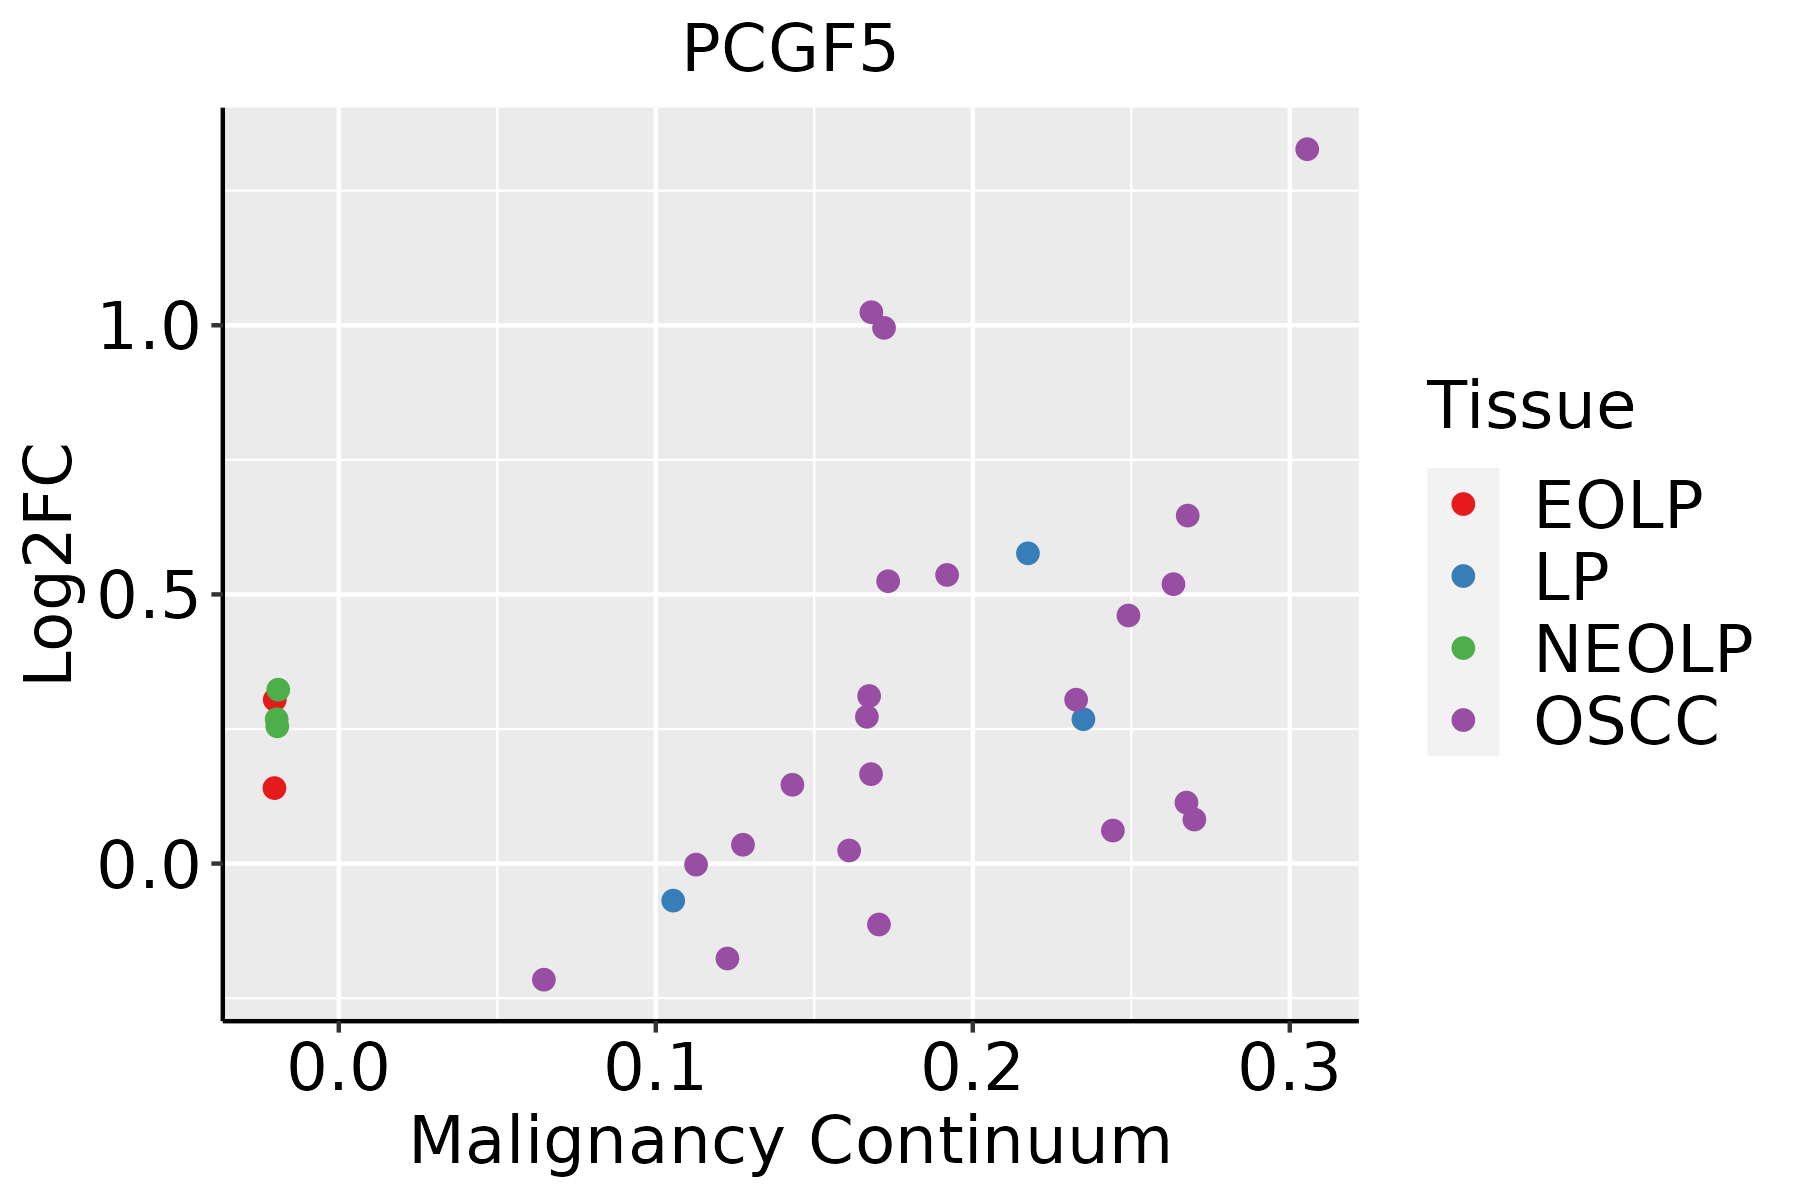 | EOLP: Erosive Oral lichen planus |
| LP: leukoplakia | ||
| NEOLP: Non-erosive oral lichen planus | ||
| OSCC: Oral squamous cell carcinoma | ||
| Prostate |  | BPH: Benign Prostatic Hyperplasia |
| ∗log2FC in expression of this searched gene in stem-like cells from each diseased tissue sample relative to stem-like cells in normal samples in each tissue plotted against the malignancy continuum. Samples are colored based on if they are from different disease stage. |
Top |
Malignant transformation related pathway analysis |
| Find out the enriched GO biological processes and KEGG pathways involved in transition from healthy to precancer to cancer |
| Tissue | Disease Stage | Enriched GO biological Processes |
| Colorectum | AD |  |
| Colorectum | SER |  |
| Colorectum | MSS |  |
| Colorectum | MSI-H |  |
| Colorectum | FAP |  |
| ∗Top 15 enriched GO BP terms are showed in the bar plot of each disease state in each tissue. Each row represents a significant GO biological process which is colored according to the -log10(p.adjust). |
| Page: 1 2 3 4 5 6 7 8 9 |
| GO ID | Tissue | Disease Stage | Description | Gene Ratio | Bg Ratio | pvalue | p.adjust | Count |
| GO:0033522 | Colorectum | AD | histone H2A ubiquitination | 12/3918 | 26/18723 | 3.47e-03 | 2.51e-02 | 12 |
| GO:0006513 | Colorectum | AD | protein monoubiquitination | 23/3918 | 67/18723 | 7.55e-03 | 4.58e-02 | 23 |
| GO:0016570 | Colorectum | MSS | histone modification | 113/3467 | 463/18723 | 8.37e-04 | 8.68e-03 | 113 |
| GO:00335221 | Colorectum | MSS | histone H2A ubiquitination | 12/3467 | 26/18723 | 1.16e-03 | 1.12e-02 | 12 |
| GO:00065131 | Colorectum | MSS | protein monoubiquitination | 21/3467 | 67/18723 | 7.90e-03 | 4.84e-02 | 21 |
| GO:0016574 | Colorectum | MSS | histone ubiquitination | 16/3467 | 47/18723 | 8.22e-03 | 4.99e-02 | 16 |
| GO:00165701 | Colorectum | FAP | histone modification | 94/2622 | 463/18723 | 1.06e-04 | 1.76e-03 | 94 |
| GO:00335222 | Colorectum | FAP | histone H2A ubiquitination | 10/2622 | 26/18723 | 1.77e-03 | 1.53e-02 | 10 |
| GO:00165741 | Colorectum | FAP | histone ubiquitination | 14/2622 | 47/18723 | 3.95e-03 | 2.75e-02 | 14 |
| GO:00065132 | Colorectum | FAP | protein monoubiquitination | 18/2622 | 67/18723 | 4.08e-03 | 2.81e-02 | 18 |
| GO:00165702 | Colorectum | CRC | histone modification | 75/2078 | 463/18723 | 4.95e-04 | 7.06e-03 | 75 |
| GO:001657015 | Esophagus | ESCC | histone modification | 323/8552 | 463/18723 | 2.61e-26 | 7.88e-24 | 323 |
| GO:00065136 | Esophagus | ESCC | protein monoubiquitination | 53/8552 | 67/18723 | 2.11e-08 | 4.03e-07 | 53 |
| GO:001657414 | Esophagus | ESCC | histone ubiquitination | 40/8552 | 47/18723 | 2.40e-08 | 4.55e-07 | 40 |
| GO:00400295 | Esophagus | ESCC | regulation of gene expression, epigenetic | 74/8552 | 105/18723 | 2.24e-07 | 3.42e-06 | 74 |
| GO:003352213 | Esophagus | ESCC | histone H2A ubiquitination | 23/8552 | 26/18723 | 6.82e-06 | 6.90e-05 | 23 |
| GO:00103904 | Esophagus | ESCC | histone monoubiquitination | 25/8552 | 29/18723 | 7.24e-06 | 7.20e-05 | 25 |
| GO:00355182 | Esophagus | ESCC | histone H2A monoubiquitination | 15/8552 | 17/18723 | 3.48e-04 | 2.03e-03 | 15 |
| GO:00090484 | Esophagus | ESCC | dosage compensation by inactivation of X chromosome | 14/8552 | 16/18723 | 6.78e-04 | 3.56e-03 | 14 |
| GO:00075494 | Esophagus | ESCC | dosage compensation | 14/8552 | 18/18723 | 5.77e-03 | 2.14e-02 | 14 |
| Page: 1 2 3 4 |
| Pathway ID | Tissue | Disease Stage | Description | Gene Ratio | Bg Ratio | pvalue | p.adjust | qvalue | Count |
| Page: 1 |
Top |
Cell-cell communication analysis |
| Identification of potential cell-cell interactions between two cell types and their ligand-receptor pairs for different disease states |
| Ligand | Receptor | LRpair | Pathway | Tissue | Disease Stage |
| Page: 1 |
Top |
Single-cell gene regulatory network inference analysis |
| Find out the significant the regulons (TFs) and the target genes of each regulon across cell types for different disease states |
| TF | Cell Type | Tissue | Disease Stage | Target Gene | RSS | Regulon Activity |
| ∗The dot plots of a searched regulon are shown for all cell subpopulations in each disease state of each tissue based on the regulon specific score inferred using pySCENIC and by calculating the average expression. |
| Page: 1 |
Top |
Somatic mutation of malignant transformation related genes |
| Annotation of somatic variants for genes involved in malignant transformation |
| Hugo Symbol | Variant Class | Variant Classification | dbSNP RS | HGVSc | HGVSp | HGVSp Short | SWISSPROT | BIOTYPE | SIFT | PolyPhen | Tumor Sample Barcode | Tissue | Histology | Sex | Age | Stage | Therapy Types | Drugs | Outcome |
| PCGF5 | SNV | Missense_Mutation | c.379G>A | p.Glu127Lys | p.E127K | Q86SE9 | protein_coding | tolerated(0.19) | benign(0) | TCGA-AC-A23H-01 | Breast | breast invasive carcinoma | Female | >=65 | I/II | Unknown | Unknown | PD | |
| PCGF5 | SNV | Missense_Mutation | c.509G>A | p.Arg170His | p.R170H | Q86SE9 | protein_coding | tolerated(0.11) | possibly_damaging(0.765) | TCGA-E2-A15R-01 | Breast | breast invasive carcinoma | Female | <65 | I/II | Chemotherapy | cyclophosphamide | SD | |
| PCGF5 | SNV | Missense_Mutation | novel | c.206T>C | p.Leu69Ser | p.L69S | Q86SE9 | protein_coding | deleterious(0) | benign(0.048) | TCGA-2W-A8YY-01 | Cervix | cervical & endocervical cancer | Female | <65 | I/II | Chemotherapy | cisplatin | CR |
| PCGF5 | SNV | Missense_Mutation | c.531N>C | p.Lys177Asn | p.K177N | Q86SE9 | protein_coding | deleterious(0) | probably_damaging(0.997) | TCGA-FU-A3HZ-01 | Cervix | cervical & endocervical cancer | Female | <65 | I/II | Chemotherapy | cisplatin | CR | |
| PCGF5 | SNV | Missense_Mutation | c.457N>A | p.Gly153Arg | p.G153R | Q86SE9 | protein_coding | deleterious(0.04) | probably_damaging(0.946) | TCGA-JW-A5VG-01 | Cervix | cervical & endocervical cancer | Female | <65 | I/II | Chemotherapy | cisplatin | SD | |
| PCGF5 | SNV | Missense_Mutation | c.437T>C | p.Leu146Ser | p.L146S | Q86SE9 | protein_coding | tolerated(0.09) | benign(0.02) | TCGA-AA-3672-01 | Colorectum | colon adenocarcinoma | Female | >=65 | III/IV | Unknown | Unknown | SD | |
| PCGF5 | SNV | Missense_Mutation | rs755316155 | c.668N>A | p.Arg223Gln | p.R223Q | Q86SE9 | protein_coding | tolerated(0.33) | benign(0) | TCGA-CA-6717-01 | Colorectum | colon adenocarcinoma | Male | <65 | I/II | Chemotherapy | oxaliplatin | CR |
| PCGF5 | SNV | Missense_Mutation | c.395N>G | p.Tyr132Cys | p.Y132C | Q86SE9 | protein_coding | tolerated(0.06) | probably_damaging(0.987) | TCGA-D5-6928-01 | Colorectum | colon adenocarcinoma | Male | >=65 | I/II | Unknown | Unknown | SD | |
| PCGF5 | SNV | Missense_Mutation | rs755316155 | c.668N>A | p.Arg223Gln | p.R223Q | Q86SE9 | protein_coding | tolerated(0.33) | benign(0) | TCGA-NH-A5IV-01 | Colorectum | colon adenocarcinoma | Female | >=65 | I/II | Unknown | Unknown | SD |
| PCGF5 | SNV | Missense_Mutation | c.8N>T | p.Thr3Ile | p.T3I | Q86SE9 | protein_coding | deleterious(0.02) | benign(0.069) | TCGA-A5-A0GB-01 | Endometrium | uterine corpus endometrioid carcinoma | Female | >=65 | I/II | Unknown | Unknown | SD |
| Page: 1 2 3 |
Top |
Related drugs of malignant transformation related genes |
| Identification of chemicals and drugs interact with genes involved in malignant transfromation |
| (DGIdb 4.0) |
| Entrez ID | Symbol | Category | Interaction Types | Drug Claim Name | Drug Name | PMIDs |
| Page: 1 |

Copyright 2023-Present -The University of Texas Health Science Center at Houston |