Schematic overview of the cellular and molecular mechanisms involved in the cancer progression, including the proposed cellular and molecular mechanisms in cancer cells trajectory. AT1: alveolar type 1 cells; AT2: alveolar type 2 cells; AAH: atypical adenomatous hyperplasia; AIS: adenocarcinoma in situ; MIA: minimally invasive adenocarcinoma; IA: invasive adenocarcinoma; EMT: epithelial-mesenchymal transition

Home

Download

Statistics

Help

Contact

Center for Computational Systems Medicine
leaf

Gene summary

leaf

Malignant transformation analysis

leaf

Malignant transformation related pathway analysis

leaf

Cell-cell communication analysis

leaf

Single-cell gene regulatory network inference analysis

leaf

Somatic mutation of malignant transformation related genes

leaf

Related drugs of malignant transformation related genes

Gene: PARPBP

Gene summary for PARPBP

check button Gene summary.

Gene informationSpeciesHuman
Gene symbol

PARPBP

Gene ID

55010

Gene namePARP1 binding protein
Gene AliasAROM
Cytomap12q23.2
Gene Typeprotein-coding
GO ID

GO:0000018

UniProtAcc

B4DZ31


Top

Malignant transformation analysis

check button Identification of the aberrant gene expression in precancerous and cancerous lesions by comparing the gene expression of stem-like cells in diseased tissues with normal stem cells
check button Malignant transformation involving gene list.
Entrez IDSymbolReplicatesSpeciesOrganTissueAdj P-valueLog2FCMalignancy
55010PARPBPHCC1_MengHumanLiverHCC4.58e-114.44e-020.0246
55010PARPBPHCC1HumanLiverHCC8.27e-053.12e+000.5336
55010PARPBPHCC2HumanLiverHCC2.78e-041.18e+000.5341
55010PARPBPS014HumanLiverHCC1.68e-103.22e-010.2254
55010PARPBPS015HumanLiverHCC6.11e-042.13e-010.2375
55010PARPBPS016HumanLiverHCC3.39e-082.64e-010.2243
55010PARPBPS028HumanLiverHCC1.47e-063.79e-010.2503
55010PARPBPS029HumanLiverHCC6.39e-072.84e-010.2581
55010PARPBPC04HumanOral cavityOSCC1.87e-042.99e-010.2633
55010PARPBPC21HumanOral cavityOSCC4.28e-083.37e-010.2678
55010PARPBPC30HumanOral cavityOSCC7.35e-085.05e-010.3055
55010PARPBPC38HumanOral cavityOSCC1.16e-075.57e-010.172
55010PARPBPC43HumanOral cavityOSCC8.66e-112.17e-010.1704
55010PARPBPC46HumanOral cavityOSCC8.53e-082.04e-010.1673
55010PARPBPC51HumanOral cavityOSCC3.99e-032.45e-010.2674
55010PARPBPC08HumanOral cavityOSCC9.07e-061.56e-010.1919
55010PARPBPLN46HumanOral cavityOSCC3.49e-072.97e-010.1666
55010PARPBPSYSMH2HumanOral cavityOSCC9.07e-062.37e-010.2326
55010PARPBPSYSMH3HumanOral cavityOSCC8.75e-051.61e-010.2442
55010PARPBPP4_cSCCHumanSkincSCC2.54e-062.58e-01-0.00290000000000005
Page: 1 2 3 4 

check button Transcriptomic changes along malignancy continuum.
TissueExpression DynamicsAbbreviation
EsophagusThe image shows the transcriptomic changes along malignancy continuum.log2FC in expression of this searched gene in stem-like cells from each diseased tissue sample relative to stem-like cells in normal samples in each tissue plotted against the malignancy continuum. Samples are colored based on if they are from different disease stage.
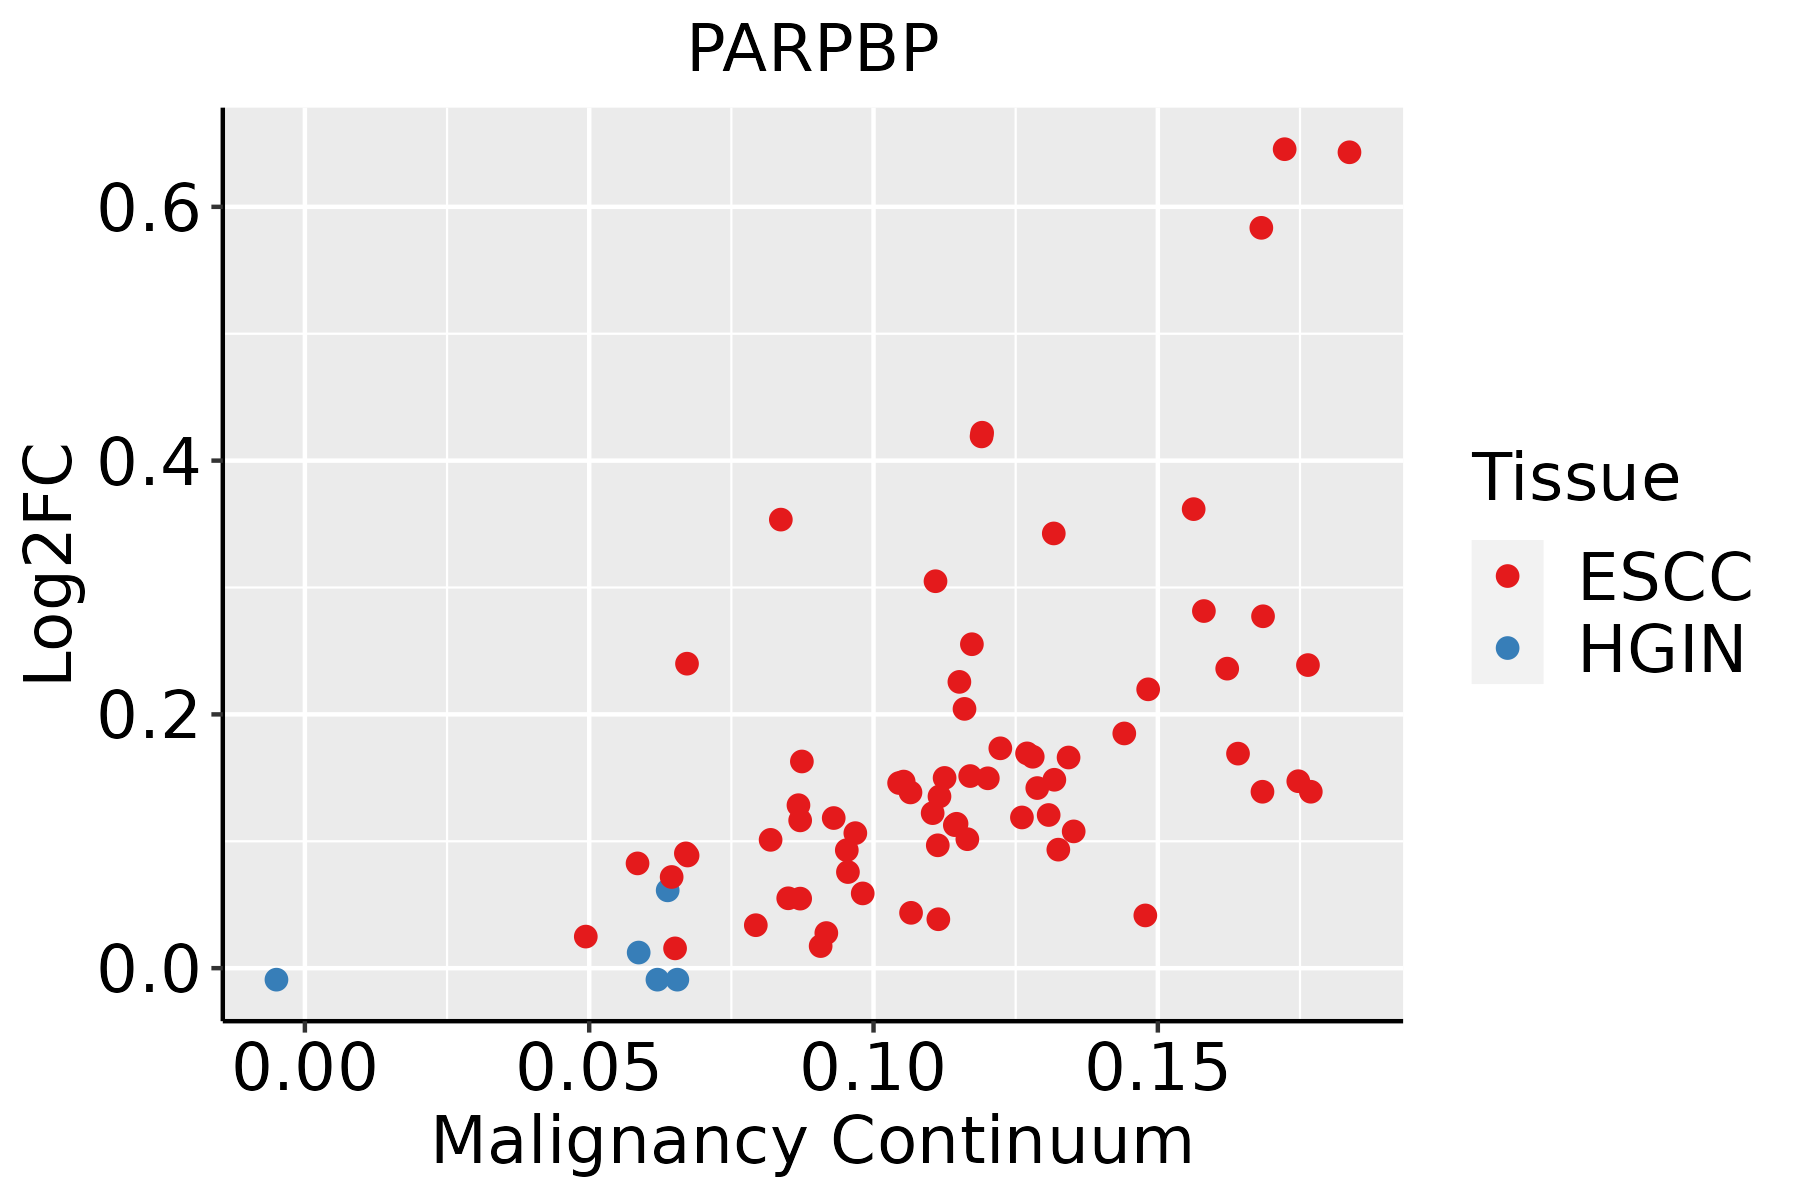
ESCC: Esophageal squamous cell carcinoma
HGIN: High-grade intraepithelial neoplasias
LGIN: Low-grade intraepithelial neoplasias
LiverThe image shows the transcriptomic changes along malignancy continuum.log2FC in expression of this searched gene in stem-like cells from each diseased tissue sample relative to stem-like cells in normal samples in each tissue plotted against the malignancy continuum. Samples are colored based on if they are from different disease stage.
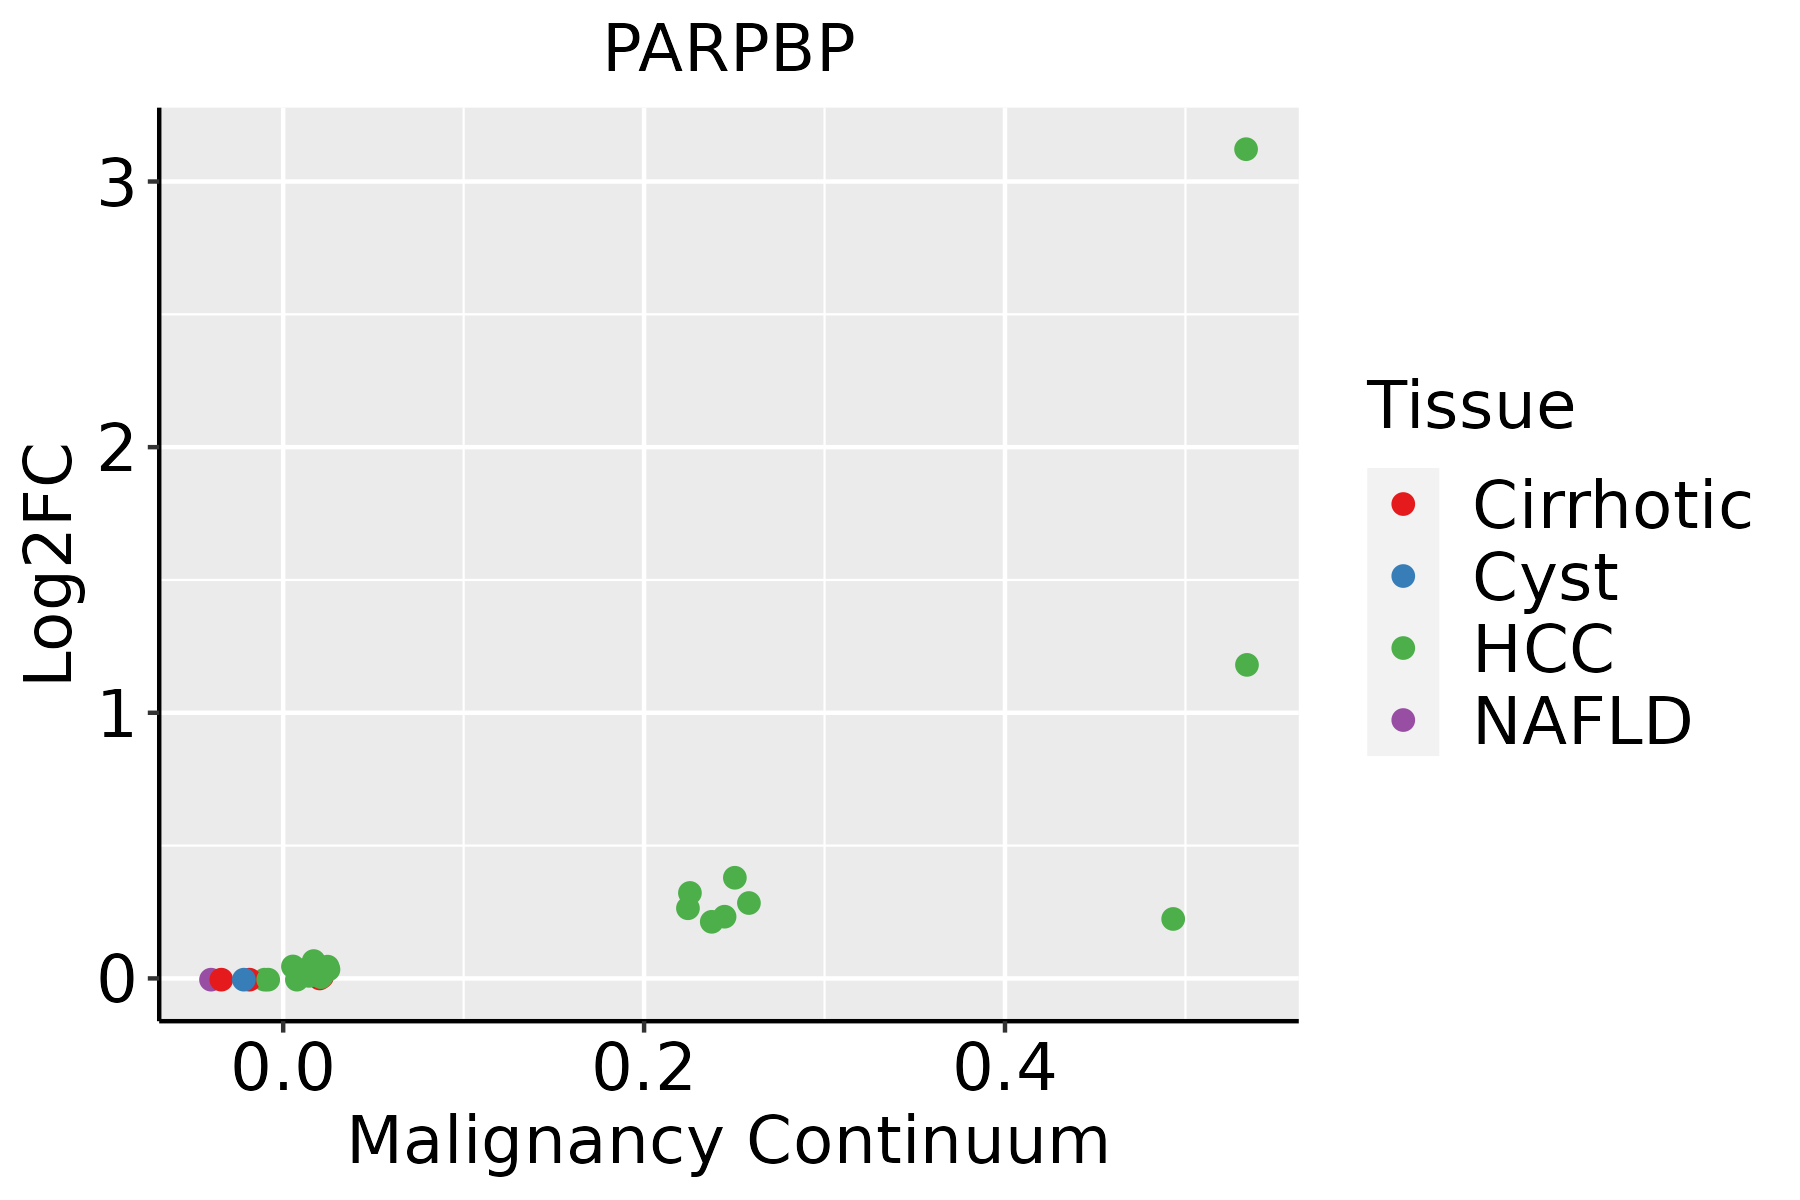
HCC: Hepatocellular carcinoma
NAFLD: Non-alcoholic fatty liver disease
Oral CavityThe image shows the transcriptomic changes along malignancy continuum.log2FC in expression of this searched gene in stem-like cells from each diseased tissue sample relative to stem-like cells in normal samples in each tissue plotted against the malignancy continuum. Samples are colored based on if they are from different disease stage.
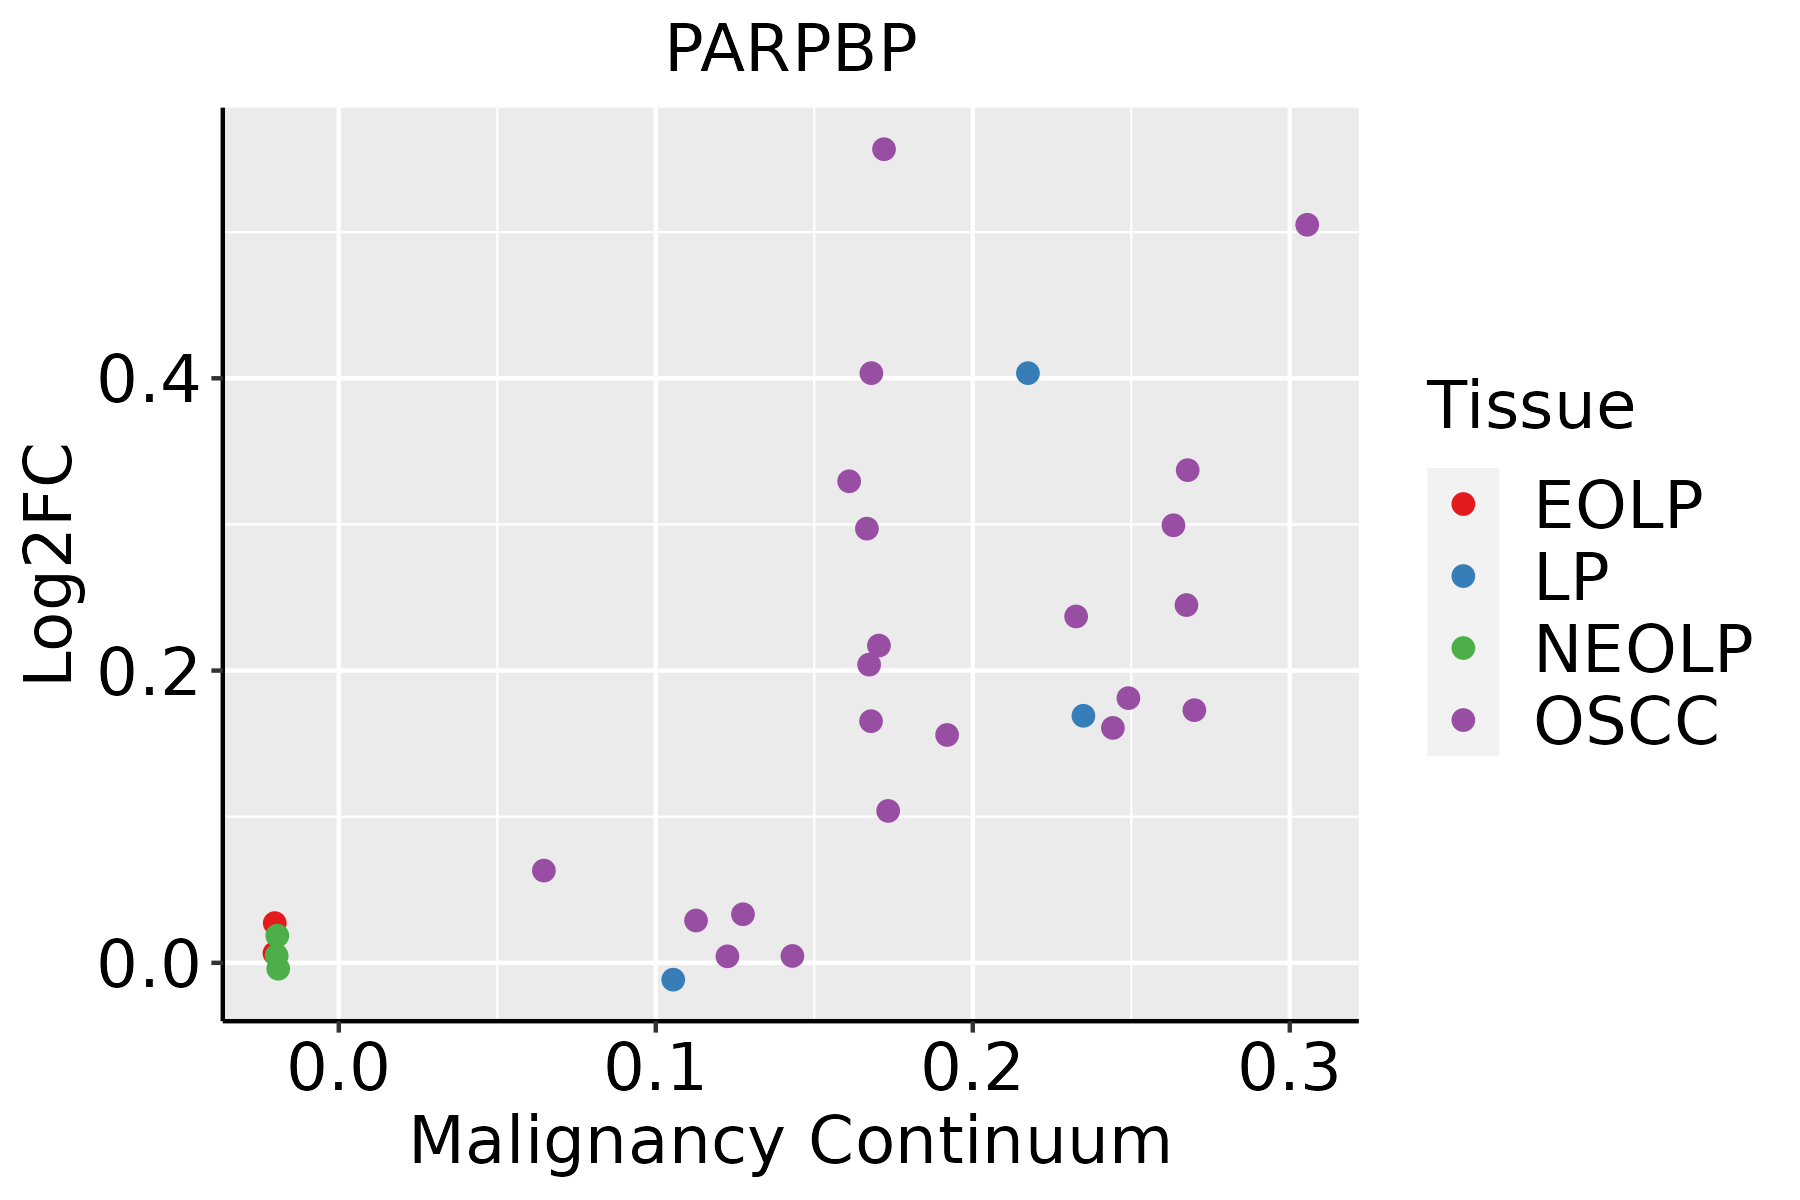
EOLP: Erosive Oral lichen planus
LP: leukoplakia
NEOLP: Non-erosive oral lichen planus
OSCC: Oral squamous cell carcinoma
SkinThe image shows the transcriptomic changes along malignancy continuum.log2FC in expression of this searched gene in stem-like cells from each diseased tissue sample relative to stem-like cells in normal samples in each tissue plotted against the malignancy continuum. Samples are colored based on if they are from different disease stage.
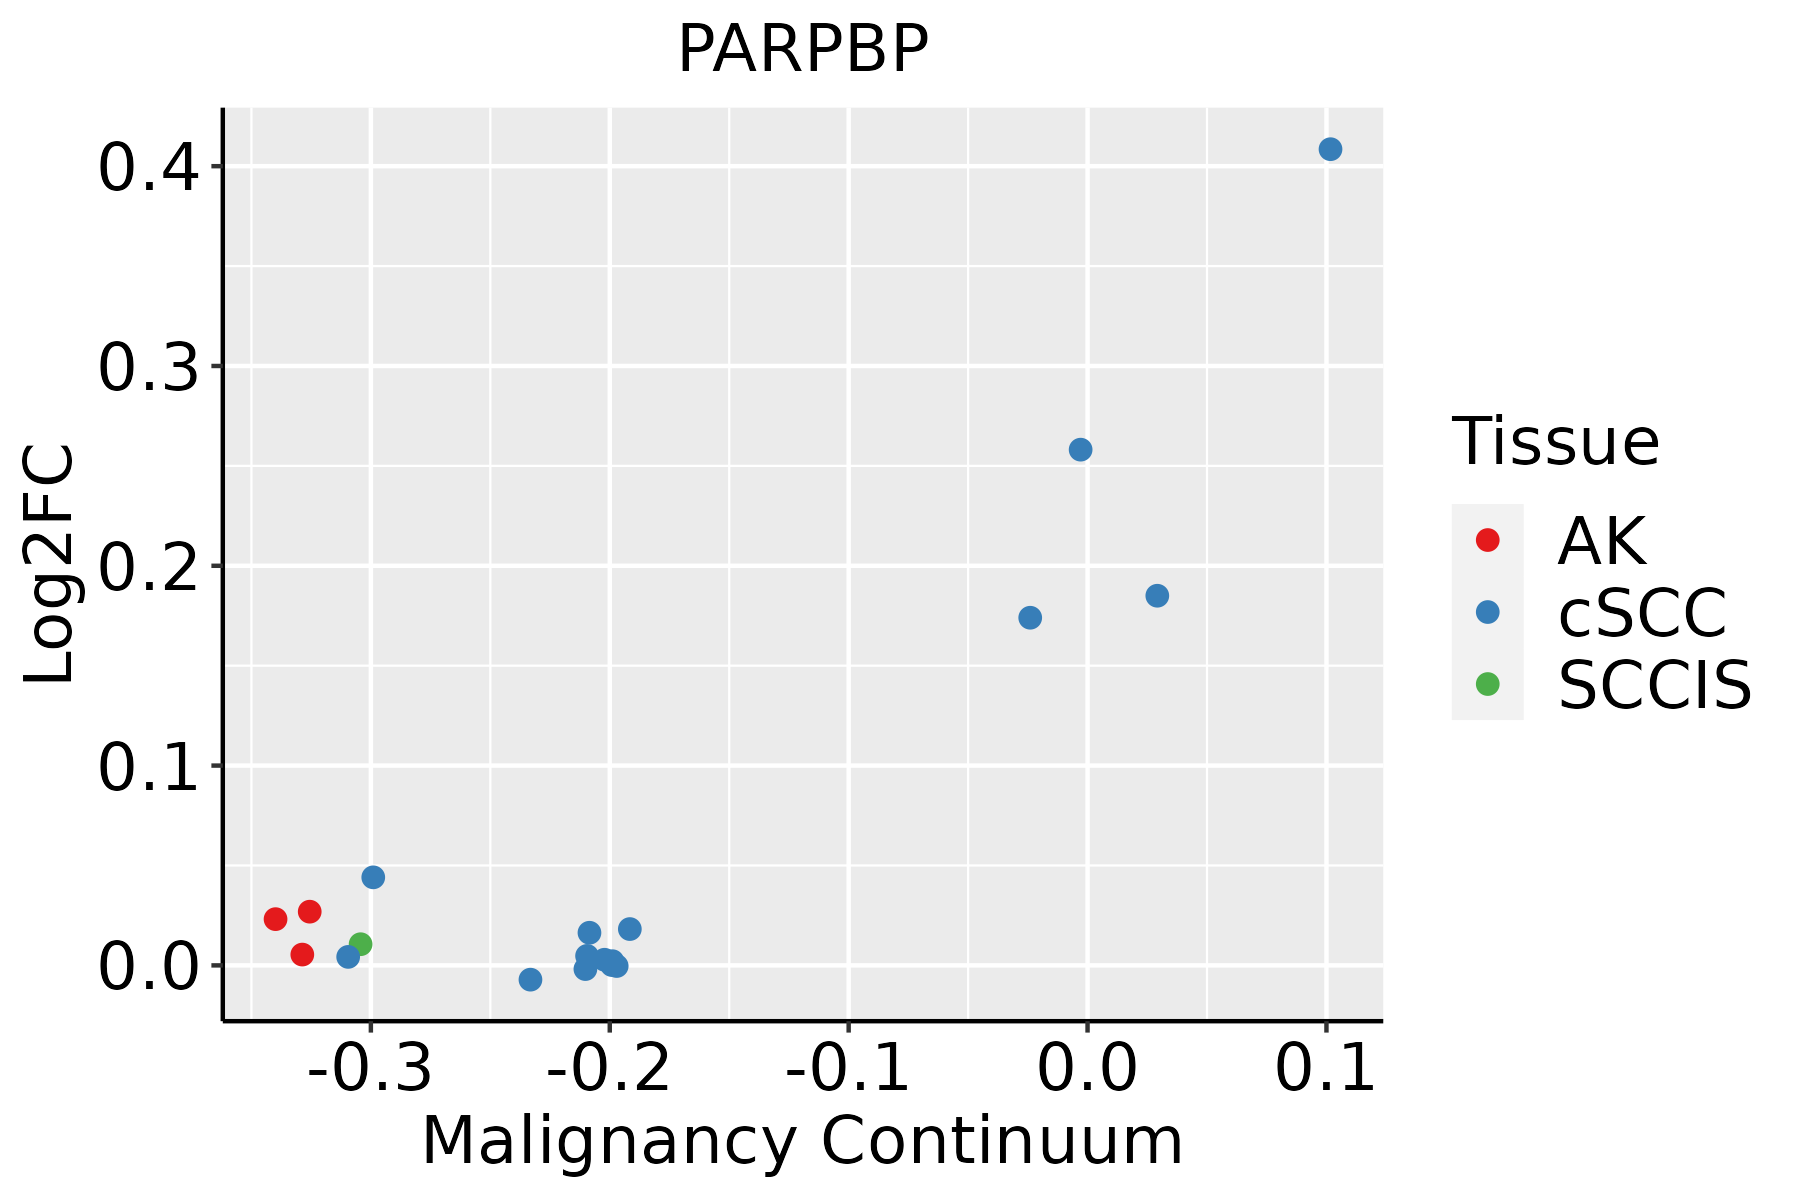
AK: Actinic keratosis
cSCC: Cutaneous squamous cell carcinoma
SCCIS:squamous cell carcinoma in situ
∗log2FC in expression of this searched gene in stem-like cells from each diseased tissue sample relative to stem-like cells in normal samples in each tissue plotted against the malignancy continuum. Samples are colored based on if they are from different disease stage.

Top

Malignant transformation related pathway analysis

check buttonFind out the enriched GO biological processes and KEGG pathways involved in transition from healthy to precancer to cancer
check button Figure of enriched GO biological processes.
TissueDisease StageEnriched GO biological Processes
ColorectumADGO analysis - Figure of enriched GO biological processes: Top 15 enriched GO BP terms are showed in the bar plot of each disease state in each tissue. Each row represents a significant GO biological process which is colored according to the -log10(p.adjust).
ColorectumSERGO analysis - Figure of enriched GO biological processes: Top 15 enriched GO BP terms are showed in the bar plot of each disease state in each tissue. Each row represents a significant GO biological process which is colored according to the -log10(p.adjust).
ColorectumMSSGO analysis - Figure of enriched GO biological processes: Top 15 enriched GO BP terms are showed in the bar plot of each disease state in each tissue. Each row represents a significant GO biological process which is colored according to the -log10(p.adjust).
ColorectumMSI-HGO analysis - Figure of enriched GO biological processes: Top 15 enriched GO BP terms are showed in the bar plot of each disease state in each tissue. Each row represents a significant GO biological process which is colored according to the -log10(p.adjust).
ColorectumFAPGO analysis - Figure of enriched GO biological processes: Top 15 enriched GO BP terms are showed in the bar plot of each disease state in each tissue. Each row represents a significant GO biological process which is colored according to the -log10(p.adjust).
∗Top 15 enriched GO BP terms are showed in the bar plot of each disease state in each tissue. Each row represents a significant GO biological process which is colored according to the -log10(p.adjust).
Page: 1 2 3 4 5 6 7 8 9 

check button Enriched GO biological processes.
GO IDTissueDisease StageDescriptionGene RatioBg Ratiopvaluep.adjustCount
GO:005105215EsophagusESCCregulation of DNA metabolic process232/8552359/187232.40e-131.13e-11232
GO:2001020110EsophagusESCCregulation of response to DNA damage stimulus145/8552219/187235.97e-101.50e-08145
GO:00063024EsophagusESCCdouble-strand break repair152/8552251/187231.33e-061.62e-05152
GO:00062826EsophagusESCCregulation of DNA repair82/8552130/187234.65e-053.66e-0482
GO:200102112EsophagusESCCnegative regulation of response to DNA damage stimulus54/855281/187231.09e-047.64e-0454
GO:00063101EsophagusESCCDNA recombination168/8552305/187235.58e-043.05e-03168
GO:20007793EsophagusESCCregulation of double-strand break repair52/855285/187232.86e-031.21e-0252
GO:00007241EsophagusESCCdouble-strand break repair via homologous recombination79/8552138/187234.05e-031.62e-0279
GO:00007251EsophagusESCCrecombinational repair80/8552140/187234.10e-031.63e-0280
GO:005105221LiverHCCregulation of DNA metabolic process198/7958359/187237.62e-071.17e-05198
GO:200102021LiverHCCregulation of response to DNA damage stimulus128/7958219/187231.31e-061.90e-05128
GO:00062824LiverHCCregulation of DNA repair74/7958130/187236.27e-043.89e-0374
GO:00063021LiverHCCdouble-strand break repair131/7958251/187231.17e-036.54e-03131
GO:2000779LiverHCCregulation of double-strand break repair47/795885/187231.17e-024.28e-0247
GO:005105210Oral cavityOSCCregulation of DNA metabolic process207/7305359/187234.45e-132.17e-11207
GO:200102017Oral cavityOSCCregulation of response to DNA damage stimulus131/7305219/187233.21e-108.72e-09131
GO:00063023Oral cavityOSCCdouble-strand break repair132/7305251/187237.93e-068.52e-05132
GO:00062825Oral cavityOSCCregulation of DNA repair75/7305130/187231.19e-051.21e-0475
GO:20010213Oral cavityOSCCnegative regulation of response to DNA damage stimulus49/730581/187237.27e-055.72e-0449
GO:0006310Oral cavityOSCCDNA recombination147/7305305/187236.33e-043.56e-03147
Page: 1 2 

check button Enriched KEGG pathways.
Pathway IDTissueDisease StageDescriptionGene RatioBg Ratiopvaluep.adjustqvalueCount
Page: 1 

Top

Cell-cell communication analysis

check buttonIdentification of potential cell-cell interactions between two cell types and their ligand-receptor pairs for different disease states
LigandReceptorLRpairPathwayTissueDisease Stage
Page: 1 

Top

Single-cell gene regulatory network inference analysis

check buttonFind out the significant the regulons (TFs) and the target genes of each regulon across cell types for different disease states
TFCell TypeTissueDisease StageTarget GeneRSSRegulon Activity
∗The dot plots of a searched regulon are shown for all cell subpopulations in each disease state of each tissue based on the regulon specific score inferred using pySCENIC and by calculating the average expression.
Page: 1 

Top

Somatic mutation of malignant transformation related genes

check buttonAnnotation of somatic variants for genes involved in malignant transformation
Hugo SymbolVariant ClassVariant ClassificationdbSNP RSHGVScHGVSpHGVSp ShortSWISSPROTBIOTYPESIFTPolyPhenTumor Sample BarcodeTissueHistologySexAgeStageTherapy TypesDrugsOutcome
PARPBPSNVMissense_Mutationc.1348G>Cp.Ala450Prop.A450Pprotein_codingdeleterious(0)probably_damaging(0.999)TCGA-A2-A0T3-01Breastbreast invasive carcinomaFemale<65I/IIChemotherapyadriamycinSD
PARPBPSNVMissense_Mutationc.1879A>Gp.Lys627Glup.K627Eprotein_codingdeleterious(0.04)benign(0.037)TCGA-AC-A2FG-01Breastbreast invasive carcinomaFemale>=65I/IIHormone TherapyarimidexCR
PARPBPSNVMissense_Mutationc.1076C>Tp.Ser359Leup.S359Lprotein_codingdeleterious(0)probably_damaging(0.998)TCGA-C8-A275-01Breastbreast invasive carcinomaFemale<65I/IIUnknownUnknownSD
PARPBPSNVMissense_Mutationnovelc.1216N>Cp.Thr406Prop.T406Pprotein_codingdeleterious(0.03)benign(0.013)TCGA-2W-A8YY-01Cervixcervical & endocervical cancerFemale<65I/IIChemotherapycisplatinCR
PARPBPSNVMissense_Mutationnovelc.29N>Tp.Ser10Leup.S10Lprotein_codingtolerated(1)benign(0)TCGA-EA-A4BA-01Cervixcervical & endocervical cancerFemale<65I/IIChemotherapycarboplatinCR
PARPBPSNVMissense_Mutationrs758656040c.994A>Gp.Asn332Aspp.N332Dprotein_codingtolerated(0.5)benign(0.011)TCGA-FU-A3HZ-01Cervixcervical & endocervical cancerFemale<65I/IIChemotherapycisplatinCR
PARPBPSNVMissense_Mutationrs143436739c.1727N>Tp.Ser576Leup.S576Lprotein_codingtolerated(0.34)benign(0.006)TCGA-MA-AA41-01Cervixcervical & endocervical cancerFemale<65I/IIUnknownUnknownSD
PARPBPinsertionFrame_Shift_Insnovelc.891_892insTp.Leu299PhefsTer8p.L299Ffs*8protein_codingTCGA-2W-A8YY-01Cervixcervical & endocervical cancerFemale<65I/IIChemotherapycisplatinCR
PARPBPinsertionFrame_Shift_Insnovelc.876_877insAp.Gln294ThrfsTer13p.Q294Tfs*13protein_codingTCGA-IR-A3LH-01Cervixcervical & endocervical cancerFemale<65I/IIChemotherapycisplatinCR
PARPBPSNVMissense_Mutationnovelc.1482N>Tp.Glu494Aspp.E494Dprotein_codingtolerated(0.12)possibly_damaging(0.655)TCGA-AA-3984-01Colorectumcolon adenocarcinomaFemale<65I/IIUnknownUnknownSD
Page: 1 2 3 4 5 6 7 8 

Top

Related drugs of malignant transformation related genes

check buttonIdentification of chemicals and drugs interact with genes involved in malignant transfromation
(DGIdb 4.0)
Entrez IDSymbolCategoryInteraction TypesDrug Claim NameDrug NamePMIDs
Page: 1