Schematic overview of the cellular and molecular mechanisms involved in the cancer progression, including the proposed cellular and molecular mechanisms in cancer cells trajectory. AT1: alveolar type 1 cells; AT2: alveolar type 2 cells; AAH: atypical adenomatous hyperplasia; AIS: adenocarcinoma in situ; MIA: minimally invasive adenocarcinoma; IA: invasive adenocarcinoma; EMT: epithelial-mesenchymal transition

Home

Download

Statistics

Help

Contact

Center for Computational Systems Medicine
leaf

Gene summary

leaf

Malignant transformation analysis

leaf

Malignant transformation related pathway analysis

leaf

Cell-cell communication analysis

leaf

Single-cell gene regulatory network inference analysis

leaf

Somatic mutation of malignant transformation related genes

leaf

Related drugs of malignant transformation related genes

Gene: PACS1

Gene summary for PACS1

check button Gene summary.

Gene informationSpeciesHuman
Gene symbol

PACS1

Gene ID

55690

Gene namephosphofurin acidic cluster sorting protein 1
Gene AliasMRD17
Cytomap11q13.1-q13.2
Gene Typeprotein-coding
GO ID

GO:0008104

UniProtAcc

A0A024R5H6


Top

Malignant transformation analysis

check button Identification of the aberrant gene expression in precancerous and cancerous lesions by comparing the gene expression of stem-like cells in diseased tissues with normal stem cells
check button Malignant transformation involving gene list.
Entrez IDSymbolReplicatesSpeciesOrganTissueAdj P-valueLog2FCMalignancy
55690PACS1P27T-EHumanEsophagusESCC3.53e-106.53e-020.1055
55690PACS1P28T-EHumanEsophagusESCC3.64e-172.47e-010.1149
55690PACS1P30T-EHumanEsophagusESCC2.60e-072.30e-010.137
55690PACS1P31T-EHumanEsophagusESCC1.04e-141.93e-010.1251
55690PACS1P32T-EHumanEsophagusESCC1.94e-121.68e-010.1666
55690PACS1P36T-EHumanEsophagusESCC1.61e-072.28e-010.1187
55690PACS1P37T-EHumanEsophagusESCC5.03e-132.81e-010.1371
55690PACS1P38T-EHumanEsophagusESCC2.25e-052.04e-010.127
55690PACS1P39T-EHumanEsophagusESCC1.86e-047.49e-020.0894
55690PACS1P40T-EHumanEsophagusESCC3.82e-092.62e-010.109
55690PACS1P42T-EHumanEsophagusESCC3.68e-103.14e-010.1175
55690PACS1P44T-EHumanEsophagusESCC6.06e-045.49e-020.1096
55690PACS1P47T-EHumanEsophagusESCC9.95e-129.13e-020.1067
55690PACS1P48T-EHumanEsophagusESCC1.05e-121.30e-010.0959
55690PACS1P49T-EHumanEsophagusESCC1.08e-067.77e-010.1768
55690PACS1P52T-EHumanEsophagusESCC6.90e-121.62e-010.1555
55690PACS1P54T-EHumanEsophagusESCC6.83e-071.86e-010.0975
55690PACS1P56T-EHumanEsophagusESCC3.60e-044.66e-010.1613
55690PACS1P57T-EHumanEsophagusESCC2.68e-132.88e-010.0926
55690PACS1P61T-EHumanEsophagusESCC2.96e-042.21e-010.099
Page: 1 2 3 4 5 6 7 8 

check button Transcriptomic changes along malignancy continuum.
TissueExpression DynamicsAbbreviation
CervixThe image shows the transcriptomic changes along malignancy continuum.log2FC in expression of this searched gene in stem-like cells from each diseased tissue sample relative to stem-like cells in normal samples in each tissue plotted against the malignancy continuum. Samples are colored based on if they are from different disease stage.CC: Cervix cancer
HSIL_HPV: HPV-infected high-grade squamous intraepithelial lesions
N_HPV: HPV-infected normal cervix
EndometriumThe image shows the transcriptomic changes along malignancy continuum.log2FC in expression of this searched gene in stem-like cells from each diseased tissue sample relative to stem-like cells in normal samples in each tissue plotted against the malignancy continuum. Samples are colored based on if they are from different disease stage.
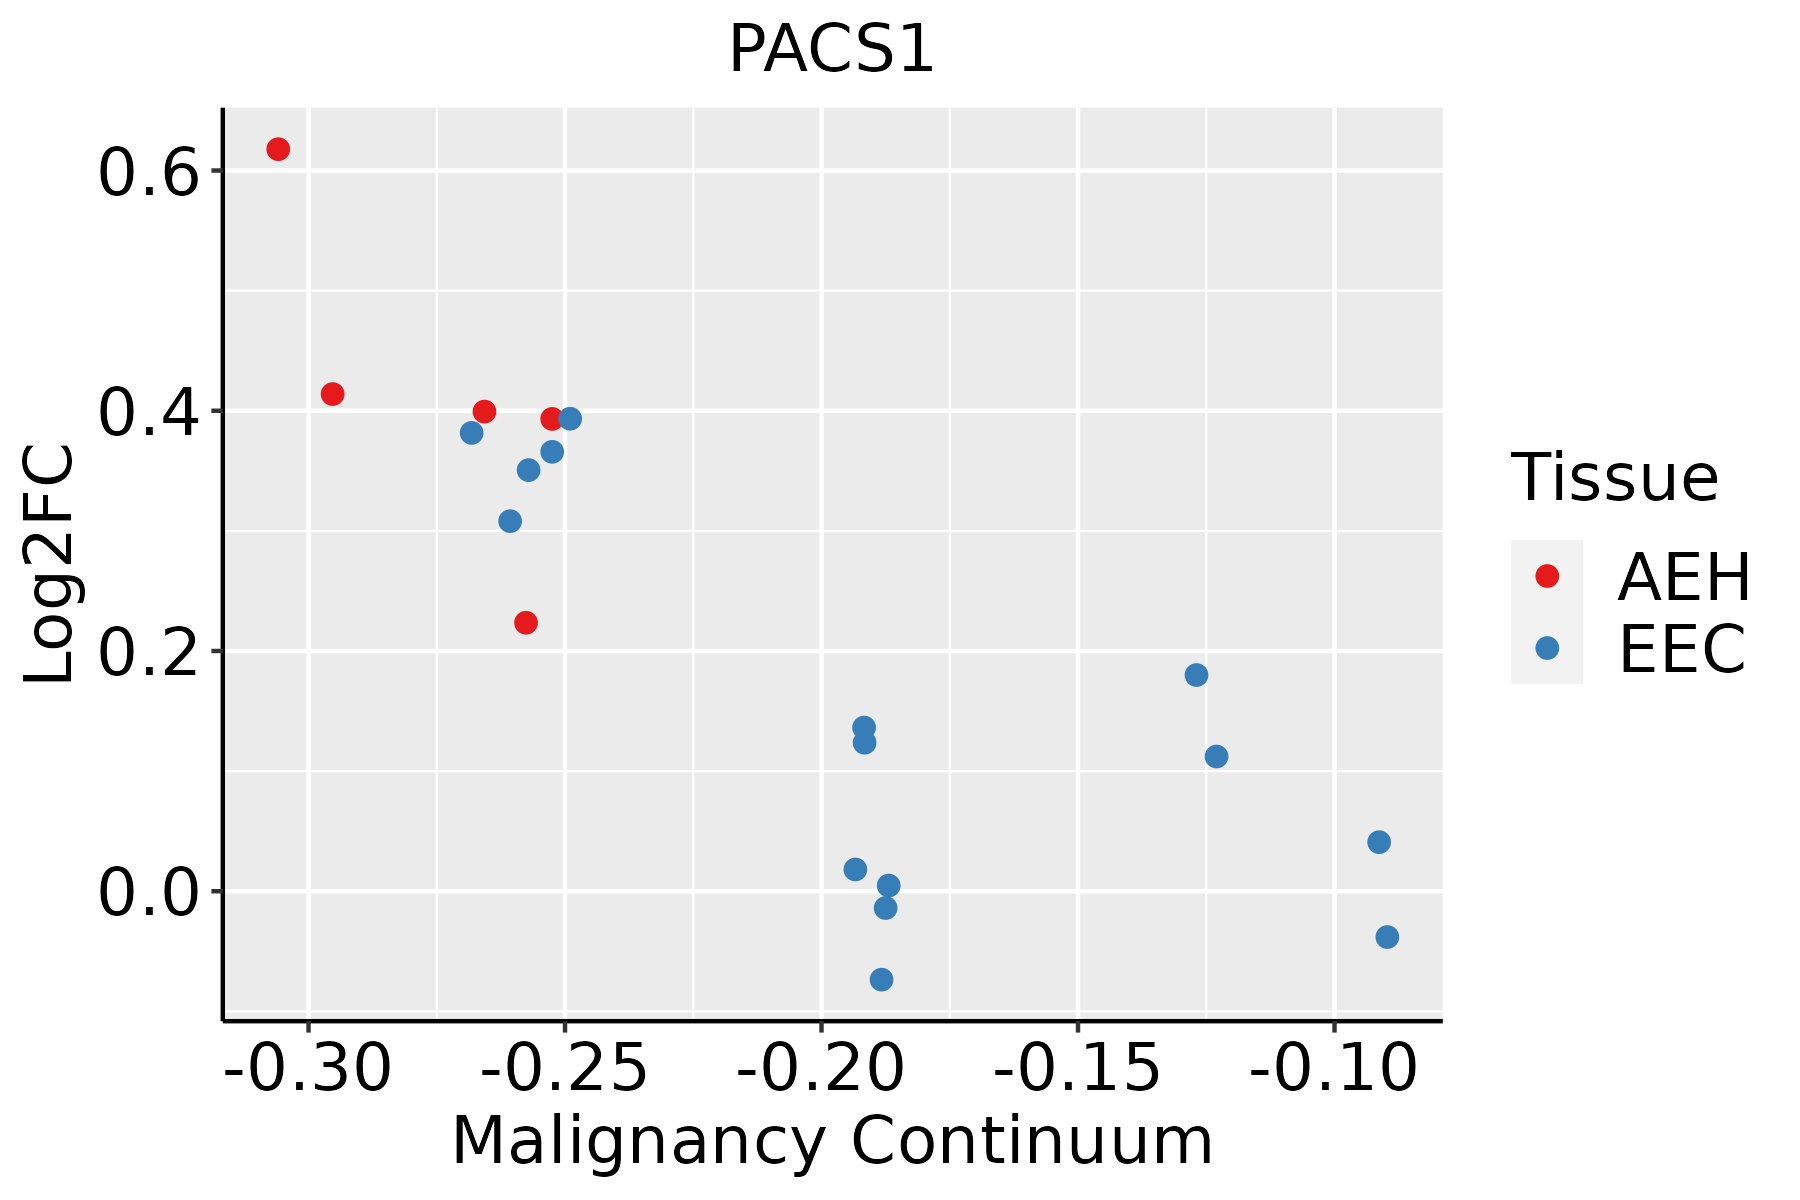
AEH: Atypical endometrial hyperplasia
EEC: Endometrioid Cancer
EsophagusThe image shows the transcriptomic changes along malignancy continuum.log2FC in expression of this searched gene in stem-like cells from each diseased tissue sample relative to stem-like cells in normal samples in each tissue plotted against the malignancy continuum. Samples are colored based on if they are from different disease stage.ESCC: Esophageal squamous cell carcinoma
HGIN: High-grade intraepithelial neoplasias
LGIN: Low-grade intraepithelial neoplasias
LiverThe image shows the transcriptomic changes along malignancy continuum.log2FC in expression of this searched gene in stem-like cells from each diseased tissue sample relative to stem-like cells in normal samples in each tissue plotted against the malignancy continuum. Samples are colored based on if they are from different disease stage.
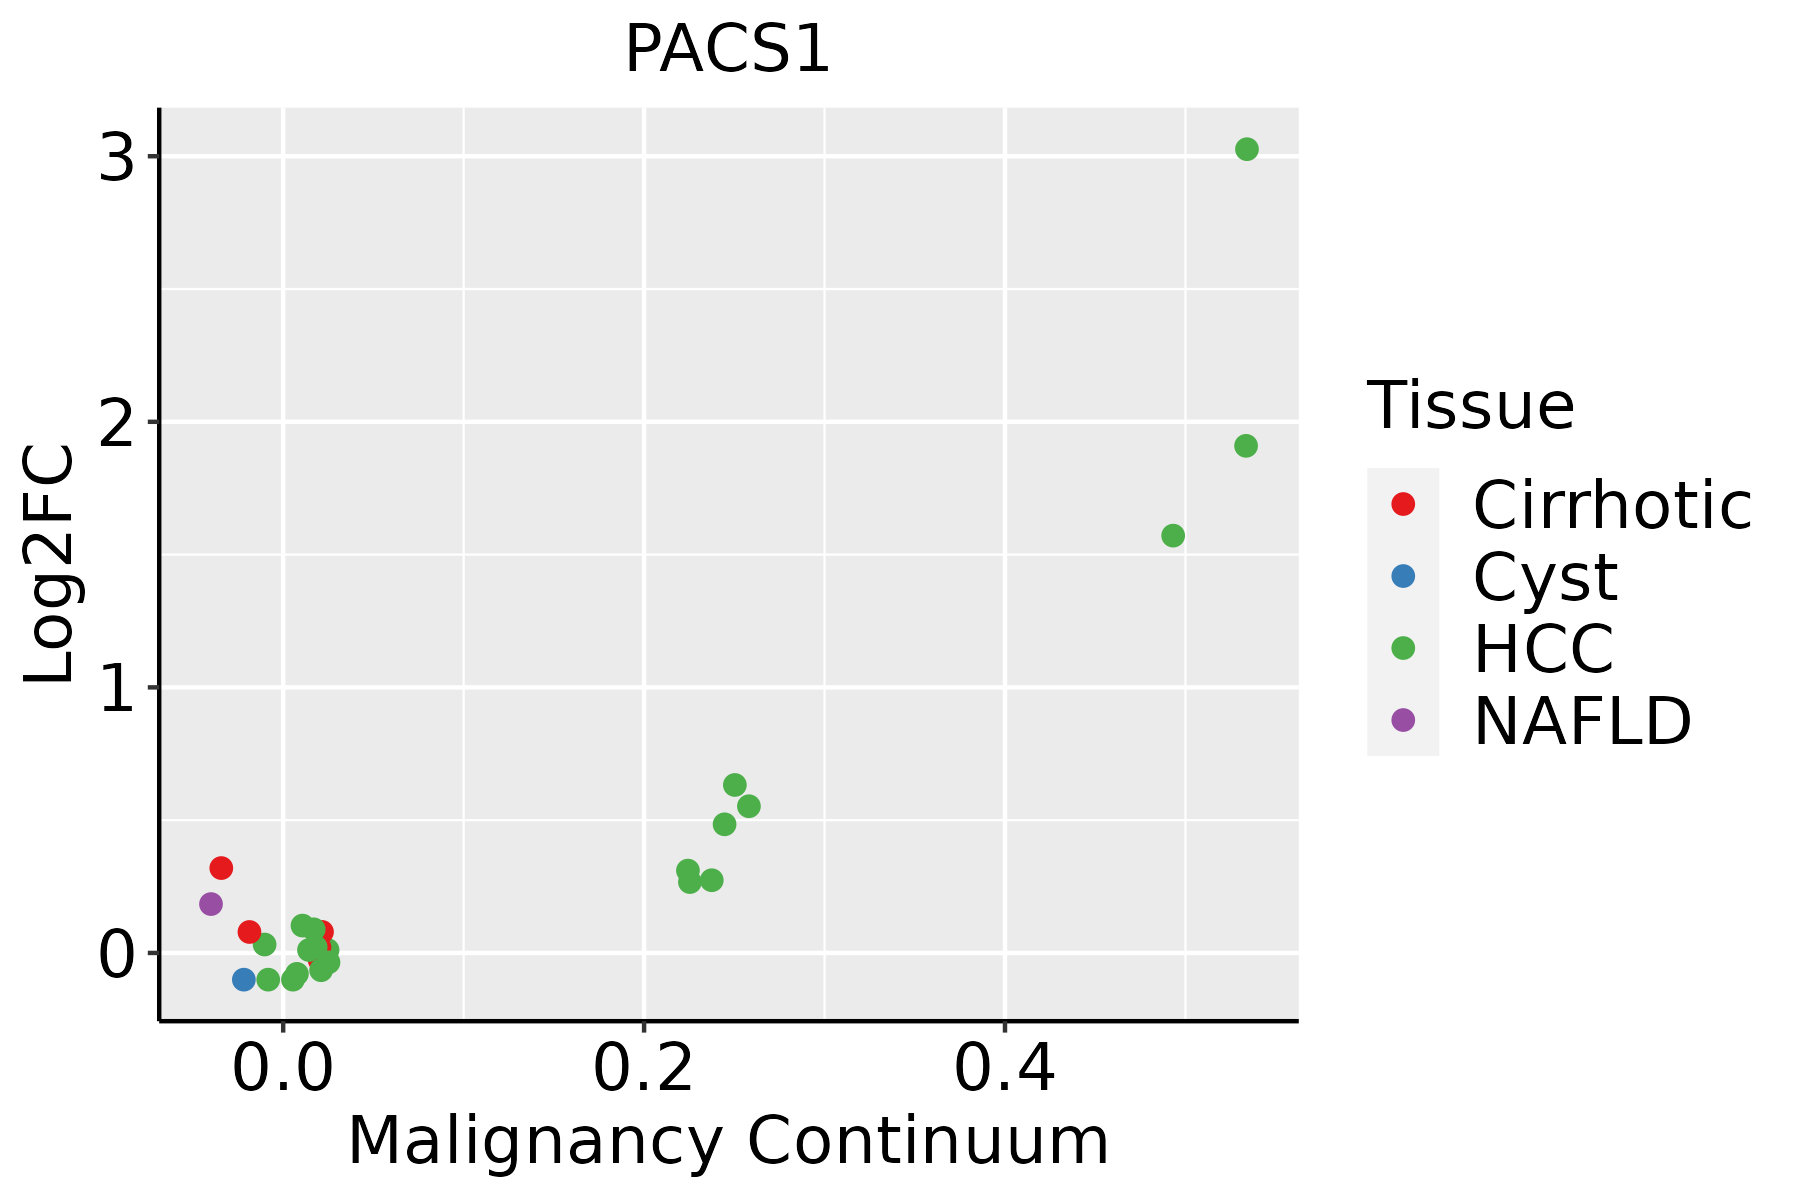
HCC: Hepatocellular carcinoma
NAFLD: Non-alcoholic fatty liver disease
LungThe image shows the transcriptomic changes along malignancy continuum.log2FC in expression of this searched gene in stem-like cells from each diseased tissue sample relative to stem-like cells in normal samples in each tissue plotted against the malignancy continuum. Samples are colored based on if they are from different disease stage.
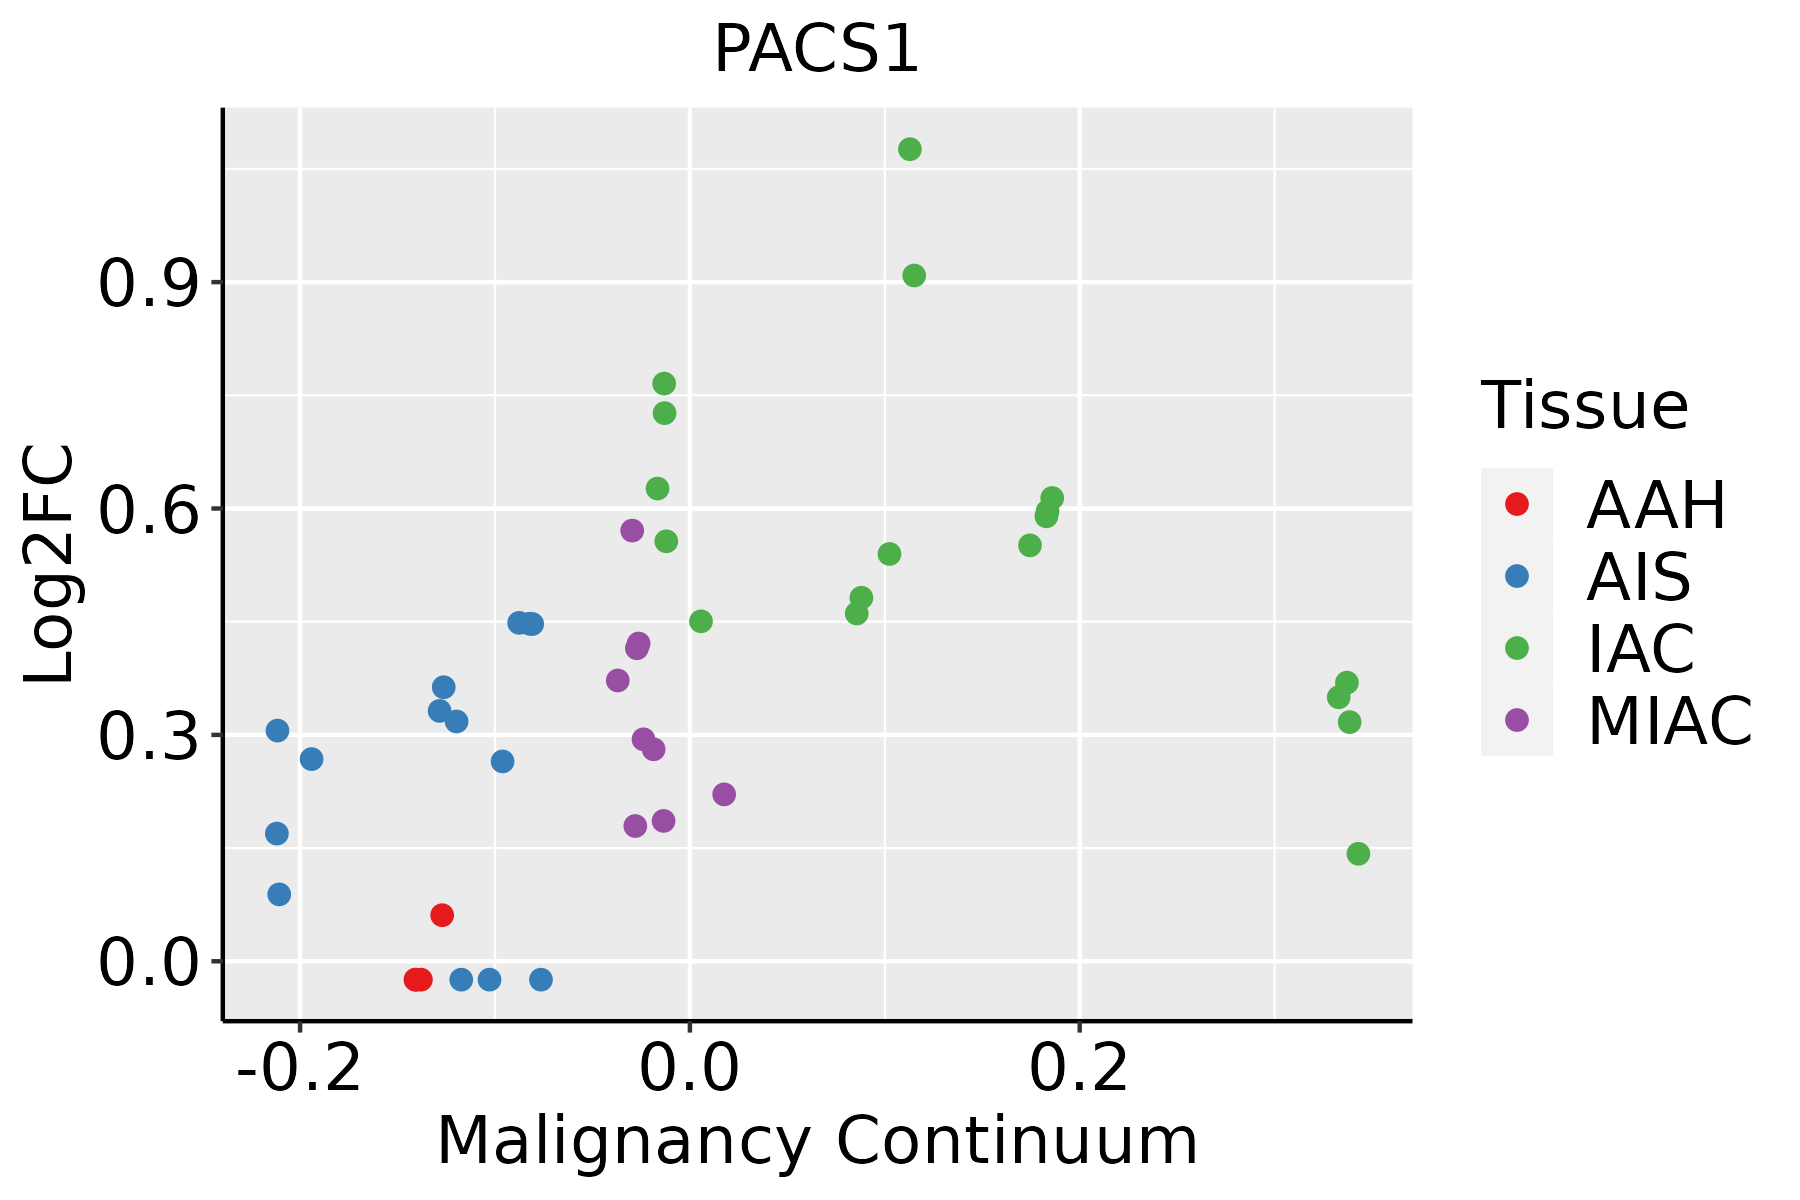
AAH: Atypical adenomatous hyperplasia
AIS: Adenocarcinoma in situ
IAC: Invasive lung adenocarcinoma
MIA: Minimally invasive adenocarcinoma
Oral CavityThe image shows the transcriptomic changes along malignancy continuum.log2FC in expression of this searched gene in stem-like cells from each diseased tissue sample relative to stem-like cells in normal samples in each tissue plotted against the malignancy continuum. Samples are colored based on if they are from different disease stage.EOLP: Erosive Oral lichen planus
LP: leukoplakia
NEOLP: Non-erosive oral lichen planus
OSCC: Oral squamous cell carcinoma
ProstateThe image shows the transcriptomic changes along malignancy continuum.log2FC in expression of this searched gene in stem-like cells from each diseased tissue sample relative to stem-like cells in normal samples in each tissue plotted against the malignancy continuum. Samples are colored based on if they are from different disease stage.
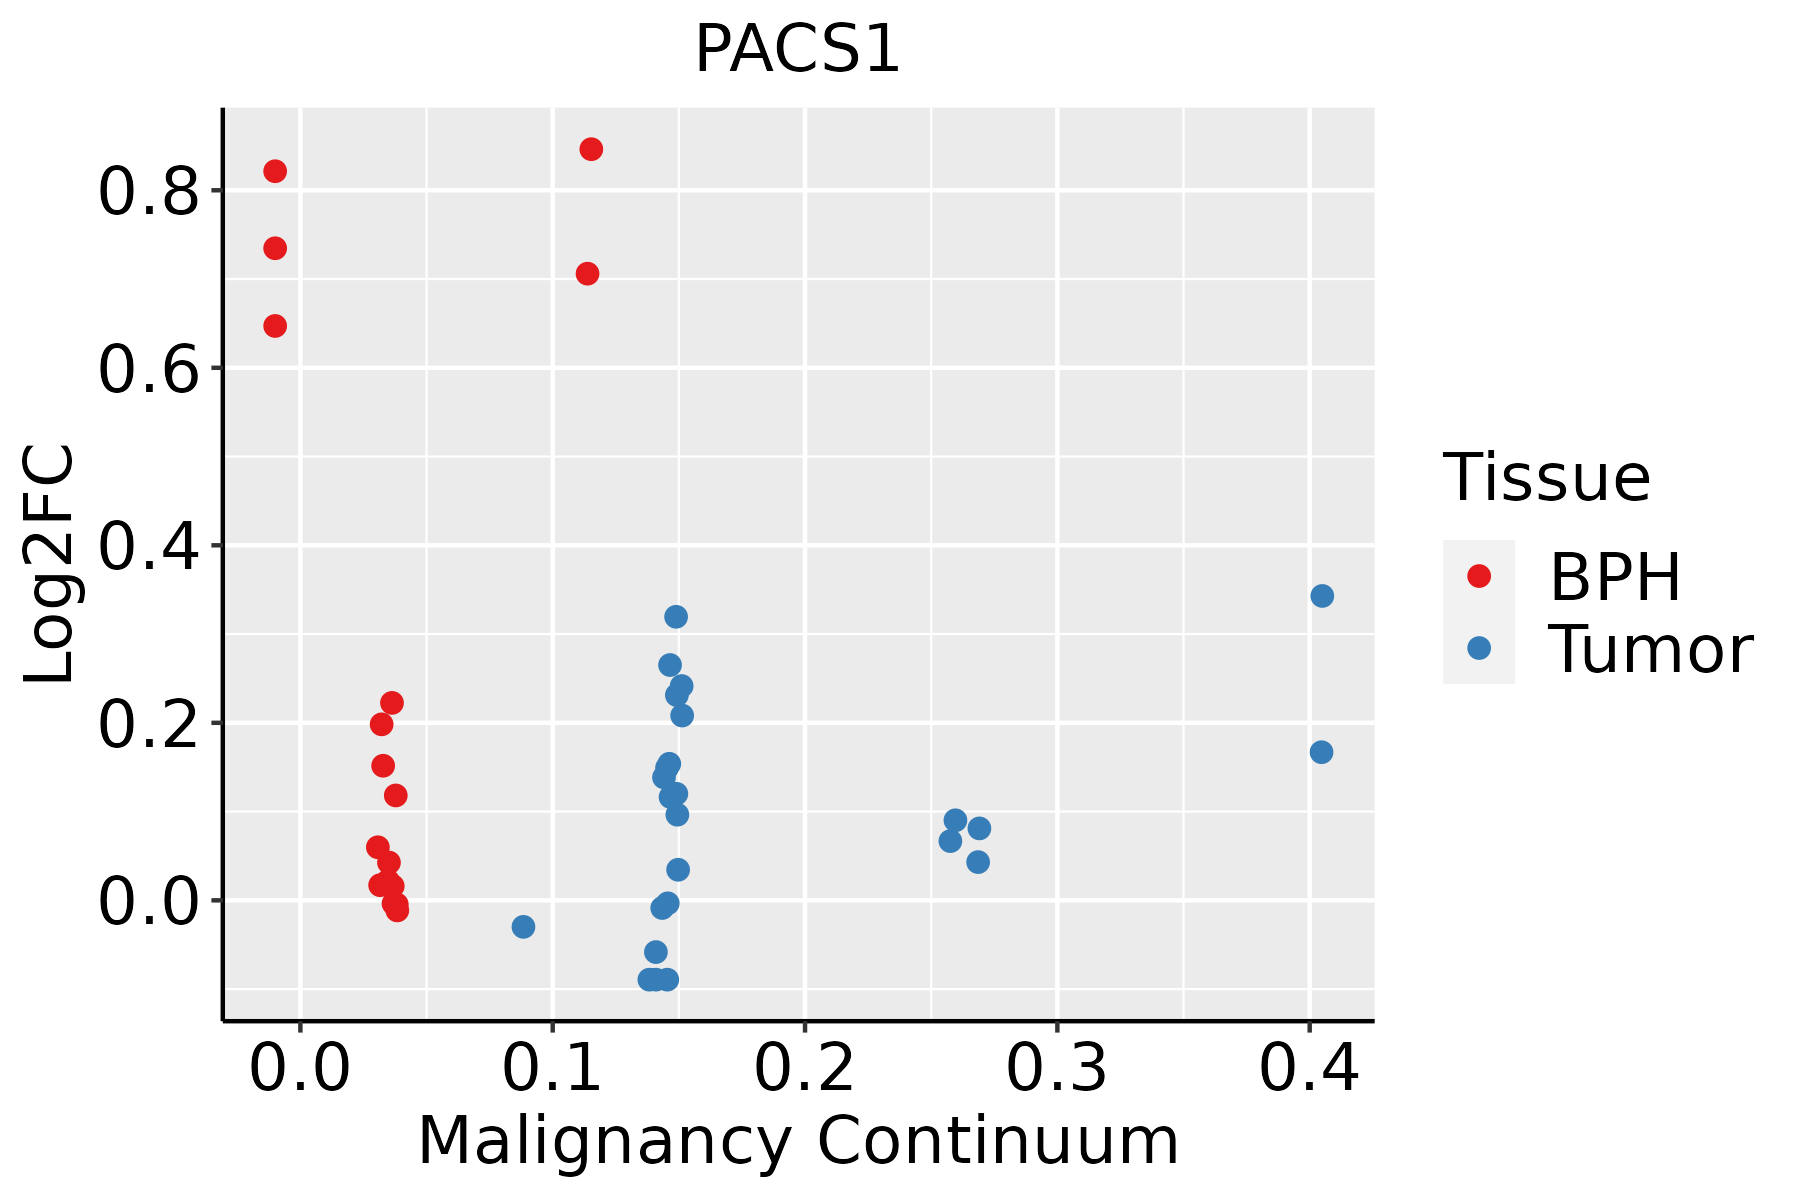
BPH: Benign Prostatic Hyperplasia
ThyroidThe image shows the transcriptomic changes along malignancy continuum.log2FC in expression of this searched gene in stem-like cells from each diseased tissue sample relative to stem-like cells in normal samples in each tissue plotted against the malignancy continuum. Samples are colored based on if they are from different disease stage.ATC: Anaplastic thyroid cancer
HT: Hashimoto's thyroiditis
PTC: Papillary thyroid cancer
∗log2FC in expression of this searched gene in stem-like cells from each diseased tissue sample relative to stem-like cells in normal samples in each tissue plotted against the malignancy continuum. Samples are colored based on if they are from different disease stage.

Top

Malignant transformation related pathway analysis

check buttonFind out the enriched GO biological processes and KEGG pathways involved in transition from healthy to precancer to cancer
check button Figure of enriched GO biological processes.
TissueDisease StageEnriched GO biological Processes
ColorectumADGO analysis - Figure of enriched GO biological processes: Top 15 enriched GO BP terms are showed in the bar plot of each disease state in each tissue. Each row represents a significant GO biological process which is colored according to the -log10(p.adjust).
ColorectumSERGO analysis - Figure of enriched GO biological processes: Top 15 enriched GO BP terms are showed in the bar plot of each disease state in each tissue. Each row represents a significant GO biological process which is colored according to the -log10(p.adjust).
ColorectumMSSGO analysis - Figure of enriched GO biological processes: Top 15 enriched GO BP terms are showed in the bar plot of each disease state in each tissue. Each row represents a significant GO biological process which is colored according to the -log10(p.adjust).
ColorectumMSI-HGO analysis - Figure of enriched GO biological processes: Top 15 enriched GO BP terms are showed in the bar plot of each disease state in each tissue. Each row represents a significant GO biological process which is colored according to the -log10(p.adjust).
ColorectumFAPGO analysis - Figure of enriched GO biological processes: Top 15 enriched GO BP terms are showed in the bar plot of each disease state in each tissue. Each row represents a significant GO biological process which is colored according to the -log10(p.adjust).
∗Top 15 enriched GO BP terms are showed in the bar plot of each disease state in each tissue. Each row represents a significant GO biological process which is colored according to the -log10(p.adjust).
Page: 1 2 3 4 5 6 7 8 9 

check button Enriched GO biological processes.
GO IDTissueDisease StageDescriptionGene RatioBg Ratiopvaluep.adjustCount
GO:007265910CervixCCprotein localization to plasma membrane73/2311284/187234.95e-106.73e-0873
GO:19907788CervixCCprotein localization to cell periphery78/2311333/187231.22e-089.73e-0778
GO:007265914EndometriumAEHprotein localization to plasma membrane63/2100284/187237.58e-083.92e-0663
GO:19907789EndometriumAEHprotein localization to cell periphery68/2100333/187236.38e-072.38e-0568
GO:007265915EndometriumEECprotein localization to plasma membrane64/2168284/187231.05e-075.05e-0664
GO:199077814EndometriumEECprotein localization to cell periphery69/2168333/187239.71e-073.31e-0569
GO:0072659110EsophagusESCCprotein localization to plasma membrane193/8552284/187231.95e-141.03e-12193
GO:199077819EsophagusESCCprotein localization to cell periphery217/8552333/187234.08e-131.88e-11217
GO:00340676EsophagusESCCprotein localization to Golgi apparatus23/855229/187232.25e-041.40e-0323
GO:007265921LiverHCCprotein localization to plasma membrane177/7958284/187231.02e-114.18e-10177
GO:199077821LiverHCCprotein localization to cell periphery200/7958333/187236.07e-112.23e-09200
GO:003406721LiverHCCprotein localization to Golgi apparatus23/795829/187235.86e-055.38e-0423
GO:00726598LungIACprotein localization to plasma membrane60/2061284/187234.74e-073.10e-0560
GO:19907787LungIACprotein localization to cell periphery66/2061333/187231.44e-067.22e-0566
GO:007265912LungAISprotein localization to plasma membrane58/1849284/187236.25e-087.14e-0658
GO:199077812LungAISprotein localization to cell periphery64/1849333/187231.42e-071.48e-0564
GO:007265918Oral cavityOSCCprotein localization to plasma membrane169/7305284/187231.69e-127.21e-11169
GO:199077816Oral cavityOSCCprotein localization to cell periphery190/7305333/187231.46e-115.13e-10190
GO:00340675Oral cavityOSCCprotein localization to Golgi apparatus21/730529/187232.73e-041.73e-0321
GO:007265919Oral cavityLPprotein localization to plasma membrane119/4623284/187231.11e-106.44e-09119
Page: 1 2 

check button Enriched KEGG pathways.
Pathway IDTissueDisease StageDescriptionGene RatioBg Ratiopvaluep.adjustqvalueCount
Page: 1 

Top

Cell-cell communication analysis

check buttonIdentification of potential cell-cell interactions between two cell types and their ligand-receptor pairs for different disease states
LigandReceptorLRpairPathwayTissueDisease Stage
Page: 1 

Top

Single-cell gene regulatory network inference analysis

check buttonFind out the significant the regulons (TFs) and the target genes of each regulon across cell types for different disease states
TFCell TypeTissueDisease StageTarget GeneRSSRegulon Activity
∗The dot plots of a searched regulon are shown for all cell subpopulations in each disease state of each tissue based on the regulon specific score inferred using pySCENIC and by calculating the average expression.
Page: 1 

Top

Somatic mutation of malignant transformation related genes

check buttonAnnotation of somatic variants for genes involved in malignant transformation
Hugo SymbolVariant ClassVariant ClassificationdbSNP RSHGVScHGVSpHGVSp ShortSWISSPROTBIOTYPESIFTPolyPhenTumor Sample BarcodeTissueHistologySexAgeStageTherapy TypesDrugsOutcome
PACS1SNVMissense_Mutationc.2369G>Ap.Arg790Glnp.R790QQ6VY07protein_codingtolerated(0.07)benign(0.024)TCGA-A8-A06Q-01Breastbreast invasive carcinomaFemale<65III/IVUnknownUnknownSD
PACS1SNVMissense_Mutationrs398123009c.607N>Tp.Arg203Trpp.R203WQ6VY07protein_codingdeleterious(0)probably_damaging(0.948)TCGA-AC-A3QP-01Breastbreast invasive carcinomaFemale>=65I/IIHormone TherapyfemaraSD
PACS1SNVMissense_Mutationc.1591N>Tp.Ser531Cysp.S531CQ6VY07protein_codingdeleterious(0.04)possibly_damaging(0.887)TCGA-AN-A0AL-01Breastbreast invasive carcinomaFemale<65III/IVUnknownUnknownSD
PACS1SNVMissense_Mutationc.2538G>Cp.Lys846Asnp.K846NQ6VY07protein_codingtolerated(0.07)probably_damaging(0.998)TCGA-D8-A1J8-01Breastbreast invasive carcinomaFemale>=65I/IIHormone TherapynolvadexSD
PACS1SNVMissense_Mutationc.1936N>Ap.Leu646Metp.L646MQ6VY07protein_codingdeleterious(0)probably_damaging(0.999)TCGA-D8-A1XQ-01Breastbreast invasive carcinomaFemale>=65I/IIUnknownUnknownSD
PACS1SNVMissense_Mutationnovelc.1619N>Ap.Ser540Asnp.S540NQ6VY07protein_codingtolerated(0.38)benign(0.056)TCGA-E9-A5FL-01Breastbreast invasive carcinomaFemale>=65I/IIUnknownUnknownSD
PACS1insertionFrame_Shift_Insnovelc.2183_2184insTCTCTGTGCACAGCCCCTCCACTCTGCCAGTTTTp.Met729LeufsTer18p.M729Lfs*18Q6VY07protein_codingTCGA-AO-A0J9-01Breastbreast invasive carcinomaFemale<65III/IVChemotherapycyclophosphamidePD
PACS1deletionFrame_Shift_Delnovelc.2175delNp.Ala726ProfsTer5p.A726Pfs*5Q6VY07protein_codingTCGA-D8-A27V-01Breastbreast invasive carcinomaFemale<65I/IIHormone TherapytamoxiphenSD
PACS1SNVMissense_Mutationnovelc.1601N>Tp.Ser534Phep.S534FQ6VY07protein_codingdeleterious(0.04)probably_damaging(0.994)TCGA-C5-A7XC-01Cervixcervical & endocervical cancerFemale<65I/IIUnknownUnknownSD
PACS1SNVMissense_Mutationc.725C>Gp.Ser242Cysp.S242CQ6VY07protein_codingdeleterious(0)possibly_damaging(0.707)TCGA-EK-A2RC-01Cervixcervical & endocervical cancerFemale<65I/IIUnknownUnknownSD
Page: 1 2 3 4 5 6 7 8 9 10 

Top

Related drugs of malignant transformation related genes

check buttonIdentification of chemicals and drugs interact with genes involved in malignant transfromation
(DGIdb 4.0)
Entrez IDSymbolCategoryInteraction TypesDrug Claim NameDrug NamePMIDs
Page: 1