
|
|||||
|
 | |
| |
| |
| |
| |
| |
|
Gene: OTUD6B |
Gene summary for OTUD6B |
| Gene information | Species | Human | Gene symbol | OTUD6B | Gene ID | 51633 |
| Gene name | OTU deubiquitinase 6B | |
| Gene Alias | CGI-77 | |
| Cytomap | 8q21.3 | |
| Gene Type | protein-coding | GO ID | GO:0006464 | UniProtAcc | Q8N6M0 |
Top |
Malignant transformation analysis |
| Identification of the aberrant gene expression in precancerous and cancerous lesions by comparing the gene expression of stem-like cells in diseased tissues with normal stem cells |
| Entrez ID | Symbol | Replicates | Species | Organ | Tissue | Adj P-value | Log2FC | Malignancy |
| 51633 | OTUD6B | P82T-E | Human | Esophagus | ESCC | 1.22e-02 | 1.70e-01 | 0.1072 |
| 51633 | OTUD6B | P83T-E | Human | Esophagus | ESCC | 1.53e-07 | 2.70e-01 | 0.1738 |
| 51633 | OTUD6B | P91T-E | Human | Esophagus | ESCC | 1.75e-07 | 5.82e-01 | 0.1828 |
| 51633 | OTUD6B | P107T-E | Human | Esophagus | ESCC | 6.01e-12 | 2.03e-01 | 0.171 |
| 51633 | OTUD6B | P128T-E | Human | Esophagus | ESCC | 3.75e-26 | 6.64e-01 | 0.1241 |
| 51633 | OTUD6B | P130T-E | Human | Esophagus | ESCC | 1.21e-13 | 2.99e-01 | 0.1676 |
| 51633 | OTUD6B | HCC1_Meng | Human | Liver | HCC | 6.48e-58 | 8.99e-02 | 0.0246 |
| 51633 | OTUD6B | HCC2_Meng | Human | Liver | HCC | 6.90e-06 | 5.67e-02 | 0.0107 |
| 51633 | OTUD6B | HCC2 | Human | Liver | HCC | 6.25e-08 | 3.72e+00 | 0.5341 |
| 51633 | OTUD6B | Pt13.b | Human | Liver | HCC | 1.29e-02 | 2.51e-02 | 0.0251 |
| 51633 | OTUD6B | Pt14.a | Human | Liver | HCC | 5.77e-03 | 2.73e-01 | 0.0169 |
| 51633 | OTUD6B | S014 | Human | Liver | HCC | 1.30e-08 | 3.76e-01 | 0.2254 |
| 51633 | OTUD6B | S015 | Human | Liver | HCC | 7.93e-12 | 6.66e-01 | 0.2375 |
| 51633 | OTUD6B | S016 | Human | Liver | HCC | 9.35e-10 | 4.14e-01 | 0.2243 |
| 51633 | OTUD6B | S027 | Human | Liver | HCC | 9.51e-06 | 5.20e-01 | 0.2446 |
| 51633 | OTUD6B | S028 | Human | Liver | HCC | 4.82e-13 | 6.39e-01 | 0.2503 |
| 51633 | OTUD6B | S029 | Human | Liver | HCC | 9.28e-10 | 5.88e-01 | 0.2581 |
| 51633 | OTUD6B | C04 | Human | Oral cavity | OSCC | 5.49e-04 | 4.40e-01 | 0.2633 |
| 51633 | OTUD6B | C21 | Human | Oral cavity | OSCC | 2.66e-12 | 4.23e-01 | 0.2678 |
| 51633 | OTUD6B | C30 | Human | Oral cavity | OSCC | 3.38e-08 | 6.00e-01 | 0.3055 |
| Page: 1 2 3 4 |
| Tissue | Expression Dynamics | Abbreviation |
| Esophagus | 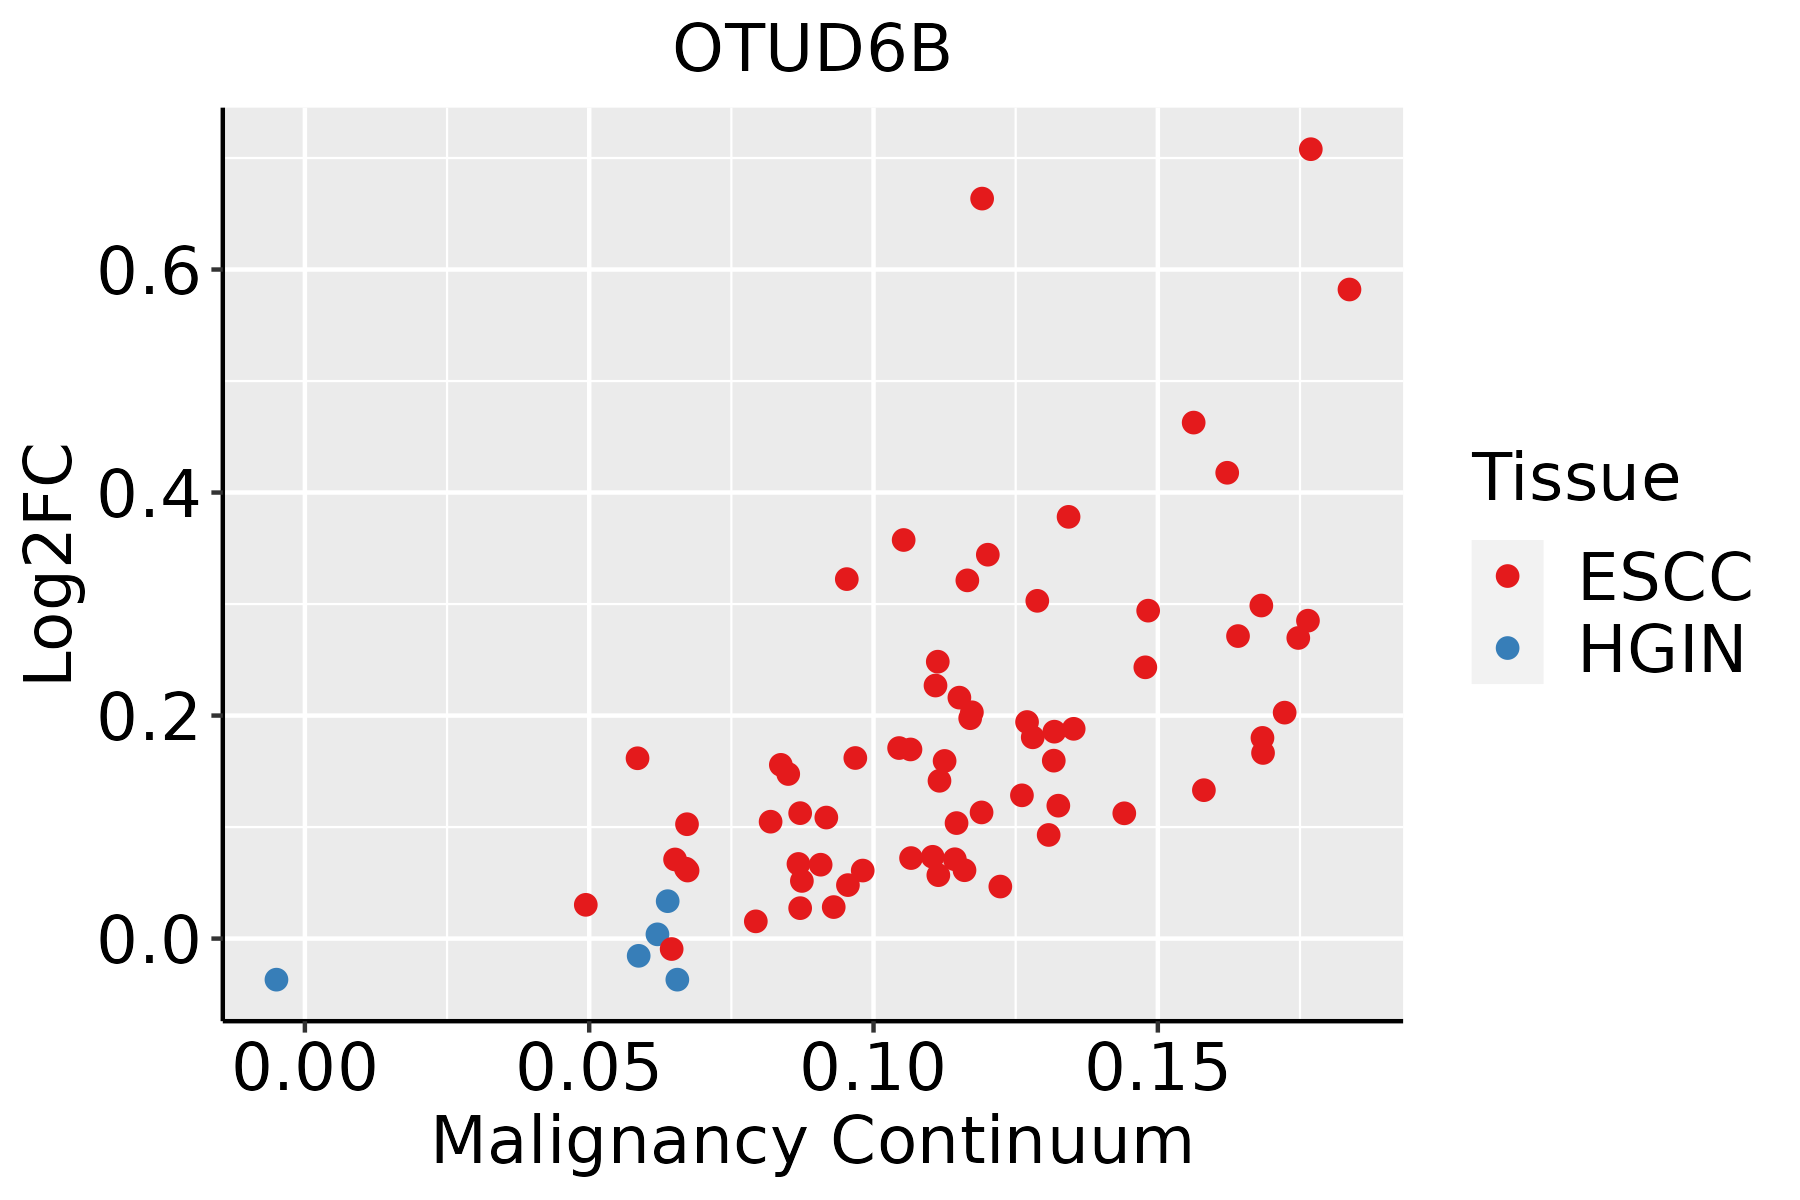 | ESCC: Esophageal squamous cell carcinoma |
| HGIN: High-grade intraepithelial neoplasias | ||
| LGIN: Low-grade intraepithelial neoplasias | ||
| Liver | 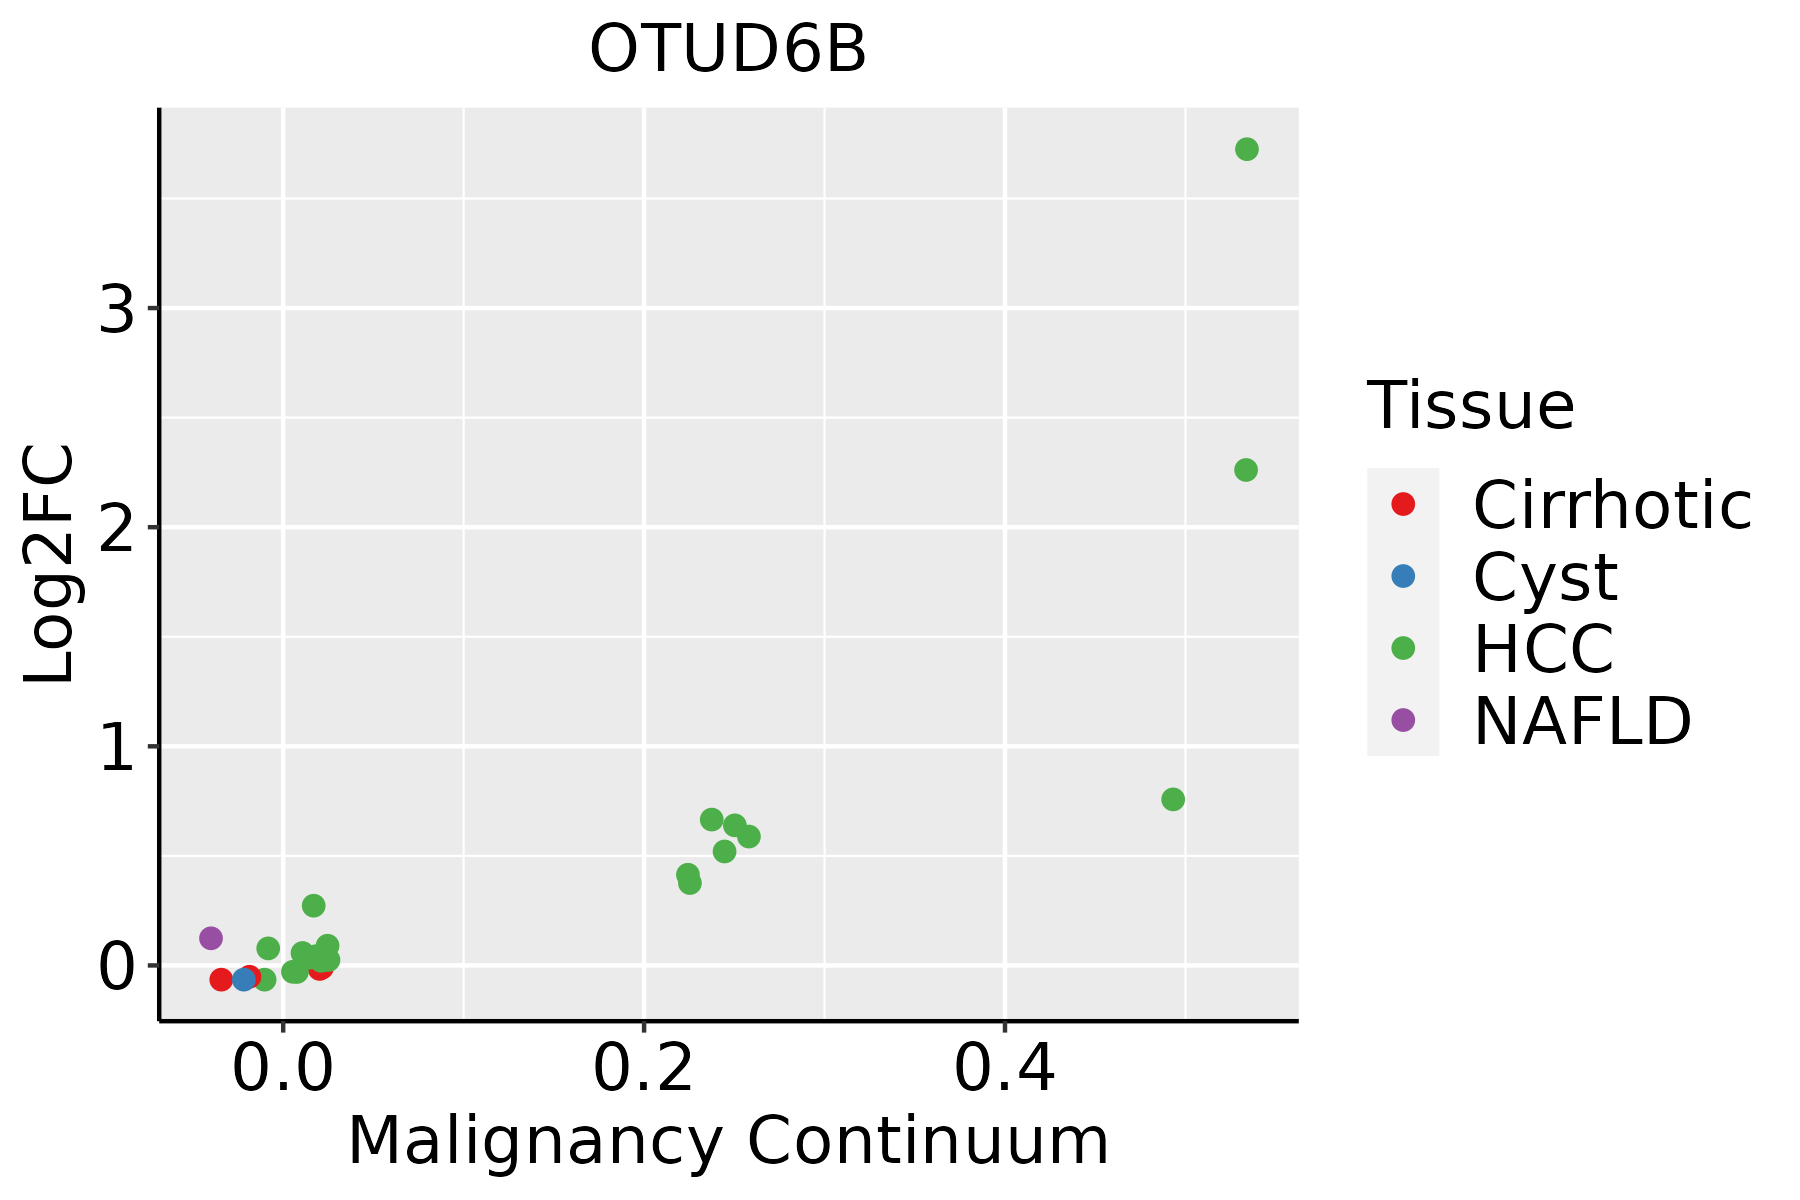 | HCC: Hepatocellular carcinoma |
| NAFLD: Non-alcoholic fatty liver disease | ||
| Oral Cavity |  | EOLP: Erosive Oral lichen planus |
| LP: leukoplakia | ||
| NEOLP: Non-erosive oral lichen planus | ||
| OSCC: Oral squamous cell carcinoma |
| ∗log2FC in expression of this searched gene in stem-like cells from each diseased tissue sample relative to stem-like cells in normal samples in each tissue plotted against the malignancy continuum. Samples are colored based on if they are from different disease stage. |
Top |
Malignant transformation related pathway analysis |
| Find out the enriched GO biological processes and KEGG pathways involved in transition from healthy to precancer to cancer |
| Tissue | Disease Stage | Enriched GO biological Processes |
| Colorectum | AD |  |
| Colorectum | SER |  |
| Colorectum | MSS |  |
| Colorectum | MSI-H |  |
| Colorectum | FAP |  |
| ∗Top 15 enriched GO BP terms are showed in the bar plot of each disease state in each tissue. Each row represents a significant GO biological process which is colored according to the -log10(p.adjust). |
| Page: 1 2 3 4 5 6 7 8 9 |
| GO ID | Tissue | Disease Stage | Description | Gene Ratio | Bg Ratio | pvalue | p.adjust | Count |
| GO:007064612 | Esophagus | ESCC | protein modification by small protein removal | 95/8552 | 157/18723 | 1.25e-04 | 8.56e-04 | 95 |
| GO:004324811 | Esophagus | ESCC | proteasome assembly | 11/8552 | 12/18723 | 1.26e-03 | 6.06e-03 | 11 |
| GO:00165793 | Esophagus | ESCC | protein deubiquitination | 79/8552 | 139/18723 | 5.23e-03 | 1.97e-02 | 79 |
| GO:00432481 | Liver | HCC | proteasome assembly | 12/7958 | 12/18723 | 3.46e-05 | 3.45e-04 | 12 |
| GO:00706461 | Liver | HCC | protein modification by small protein removal | 91/7958 | 157/18723 | 6.50e-05 | 5.92e-04 | 91 |
| GO:00165791 | Liver | HCC | protein deubiquitination | 78/7958 | 139/18723 | 8.13e-04 | 4.87e-03 | 78 |
| GO:00432482 | Oral cavity | OSCC | proteasome assembly | 11/7305 | 12/18723 | 2.45e-04 | 1.57e-03 | 11 |
| GO:00706462 | Oral cavity | OSCC | protein modification by small protein removal | 77/7305 | 157/18723 | 6.55e-03 | 2.43e-02 | 77 |
| Page: 1 |
| Pathway ID | Tissue | Disease Stage | Description | Gene Ratio | Bg Ratio | pvalue | p.adjust | qvalue | Count |
| Page: 1 |
Top |
Cell-cell communication analysis |
| Identification of potential cell-cell interactions between two cell types and their ligand-receptor pairs for different disease states |
| Ligand | Receptor | LRpair | Pathway | Tissue | Disease Stage |
| Page: 1 |
Top |
Single-cell gene regulatory network inference analysis |
| Find out the significant the regulons (TFs) and the target genes of each regulon across cell types for different disease states |
| TF | Cell Type | Tissue | Disease Stage | Target Gene | RSS | Regulon Activity |
| ∗The dot plots of a searched regulon are shown for all cell subpopulations in each disease state of each tissue based on the regulon specific score inferred using pySCENIC and by calculating the average expression. |
| Page: 1 |
Top |
Somatic mutation of malignant transformation related genes |
| Annotation of somatic variants for genes involved in malignant transformation |
| Hugo Symbol | Variant Class | Variant Classification | dbSNP RS | HGVSc | HGVSp | HGVSp Short | SWISSPROT | BIOTYPE | SIFT | PolyPhen | Tumor Sample Barcode | Tissue | Histology | Sex | Age | Stage | Therapy Types | Drugs | Outcome |
| OTUD6B | SNV | Missense_Mutation | novel | c.14N>G | p.Val5Gly | p.V5G | protein_coding | deleterious_low_confidence(0) | possibly_damaging(0.603) | TCGA-C8-A273-01 | Breast | breast invasive carcinoma | Female | <65 | I/II | Hormone Therapy | tamoxiphen | SD | |
| OTUD6B | SNV | Missense_Mutation | c.37N>T | p.Pro13Ser | p.P13S | protein_coding | tolerated_low_confidence(0.54) | benign(0) | TCGA-E9-A1NC-01 | Breast | breast invasive carcinoma | Female | <65 | I/II | Chemotherapy | doxorubicin | CR | ||
| OTUD6B | insertion | Frame_Shift_Ins | novel | c.854_855insAAATGGACTGCTT | p.Glu286AsnfsTer5 | p.E286Nfs*5 | protein_coding | TCGA-B6-A0IN-01 | Breast | breast invasive carcinoma | Female | <65 | I/II | Unknown | Unknown | PD | |||
| OTUD6B | SNV | Missense_Mutation | novel | c.662N>C | p.Val221Ala | p.V221A | protein_coding | tolerated(0.4) | benign(0) | TCGA-AA-3947-01 | Colorectum | colon adenocarcinoma | Female | <65 | I/II | Unknown | Unknown | SD | |
| OTUD6B | SNV | Missense_Mutation | rs539885905 | c.708N>A | p.Met236Ile | p.M236I | protein_coding | tolerated(0.26) | benign(0.005) | TCGA-AD-6964-01 | Colorectum | colon adenocarcinoma | Male | <65 | III/IV | Chemotherapy | folfox | PD | |
| OTUD6B | SNV | Missense_Mutation | c.68N>A | p.Arg23His | p.R23H | protein_coding | tolerated_low_confidence(0.67) | benign(0.001) | TCGA-AZ-6601-01 | Colorectum | colon adenocarcinoma | Male | >=65 | I/II | Unknown | Unknown | PD | ||
| OTUD6B | SNV | Missense_Mutation | novel | c.543N>T | p.Gln181His | p.Q181H | protein_coding | tolerated(0.08) | benign(0.007) | TCGA-CA-6717-01 | Colorectum | colon adenocarcinoma | Male | <65 | I/II | Chemotherapy | oxaliplatin | CR | |
| OTUD6B | SNV | Missense_Mutation | c.88N>C | p.Val30Leu | p.V30L | protein_coding | tolerated_low_confidence(0.06) | benign(0.053) | TCGA-F5-6813-01 | Colorectum | rectum adenocarcinoma | Male | >=65 | III/IV | Unknown | Unknown | PD | ||
| OTUD6B | SNV | Missense_Mutation | c.929N>T | p.Ser310Leu | p.S310L | protein_coding | deleterious(0) | probably_damaging(0.995) | TCGA-F5-6814-01 | Colorectum | rectum adenocarcinoma | Male | <65 | I/II | Unknown | Unknown | SD | ||
| OTUD6B | deletion | Frame_Shift_Del | rs762934606 | c.867delN | p.Lys291AsnfsTer3 | p.K291Nfs*3 | protein_coding | TCGA-AA-3833-01 | Colorectum | colon adenocarcinoma | Female | <65 | I/II | Unknown | Unknown | SD |
| Page: 1 2 3 4 |
Top |
Related drugs of malignant transformation related genes |
| Identification of chemicals and drugs interact with genes involved in malignant transfromation |
| (DGIdb 4.0) |
| Entrez ID | Symbol | Category | Interaction Types | Drug Claim Name | Drug Name | PMIDs |
| Page: 1 |

Copyright 2023-Present -The University of Texas Health Science Center at Houston |