
|
|||||
|
 | |
| |
| |
| |
| |
| |
|
Gene: OPLAH |
Gene summary for OPLAH |
| Gene information | Species | Human | Gene symbol | OPLAH | Gene ID | 26873 |
| Gene name | 5-oxoprolinase, ATP-hydrolysing | |
| Gene Alias | 5-Opase | |
| Cytomap | 8q24.3 | |
| Gene Type | protein-coding | GO ID | GO:0006518 | UniProtAcc | O14841 |
Top |
Malignant transformation analysis |
| Identification of the aberrant gene expression in precancerous and cancerous lesions by comparing the gene expression of stem-like cells in diseased tissues with normal stem cells |
| Entrez ID | Symbol | Replicates | Species | Organ | Tissue | Adj P-value | Log2FC | Malignancy |
| 26873 | OPLAH | HCC2_Meng | Human | Liver | HCC | 2.74e-03 | 4.36e-02 | 0.0107 |
| 26873 | OPLAH | HCC2 | Human | Liver | HCC | 2.82e-15 | 4.12e+00 | 0.5341 |
| 26873 | OPLAH | S014 | Human | Liver | HCC | 8.20e-09 | 4.33e-01 | 0.2254 |
| 26873 | OPLAH | S015 | Human | Liver | HCC | 2.42e-02 | 3.69e-01 | 0.2375 |
| 26873 | OPLAH | S016 | Human | Liver | HCC | 1.20e-11 | 4.94e-01 | 0.2243 |
| 26873 | OPLAH | S027 | Human | Liver | HCC | 2.19e-12 | 1.06e+00 | 0.2446 |
| 26873 | OPLAH | S028 | Human | Liver | HCC | 1.92e-23 | 9.43e-01 | 0.2503 |
| 26873 | OPLAH | S029 | Human | Liver | HCC | 5.27e-22 | 1.08e+00 | 0.2581 |
| Page: 1 2 3 |
| Tissue | Expression Dynamics | Abbreviation |
| Esophagus |  | ESCC: Esophageal squamous cell carcinoma |
| HGIN: High-grade intraepithelial neoplasias | ||
| LGIN: Low-grade intraepithelial neoplasias | ||
| Liver | 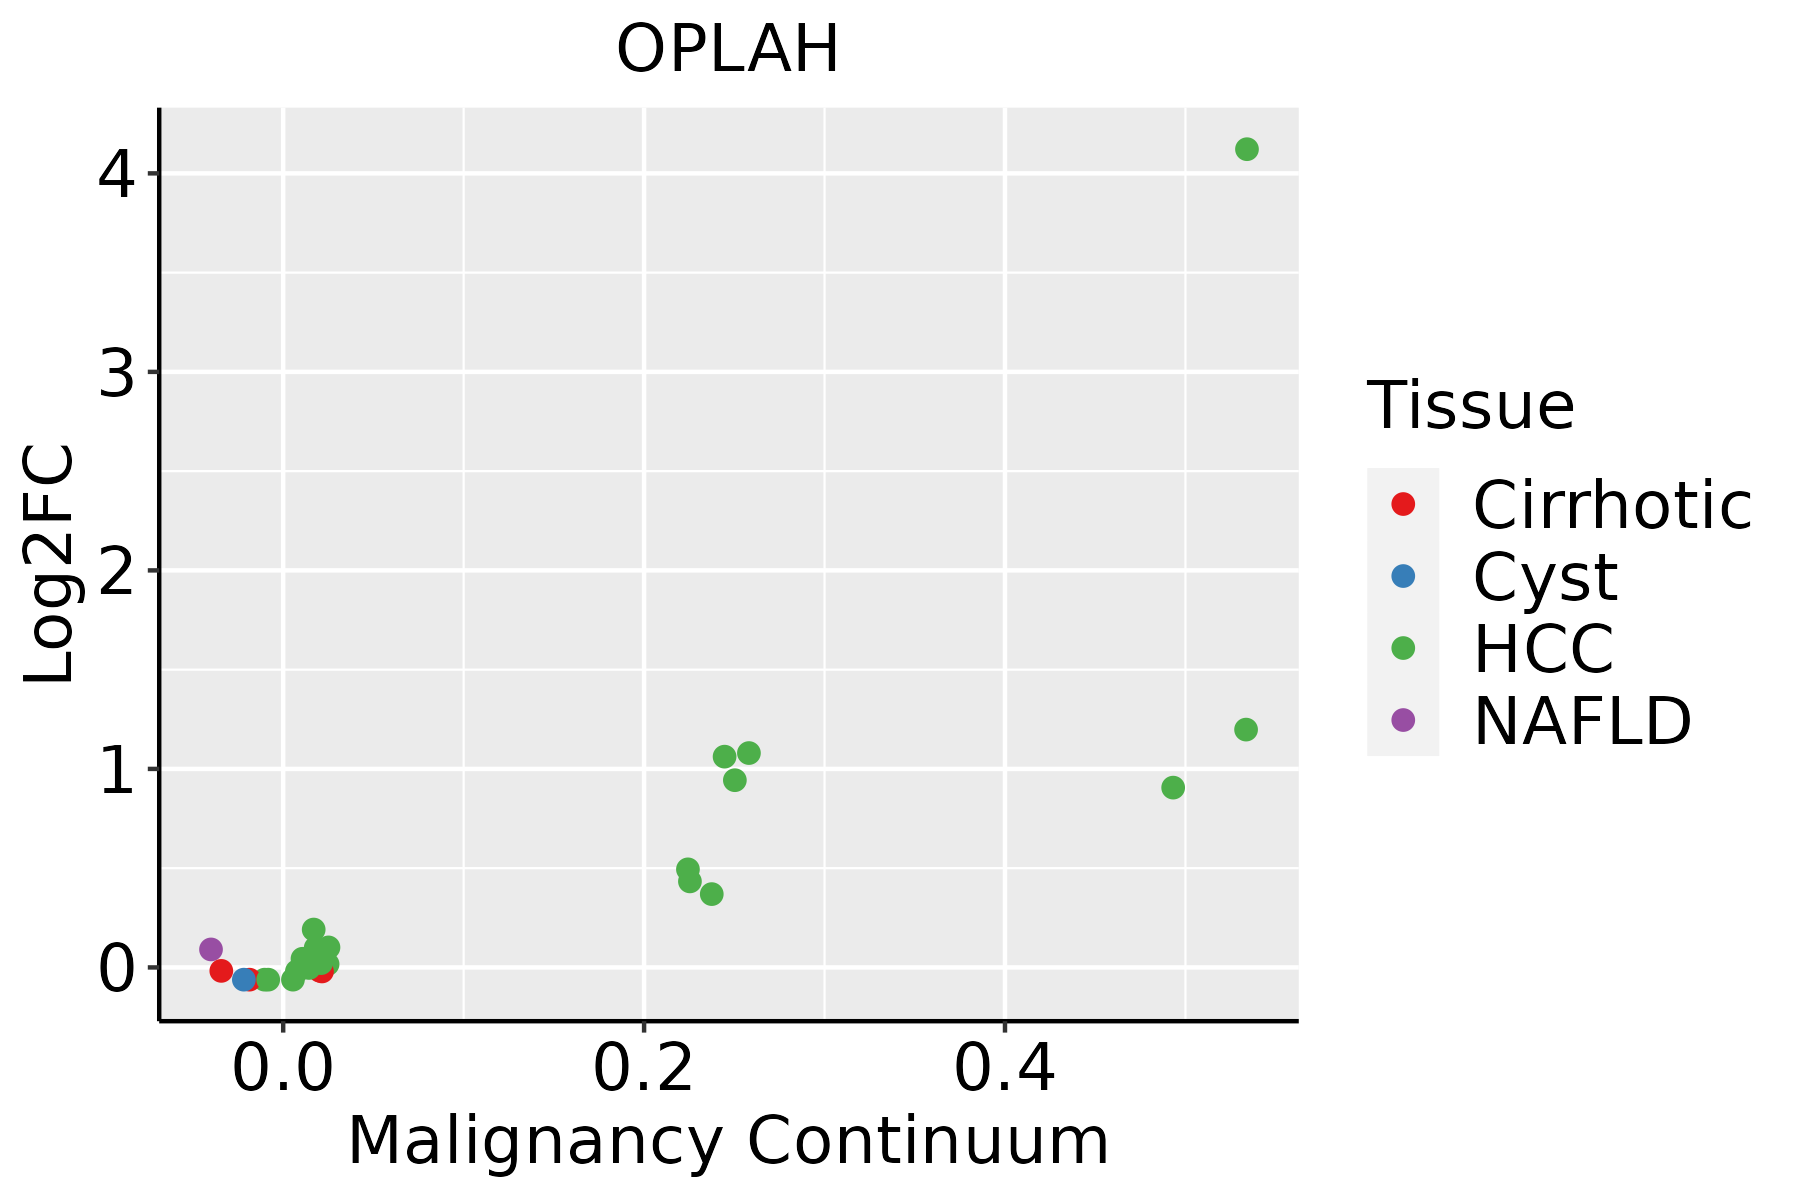 | HCC: Hepatocellular carcinoma |
| NAFLD: Non-alcoholic fatty liver disease |
| ∗log2FC in expression of this searched gene in stem-like cells from each diseased tissue sample relative to stem-like cells in normal samples in each tissue plotted against the malignancy continuum. Samples are colored based on if they are from different disease stage. |
Top |
Malignant transformation related pathway analysis |
| Find out the enriched GO biological processes and KEGG pathways involved in transition from healthy to precancer to cancer |
| Tissue | Disease Stage | Enriched GO biological Processes |
| Colorectum | AD |  |
| Colorectum | SER |  |
| Colorectum | MSS |  |
| Colorectum | MSI-H |  |
| Colorectum | FAP |  |
| ∗Top 15 enriched GO BP terms are showed in the bar plot of each disease state in each tissue. Each row represents a significant GO biological process which is colored according to the -log10(p.adjust). |
| Page: 1 2 3 4 5 6 7 8 9 |
| GO ID | Tissue | Disease Stage | Description | Gene Ratio | Bg Ratio | pvalue | p.adjust | Count |
| GO:00067906 | Esophagus | ESCC | sulfur compound metabolic process | 201/8552 | 339/18723 | 2.64e-07 | 3.94e-06 | 201 |
| GO:00065757 | Esophagus | ESCC | cellular modified amino acid metabolic process | 112/8552 | 188/18723 | 8.31e-05 | 6.06e-04 | 112 |
| GO:000674912 | Esophagus | ESCC | glutathione metabolic process | 42/8552 | 64/18723 | 1.01e-03 | 5.12e-03 | 42 |
| GO:000679021 | Liver | HCC | sulfur compound metabolic process | 212/7958 | 339/18723 | 5.60e-14 | 3.39e-12 | 212 |
| GO:000657521 | Liver | HCC | cellular modified amino acid metabolic process | 119/7958 | 188/18723 | 6.47e-09 | 1.67e-07 | 119 |
| GO:000674911 | Liver | HCC | glutathione metabolic process | 44/7958 | 64/18723 | 1.95e-05 | 2.09e-04 | 44 |
| Page: 1 |
| Pathway ID | Tissue | Disease Stage | Description | Gene Ratio | Bg Ratio | pvalue | p.adjust | qvalue | Count |
| hsa0048018 | Esophagus | ESCC | Glutathione metabolism | 44/4205 | 57/8465 | 1.81e-05 | 9.03e-05 | 4.63e-05 | 44 |
| hsa0048019 | Esophagus | ESCC | Glutathione metabolism | 44/4205 | 57/8465 | 1.81e-05 | 9.03e-05 | 4.63e-05 | 44 |
| hsa0048022 | Liver | HCC | Glutathione metabolism | 42/4020 | 57/8465 | 5.00e-05 | 2.62e-04 | 1.46e-04 | 42 |
| hsa0048032 | Liver | HCC | Glutathione metabolism | 42/4020 | 57/8465 | 5.00e-05 | 2.62e-04 | 1.46e-04 | 42 |
| Page: 1 |
Top |
Cell-cell communication analysis |
| Identification of potential cell-cell interactions between two cell types and their ligand-receptor pairs for different disease states |
| Ligand | Receptor | LRpair | Pathway | Tissue | Disease Stage |
| Page: 1 |
Top |
Single-cell gene regulatory network inference analysis |
| Find out the significant the regulons (TFs) and the target genes of each regulon across cell types for different disease states |
| TF | Cell Type | Tissue | Disease Stage | Target Gene | RSS | Regulon Activity |
| ∗The dot plots of a searched regulon are shown for all cell subpopulations in each disease state of each tissue based on the regulon specific score inferred using pySCENIC and by calculating the average expression. |
| Page: 1 |
Top |
Somatic mutation of malignant transformation related genes |
| Annotation of somatic variants for genes involved in malignant transformation |
| Hugo Symbol | Variant Class | Variant Classification | dbSNP RS | HGVSc | HGVSp | HGVSp Short | SWISSPROT | BIOTYPE | SIFT | PolyPhen | Tumor Sample Barcode | Tissue | Histology | Sex | Age | Stage | Therapy Types | Drugs | Outcome |
| OPLAH | SNV | Missense_Mutation | novel | c.3053N>G | p.Pro1018Arg | p.P1018R | O14841 | protein_coding | tolerated(0.08) | benign(0.297) | TCGA-A2-A0YT-01 | Breast | breast invasive carcinoma | Female | <65 | III/IV | Hormone Therapy | arimidex | SD |
| OPLAH | SNV | Missense_Mutation | rs372767256 | c.2265C>G | p.Ile755Met | p.I755M | O14841 | protein_coding | tolerated(0.07) | possibly_damaging(0.878) | TCGA-BH-A18V-01 | Breast | breast invasive carcinoma | Female | <65 | I/II | Unknown | Unknown | SD |
| OPLAH | SNV | Missense_Mutation | novel | c.3046N>T | p.Thr1016Ser | p.T1016S | O14841 | protein_coding | tolerated(0.17) | benign(0.018) | TCGA-C8-A275-01 | Breast | breast invasive carcinoma | Female | <65 | I/II | Unknown | Unknown | SD |
| OPLAH | deletion | Frame_Shift_Del | novel | c.2001delT | p.Phe667LeufsTer45 | p.F667Lfs*45 | O14841 | protein_coding | TCGA-EW-A2FV-01 | Breast | breast invasive carcinoma | Female | <65 | III/IV | Chemotherapy | docetaxel | SD | ||
| OPLAH | SNV | Missense_Mutation | novel | c.3479N>A | p.Arg1160His | p.R1160H | O14841 | protein_coding | tolerated(0.27) | possibly_damaging(0.836) | TCGA-C5-A1MF-01 | Cervix | cervical & endocervical cancer | Female | <65 | I/II | Unknown | Unknown | SD |
| OPLAH | SNV | Missense_Mutation | novel | c.974A>C | p.Tyr325Ser | p.Y325S | O14841 | protein_coding | deleterious(0) | probably_damaging(0.969) | TCGA-C5-A901-01 | Cervix | cervical & endocervical cancer | Female | <65 | I/II | Unknown | Unknown | SD |
| OPLAH | SNV | Missense_Mutation | novel | c.217N>T | p.His73Tyr | p.H73Y | O14841 | protein_coding | tolerated(0.3) | benign(0) | TCGA-EK-A3GK-01 | Cervix | cervical & endocervical cancer | Female | <65 | I/II | Unknown | Unknown | SD |
| OPLAH | SNV | Missense_Mutation | novel | c.1493N>T | p.Ala498Val | p.A498V | O14841 | protein_coding | deleterious(0) | possibly_damaging(0.602) | TCGA-A6-3809-01 | Colorectum | colon adenocarcinoma | Female | >=65 | I/II | Unknown | Unknown | SD |
| OPLAH | SNV | Missense_Mutation | novel | c.3419N>C | p.Met1140Thr | p.M1140T | O14841 | protein_coding | deleterious(0.04) | probably_damaging(0.999) | TCGA-A6-6780-01 | Colorectum | colon adenocarcinoma | Male | >=65 | I/II | Unknown | Unknown | SD |
| OPLAH | SNV | Missense_Mutation | novel | c.934N>A | p.Gly312Ser | p.G312S | O14841 | protein_coding | deleterious(0.01) | probably_damaging(1) | TCGA-AA-3713-01 | Colorectum | colon adenocarcinoma | Male | >=65 | III/IV | Chemotherapy | 5-fluorouracil | PR |
| Page: 1 2 3 4 5 6 7 8 9 10 11 |
Top |
Related drugs of malignant transformation related genes |
| Identification of chemicals and drugs interact with genes involved in malignant transfromation |
| (DGIdb 4.0) |
| Entrez ID | Symbol | Category | Interaction Types | Drug Claim Name | Drug Name | PMIDs |
| 26873 | OPLAH | ENZYME | MELPHALAN | MELPHALAN | 9751079 |
| Page: 1 |

Copyright 2023-Present -The University of Texas Health Science Center at Houston |