
|
|||||
|
 | |
| |
| |
| |
| |
| |
|
Gene: NXPH4 |
Gene summary for NXPH4 |
| Gene information | Species | Human | Gene symbol | NXPH4 | Gene ID | 11247 |
| Gene name | neurexophilin 4 | |
| Gene Alias | NPH4 | |
| Cytomap | 12q13.3 | |
| Gene Type | protein-coding | GO ID | GO:0007154 | UniProtAcc | O95158 |
Top |
Malignant transformation analysis |
| Identification of the aberrant gene expression in precancerous and cancerous lesions by comparing the gene expression of stem-like cells in diseased tissues with normal stem cells |
| Entrez ID | Symbol | Replicates | Species | Organ | Tissue | Adj P-value | Log2FC | Malignancy |
| 11247 | NXPH4 | P65T-E | Human | Esophagus | ESCC | 3.37e-05 | 1.41e-01 | 0.0978 |
| 11247 | NXPH4 | P74T-E | Human | Esophagus | ESCC | 2.49e-26 | 6.13e-01 | 0.1479 |
| 11247 | NXPH4 | P76T-E | Human | Esophagus | ESCC | 1.96e-05 | 1.96e-01 | 0.1207 |
| 11247 | NXPH4 | P79T-E | Human | Esophagus | ESCC | 2.56e-16 | 3.97e-01 | 0.1154 |
| 11247 | NXPH4 | P80T-E | Human | Esophagus | ESCC | 1.59e-12 | 4.55e-01 | 0.155 |
| 11247 | NXPH4 | P83T-E | Human | Esophagus | ESCC | 4.97e-05 | 1.76e-01 | 0.1738 |
| 11247 | NXPH4 | P89T-E | Human | Esophagus | ESCC | 3.05e-17 | 6.34e-01 | 0.1752 |
| 11247 | NXPH4 | P91T-E | Human | Esophagus | ESCC | 2.10e-19 | 1.11e+00 | 0.1828 |
| 11247 | NXPH4 | P107T-E | Human | Esophagus | ESCC | 4.56e-28 | 7.40e-01 | 0.171 |
| 11247 | NXPH4 | P128T-E | Human | Esophagus | ESCC | 1.28e-34 | 1.19e+00 | 0.1241 |
| 11247 | NXPH4 | P130T-E | Human | Esophagus | ESCC | 1.77e-86 | 1.70e+00 | 0.1676 |
| 11247 | NXPH4 | C04 | Human | Oral cavity | OSCC | 9.05e-06 | 3.77e-01 | 0.2633 |
| 11247 | NXPH4 | C21 | Human | Oral cavity | OSCC | 8.82e-15 | 5.05e-01 | 0.2678 |
| 11247 | NXPH4 | C30 | Human | Oral cavity | OSCC | 1.58e-24 | 9.94e-01 | 0.3055 |
| 11247 | NXPH4 | C38 | Human | Oral cavity | OSCC | 1.12e-07 | 8.91e-01 | 0.172 |
| 11247 | NXPH4 | C43 | Human | Oral cavity | OSCC | 3.16e-55 | 1.01e+00 | 0.1704 |
| 11247 | NXPH4 | C51 | Human | Oral cavity | OSCC | 7.08e-13 | 7.19e-01 | 0.2674 |
| 11247 | NXPH4 | C57 | Human | Oral cavity | OSCC | 2.26e-05 | 3.00e-01 | 0.1679 |
| 11247 | NXPH4 | C06 | Human | Oral cavity | OSCC | 2.82e-05 | 7.44e-01 | 0.2699 |
| 11247 | NXPH4 | C08 | Human | Oral cavity | OSCC | 9.07e-16 | 4.31e-01 | 0.1919 |
| Page: 1 2 3 4 |
| Tissue | Expression Dynamics | Abbreviation |
| Esophagus | 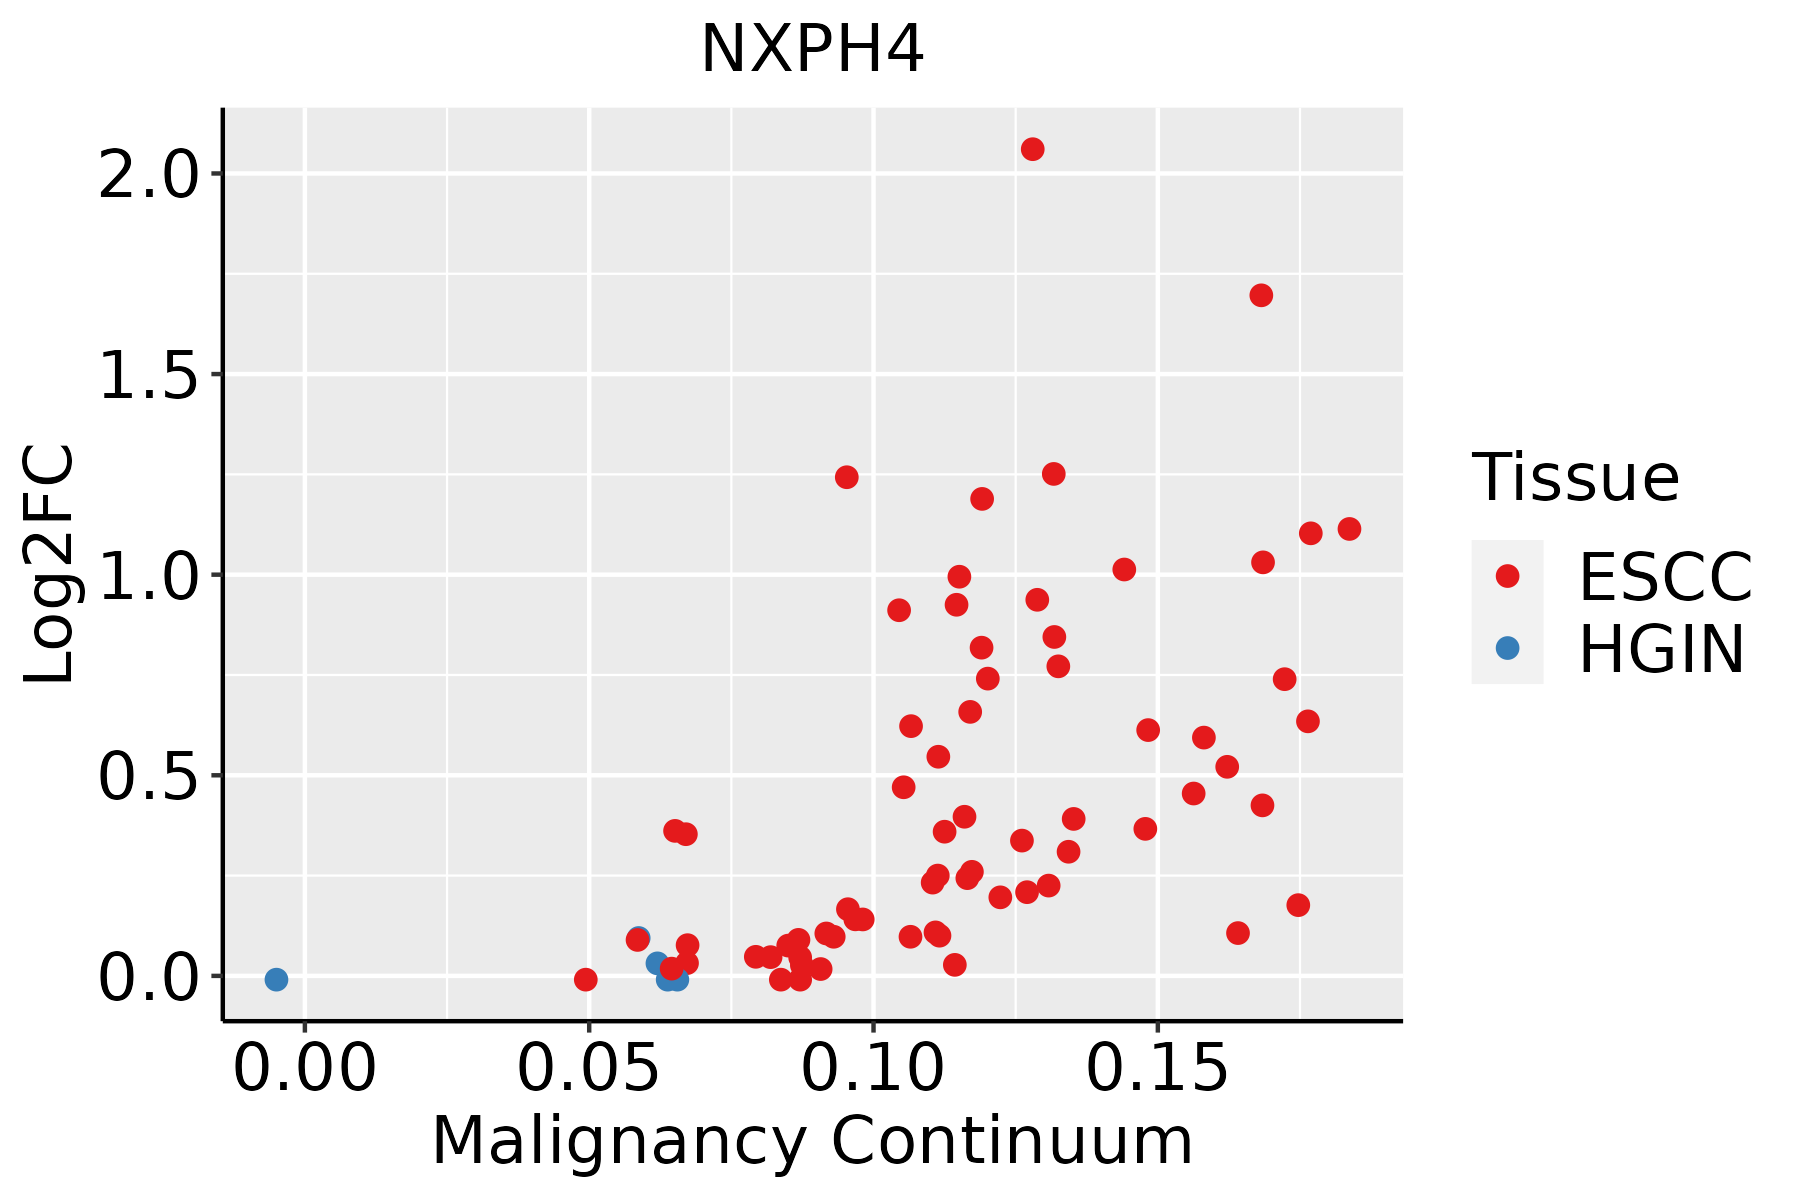 | ESCC: Esophageal squamous cell carcinoma |
| HGIN: High-grade intraepithelial neoplasias | ||
| LGIN: Low-grade intraepithelial neoplasias | ||
| Oral Cavity | 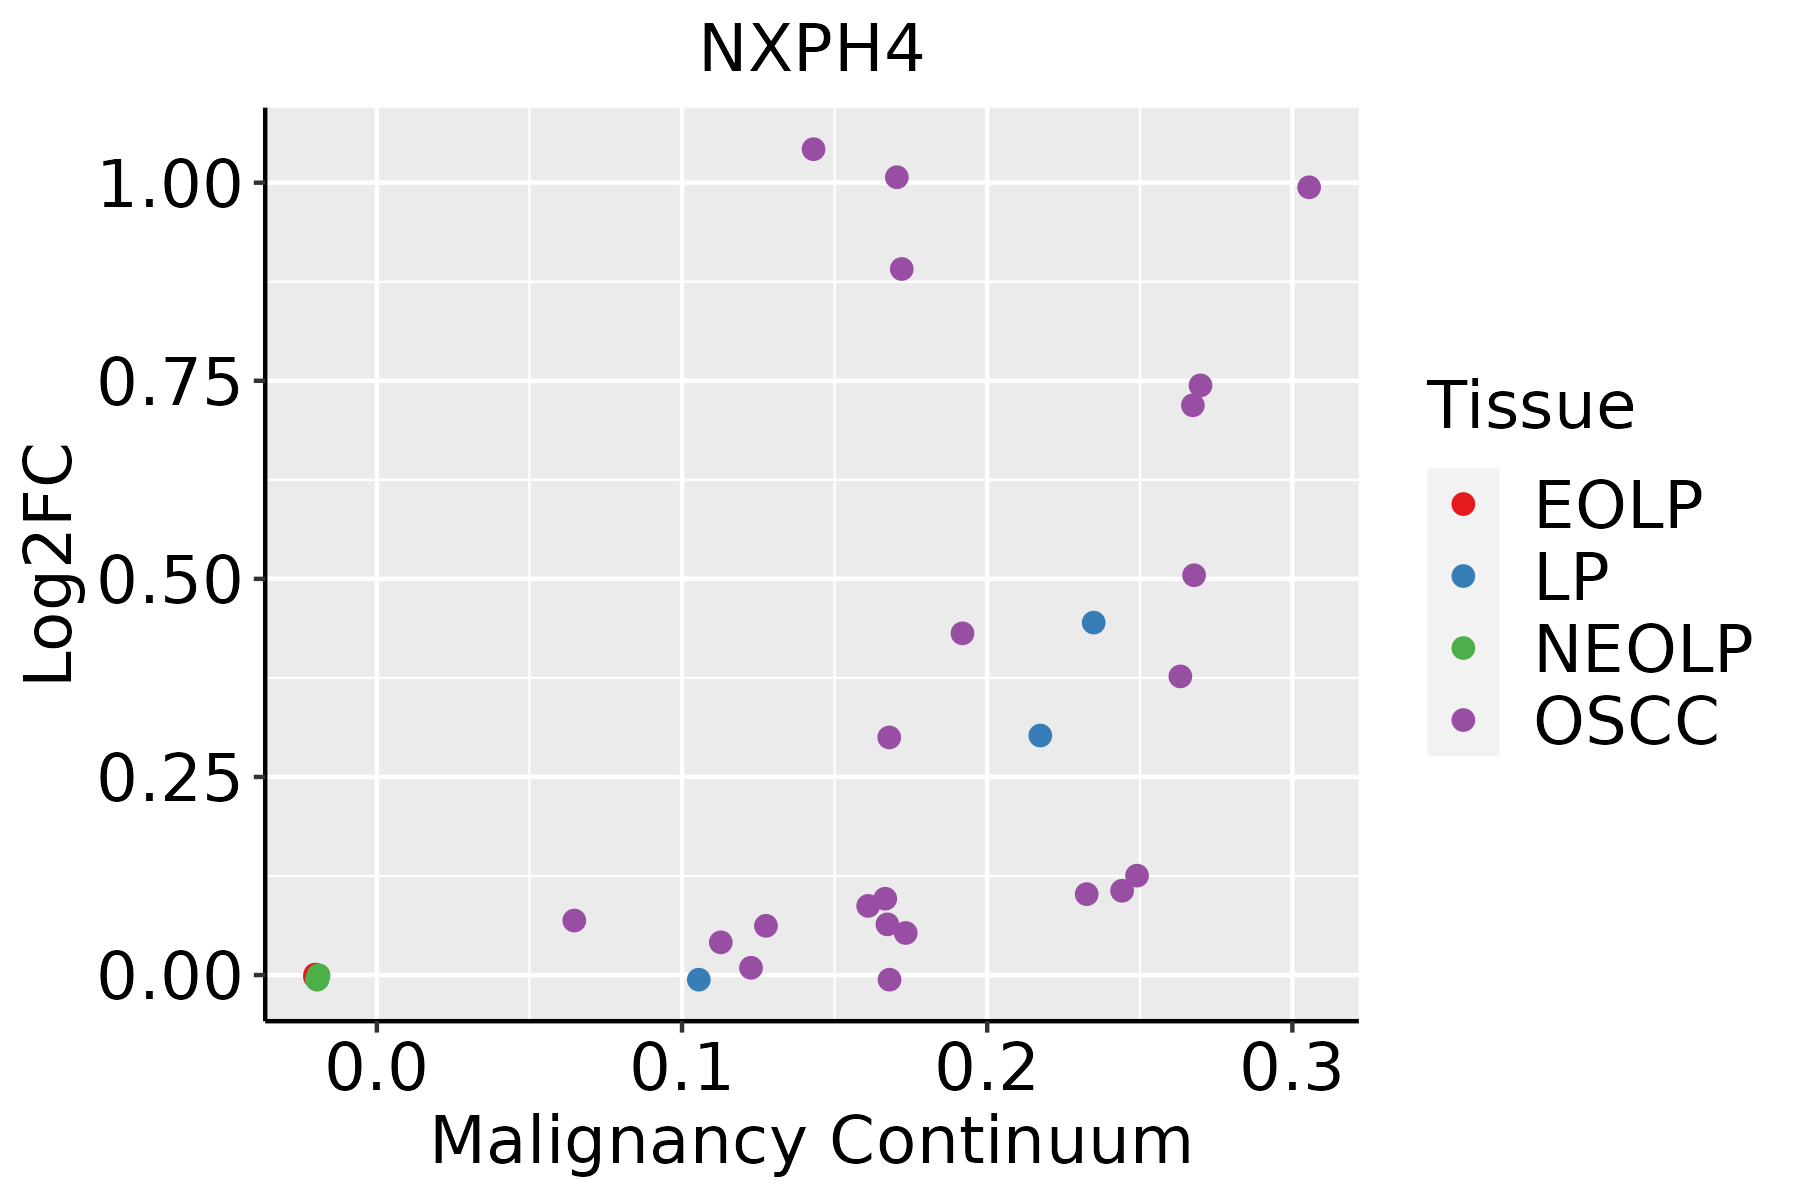 | EOLP: Erosive Oral lichen planus |
| LP: leukoplakia | ||
| NEOLP: Non-erosive oral lichen planus | ||
| OSCC: Oral squamous cell carcinoma | ||
| Thyroid |  | ATC: Anaplastic thyroid cancer |
| HT: Hashimoto's thyroiditis | ||
| PTC: Papillary thyroid cancer |
| ∗log2FC in expression of this searched gene in stem-like cells from each diseased tissue sample relative to stem-like cells in normal samples in each tissue plotted against the malignancy continuum. Samples are colored based on if they are from different disease stage. |
Top |
Malignant transformation related pathway analysis |
| Find out the enriched GO biological processes and KEGG pathways involved in transition from healthy to precancer to cancer |
| Tissue | Disease Stage | Enriched GO biological Processes |
| Colorectum | AD |  |
| Colorectum | SER |  |
| Colorectum | MSS |  |
| Colorectum | MSI-H |  |
| Colorectum | FAP |  |
| ∗Top 15 enriched GO BP terms are showed in the bar plot of each disease state in each tissue. Each row represents a significant GO biological process which is colored according to the -log10(p.adjust). |
| Page: 1 2 3 4 5 6 7 8 9 |
| GO ID | Tissue | Disease Stage | Description | Gene Ratio | Bg Ratio | pvalue | p.adjust | Count |
| Page: 1 |
| Pathway ID | Tissue | Disease Stage | Description | Gene Ratio | Bg Ratio | pvalue | p.adjust | qvalue | Count |
| Page: 1 |
Top |
Cell-cell communication analysis |
| Identification of potential cell-cell interactions between two cell types and their ligand-receptor pairs for different disease states |
| Ligand | Receptor | LRpair | Pathway | Tissue | Disease Stage |
| Page: 1 |
Top |
Single-cell gene regulatory network inference analysis |
| Find out the significant the regulons (TFs) and the target genes of each regulon across cell types for different disease states |
| TF | Cell Type | Tissue | Disease Stage | Target Gene | RSS | Regulon Activity |
| ∗The dot plots of a searched regulon are shown for all cell subpopulations in each disease state of each tissue based on the regulon specific score inferred using pySCENIC and by calculating the average expression. |
| Page: 1 |
Top |
Somatic mutation of malignant transformation related genes |
| Annotation of somatic variants for genes involved in malignant transformation |
| Hugo Symbol | Variant Class | Variant Classification | dbSNP RS | HGVSc | HGVSp | HGVSp Short | SWISSPROT | BIOTYPE | SIFT | PolyPhen | Tumor Sample Barcode | Tissue | Histology | Sex | Age | Stage | Therapy Types | Drugs | Outcome |
| NXPH4 | SNV | Missense_Mutation | novel | c.922N>A | p.Gly308Arg | p.G308R | O95158 | protein_coding | deleterious_low_confidence(0) | probably_damaging(1) | TCGA-2W-A8YY-01 | Cervix | cervical & endocervical cancer | Female | <65 | I/II | Chemotherapy | cisplatin | CR |
| NXPH4 | SNV | Missense_Mutation | novel | c.55N>G | p.Lys19Glu | p.K19E | O95158 | protein_coding | tolerated_low_confidence(0.28) | benign(0) | TCGA-AZ-4315-01 | Colorectum | colon adenocarcinoma | Male | <65 | I/II | Unknown | Unknown | SD |
| NXPH4 | SNV | Missense_Mutation | novel | c.415N>C | p.Tyr139His | p.Y139H | O95158 | protein_coding | tolerated(0.07) | benign(0.376) | TCGA-AJ-A3BH-01 | Endometrium | uterine corpus endometrioid carcinoma | Female | Unknown | I/II | Unknown | Unknown | SD |
| NXPH4 | SNV | Missense_Mutation | novel | c.884N>A | p.Cys295Tyr | p.C295Y | O95158 | protein_coding | deleterious(0) | probably_damaging(0.999) | TCGA-AP-A1DK-01 | Endometrium | uterine corpus endometrioid carcinoma | Female | <65 | I/II | Unknown | Unknown | SD |
| NXPH4 | SNV | Missense_Mutation | novel | c.439C>A | p.Leu147Met | p.L147M | O95158 | protein_coding | tolerated(0.07) | probably_damaging(0.985) | TCGA-AX-A2HA-01 | Endometrium | uterine corpus endometrioid carcinoma | Female | <65 | I/II | Unknown | Unknown | SD |
| NXPH4 | SNV | Missense_Mutation | novel | c.4N>T | p.Arg2Trp | p.R2W | O95158 | protein_coding | deleterious_low_confidence(0) | possibly_damaging(0.876) | TCGA-B5-A3FC-01 | Endometrium | uterine corpus endometrioid carcinoma | Female | <65 | I/II | Unknown | Unknown | SD |
| NXPH4 | SNV | Missense_Mutation | c.688G>A | p.Ala230Thr | p.A230T | O95158 | protein_coding | tolerated(0.59) | benign(0.005) | TCGA-BS-A0UV-01 | Endometrium | uterine corpus endometrioid carcinoma | Female | <65 | III/IV | Unknown | Unknown | SD | |
| NXPH4 | SNV | Missense_Mutation | c.724C>A | p.Arg242Ser | p.R242S | O95158 | protein_coding | deleterious(0) | probably_damaging(0.941) | TCGA-D1-A17S-01 | Endometrium | uterine corpus endometrioid carcinoma | Female | <65 | I/II | Unknown | Unknown | SD | |
| NXPH4 | SNV | Missense_Mutation | novel | c.536N>T | p.Thr179Met | p.T179M | O95158 | protein_coding | deleterious(0) | probably_damaging(0.912) | TCGA-DI-A1BU-01 | Endometrium | uterine corpus endometrioid carcinoma | Female | <65 | I/II | Chemotherapy | paclitaxel | SD |
| NXPH4 | SNV | Missense_Mutation | c.821N>C | p.Phe274Ser | p.F274S | O95158 | protein_coding | deleterious(0) | probably_damaging(0.996) | TCGA-DD-A4NV-01 | Liver | liver hepatocellular carcinoma | Male | <65 | III/IV | Unknown | Unknown | SD |
| Page: 1 2 |
Top |
Related drugs of malignant transformation related genes |
| Identification of chemicals and drugs interact with genes involved in malignant transfromation |
| (DGIdb 4.0) |
| Entrez ID | Symbol | Category | Interaction Types | Drug Claim Name | Drug Name | PMIDs |
| Page: 1 |

Copyright 2023-Present -The University of Texas Health Science Center at Houston |