Schematic overview of the cellular and molecular mechanisms involved in the cancer progression, including the proposed cellular and molecular mechanisms in cancer cells trajectory. AT1: alveolar type 1 cells; AT2: alveolar type 2 cells; AAH: atypical adenomatous hyperplasia; AIS: adenocarcinoma in situ; MIA: minimally invasive adenocarcinoma; IA: invasive adenocarcinoma; EMT: epithelial-mesenchymal transition

Home

Download

Statistics

Help

Contact

Center for Computational Systems Medicine
leaf

Gene summary

leaf

Malignant transformation analysis

leaf

Malignant transformation related pathway analysis

leaf

Cell-cell communication analysis

leaf

Single-cell gene regulatory network inference analysis

leaf

Somatic mutation of malignant transformation related genes

leaf

Related drugs of malignant transformation related genes

Gene: NOP14

Gene summary for NOP14

check button Gene summary.

Gene informationSpeciesHuman
Gene symbol

NOP14

Gene ID

8602

Gene nameNOP14 nucleolar protein
Gene AliasC4orf9
Cytomap4p16.3
Gene Typeprotein-coding
GO ID

GO:0000447

UniProtAcc

A8KA74


Top

Malignant transformation analysis

check button Identification of the aberrant gene expression in precancerous and cancerous lesions by comparing the gene expression of stem-like cells in diseased tissues with normal stem cells
check button Malignant transformation involving gene list.
Entrez IDSymbolReplicatesSpeciesOrganTissueAdj P-valueLog2FCMalignancy
8602NOP14P62T-EHumanEsophagusESCC5.28e-317.39e-010.1302
8602NOP14P65T-EHumanEsophagusESCC1.77e-142.02e-010.0978
8602NOP14P74T-EHumanEsophagusESCC4.08e-051.87e-010.1479
8602NOP14P75T-EHumanEsophagusESCC1.15e-175.00e-010.1125
8602NOP14P76T-EHumanEsophagusESCC7.58e-144.17e-010.1207
8602NOP14P79T-EHumanEsophagusESCC4.00e-153.10e-010.1154
8602NOP14P80T-EHumanEsophagusESCC6.76e-241.09e+000.155
8602NOP14P82T-EHumanEsophagusESCC2.49e-024.34e-010.1072
8602NOP14P83T-EHumanEsophagusESCC7.29e-207.57e-010.1738
8602NOP14P89T-EHumanEsophagusESCC4.19e-064.67e-010.1752
8602NOP14P107T-EHumanEsophagusESCC1.70e-471.29e+000.171
8602NOP14P126T-EHumanEsophagusESCC6.33e-045.12e-010.1125
8602NOP14P127T-EHumanEsophagusESCC1.94e-087.52e-020.0826
8602NOP14P128T-EHumanEsophagusESCC3.65e-281.06e+000.1241
8602NOP14P130T-EHumanEsophagusESCC4.66e-296.94e-010.1676
8602NOP14HCC1_MengHumanLiverHCC1.53e-451.19e-010.0246
8602NOP14HCC2_MengHumanLiverHCC9.15e-119.52e-020.0107
8602NOP14HCC1HumanLiverHCC1.11e-042.98e+000.5336
8602NOP14HCC2HumanLiverHCC4.60e-184.10e+000.5341
8602NOP14HCC5HumanLiverHCC1.53e-062.44e+000.4932
Page: 1 2 3 4 5 

check button Transcriptomic changes along malignancy continuum.
TissueExpression DynamicsAbbreviation
EsophagusThe image shows the transcriptomic changes along malignancy continuum.log2FC in expression of this searched gene in stem-like cells from each diseased tissue sample relative to stem-like cells in normal samples in each tissue plotted against the malignancy continuum. Samples are colored based on if they are from different disease stage.
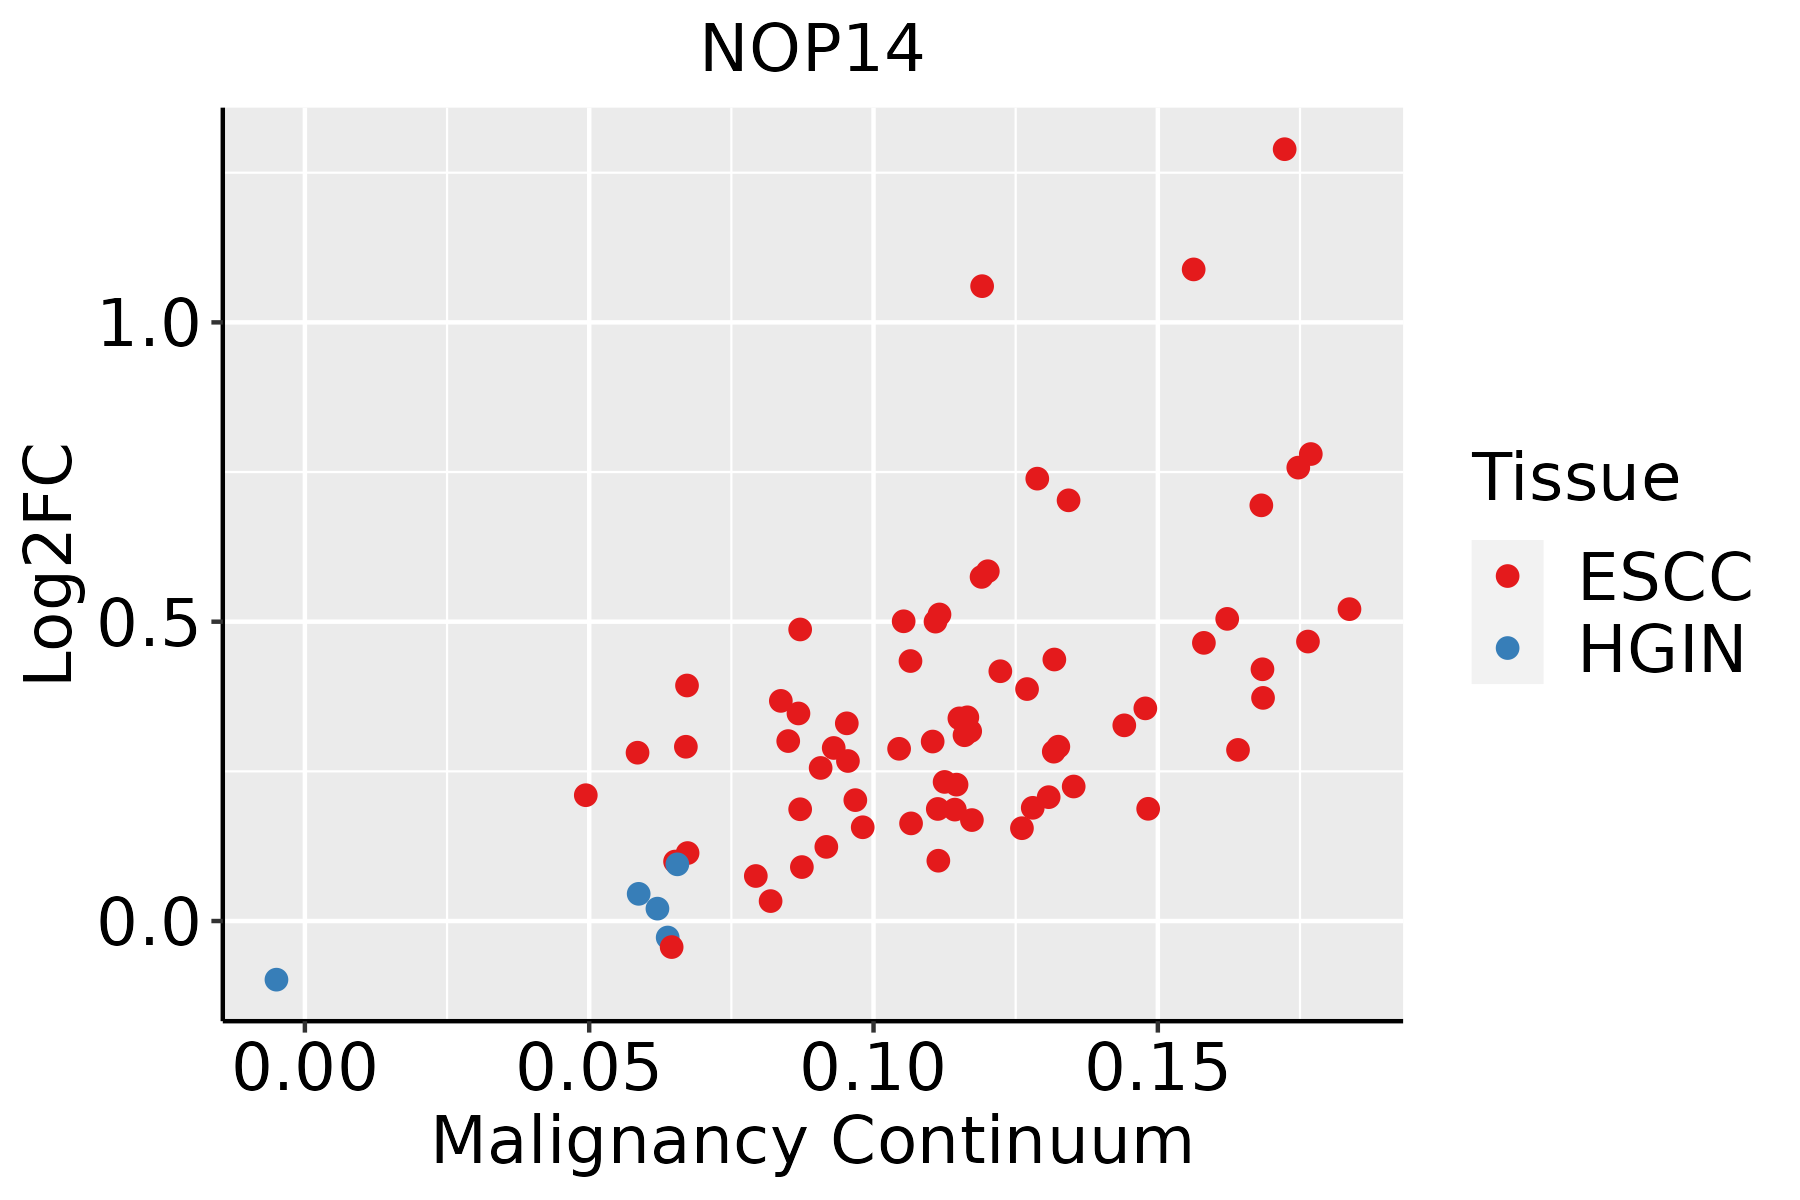
ESCC: Esophageal squamous cell carcinoma
HGIN: High-grade intraepithelial neoplasias
LGIN: Low-grade intraepithelial neoplasias
LiverThe image shows the transcriptomic changes along malignancy continuum.log2FC in expression of this searched gene in stem-like cells from each diseased tissue sample relative to stem-like cells in normal samples in each tissue plotted against the malignancy continuum. Samples are colored based on if they are from different disease stage.
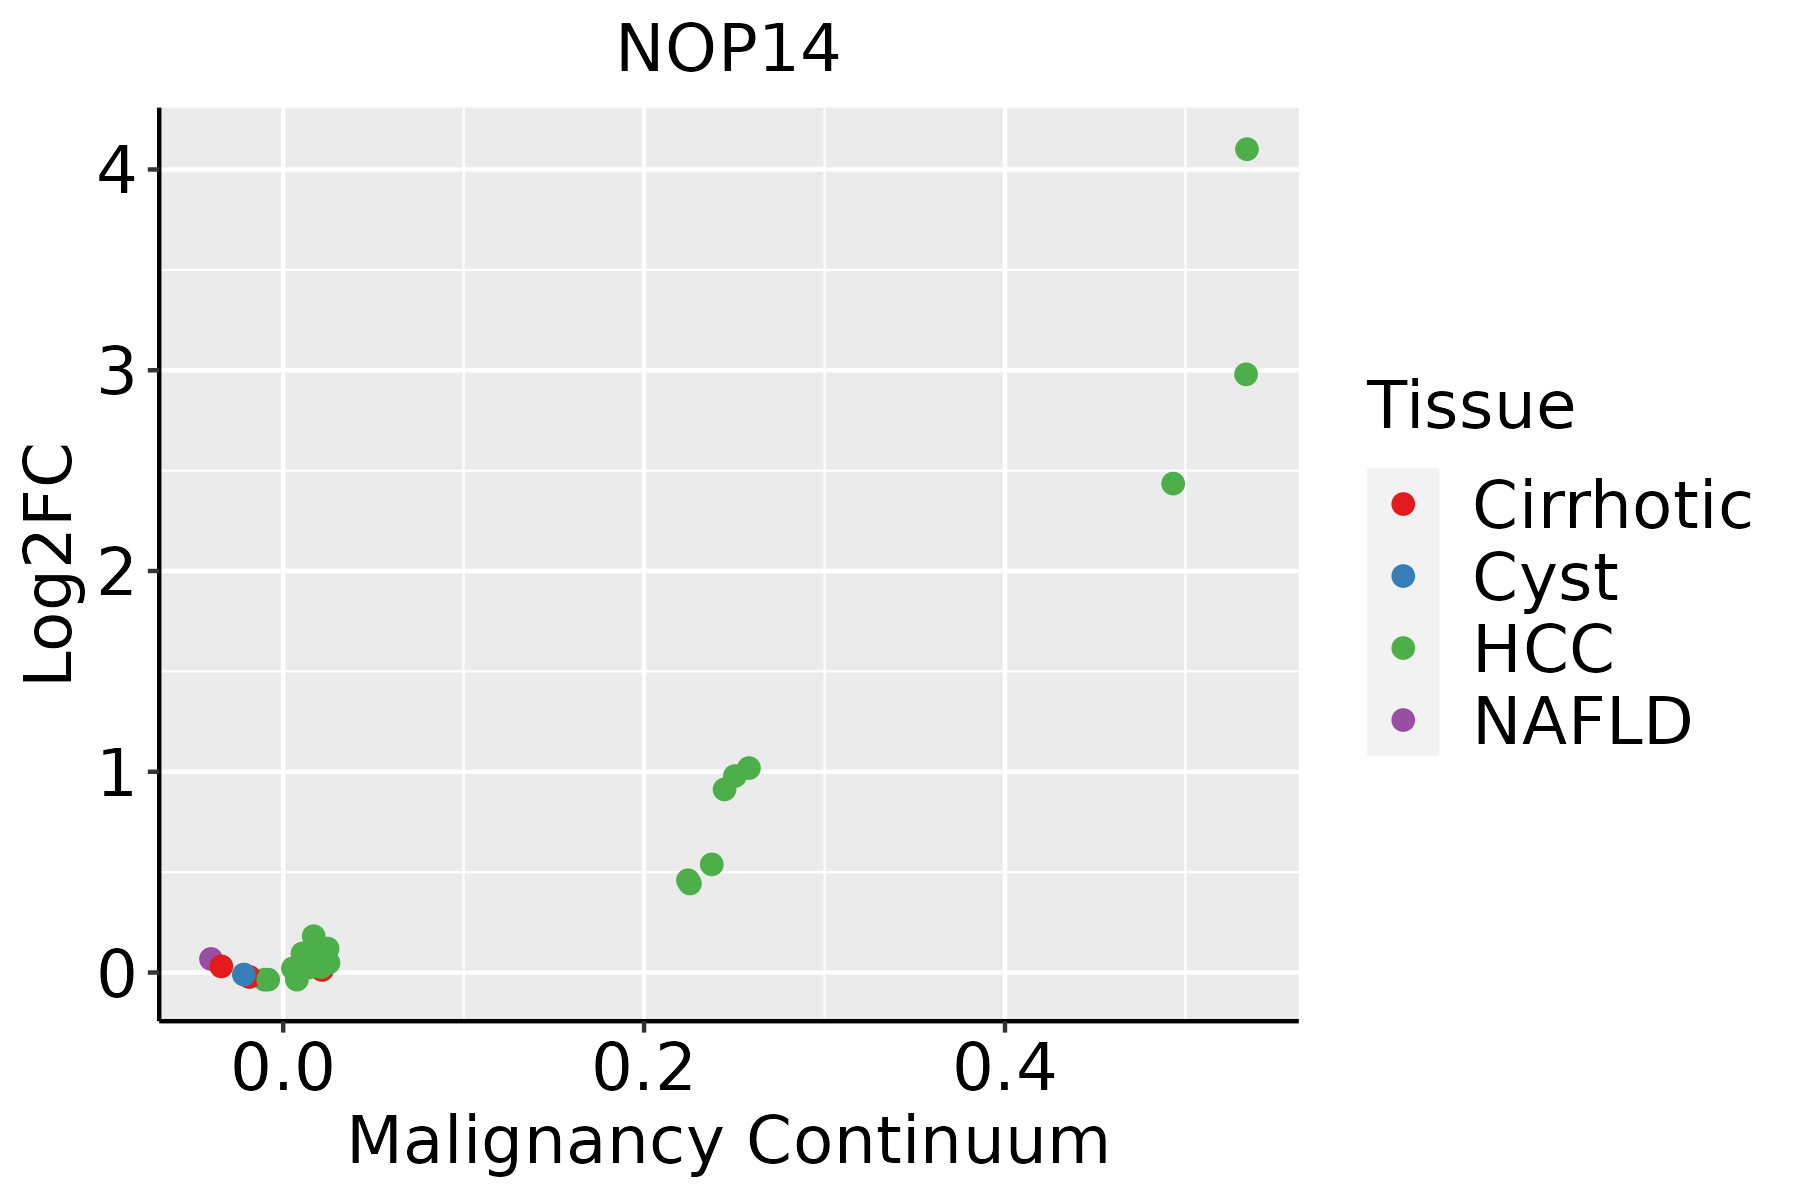
HCC: Hepatocellular carcinoma
NAFLD: Non-alcoholic fatty liver disease
Oral CavityThe image shows the transcriptomic changes along malignancy continuum.log2FC in expression of this searched gene in stem-like cells from each diseased tissue sample relative to stem-like cells in normal samples in each tissue plotted against the malignancy continuum. Samples are colored based on if they are from different disease stage.
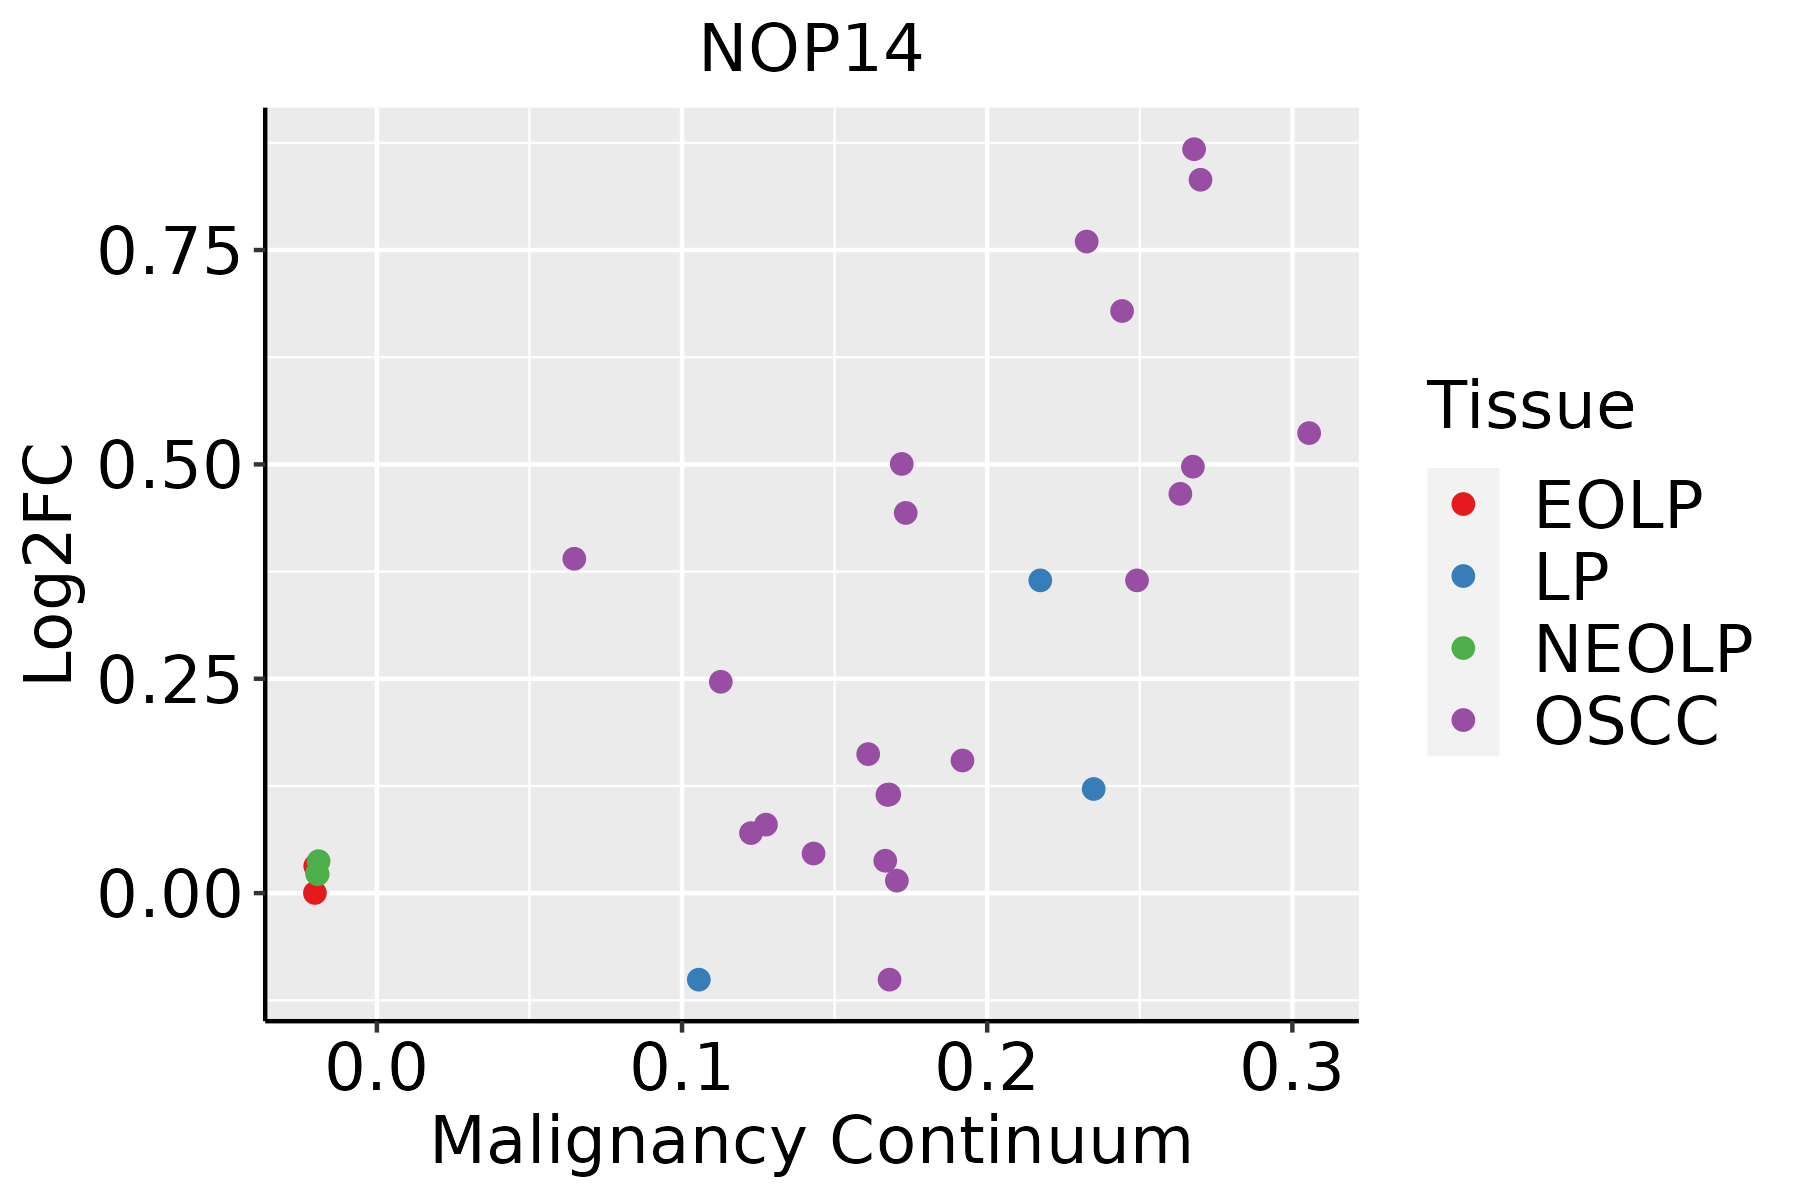
EOLP: Erosive Oral lichen planus
LP: leukoplakia
NEOLP: Non-erosive oral lichen planus
OSCC: Oral squamous cell carcinoma
SkinThe image shows the transcriptomic changes along malignancy continuum.log2FC in expression of this searched gene in stem-like cells from each diseased tissue sample relative to stem-like cells in normal samples in each tissue plotted against the malignancy continuum. Samples are colored based on if they are from different disease stage.
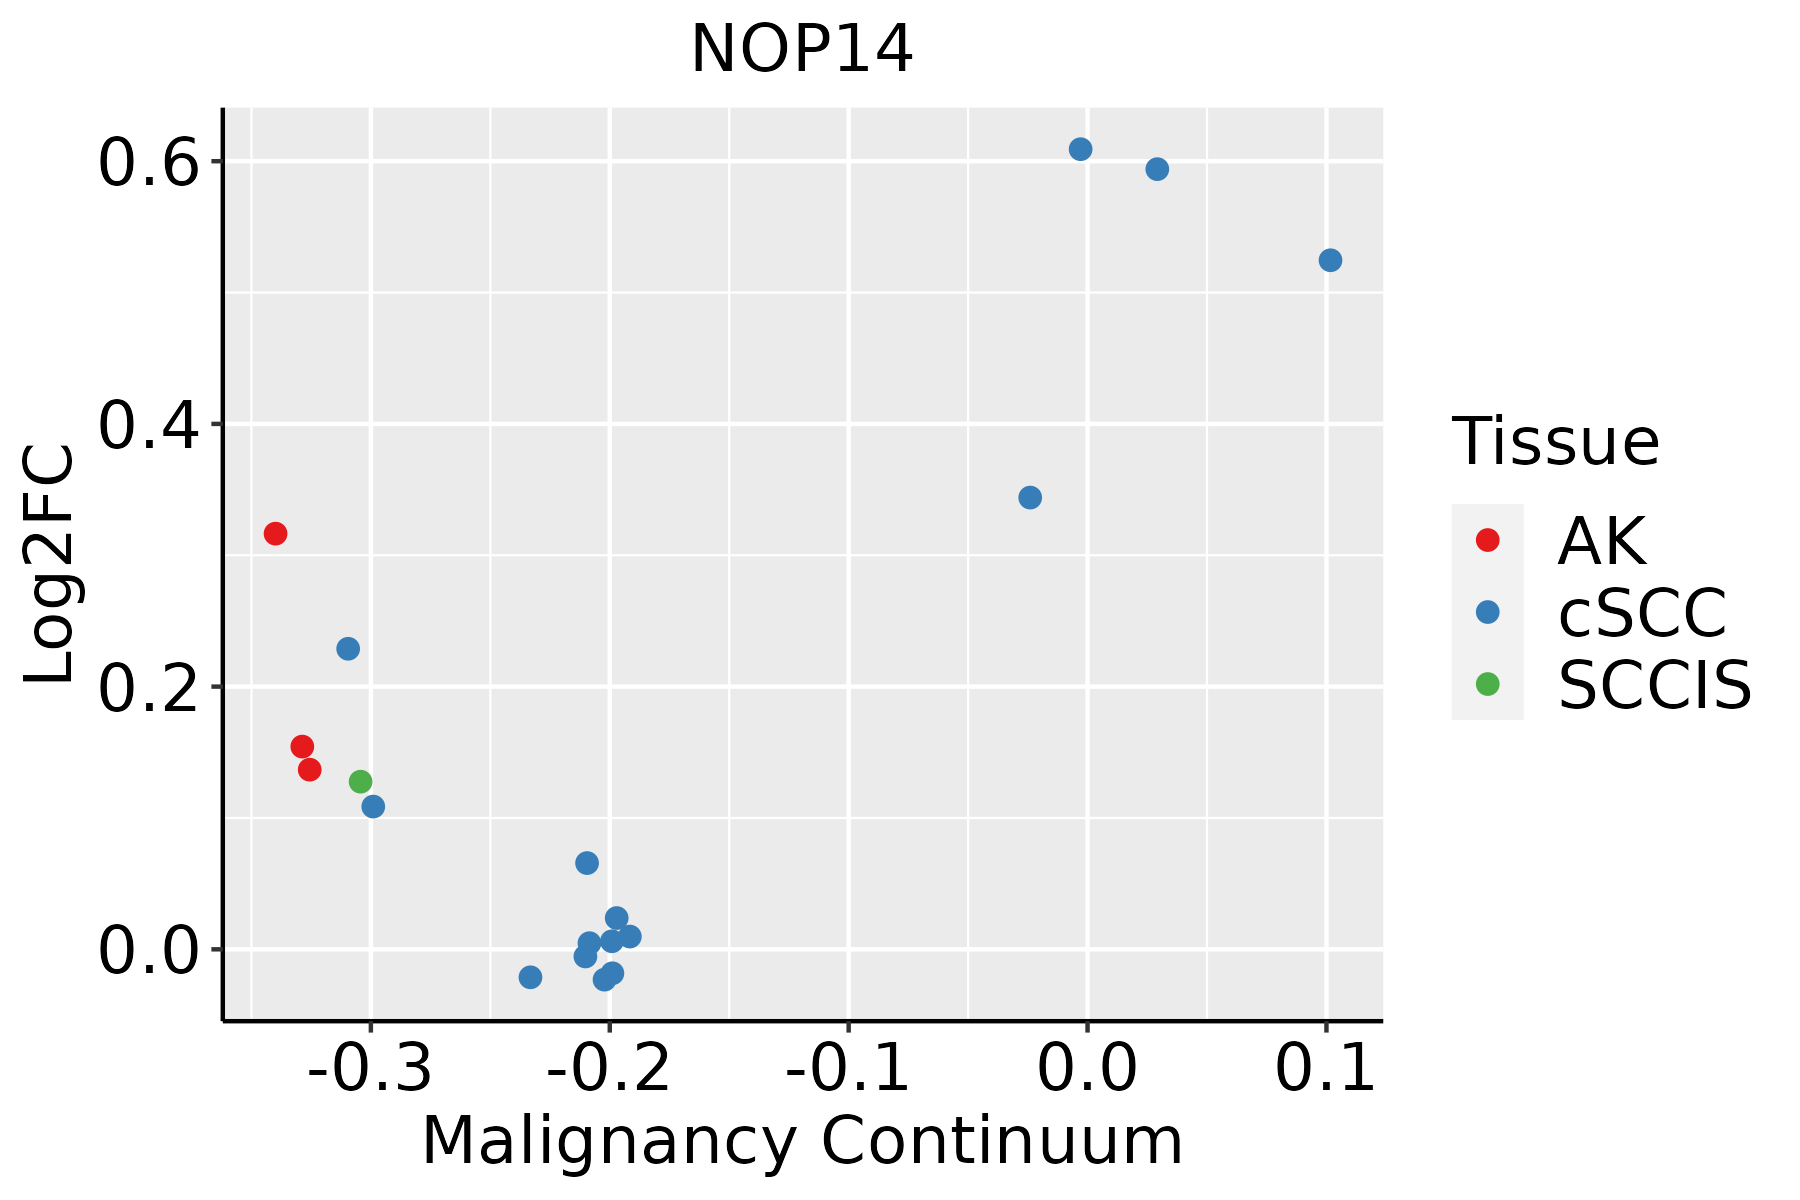
AK: Actinic keratosis
cSCC: Cutaneous squamous cell carcinoma
SCCIS:squamous cell carcinoma in situ
ThyroidThe image shows the transcriptomic changes along malignancy continuum.log2FC in expression of this searched gene in stem-like cells from each diseased tissue sample relative to stem-like cells in normal samples in each tissue plotted against the malignancy continuum. Samples are colored based on if they are from different disease stage.
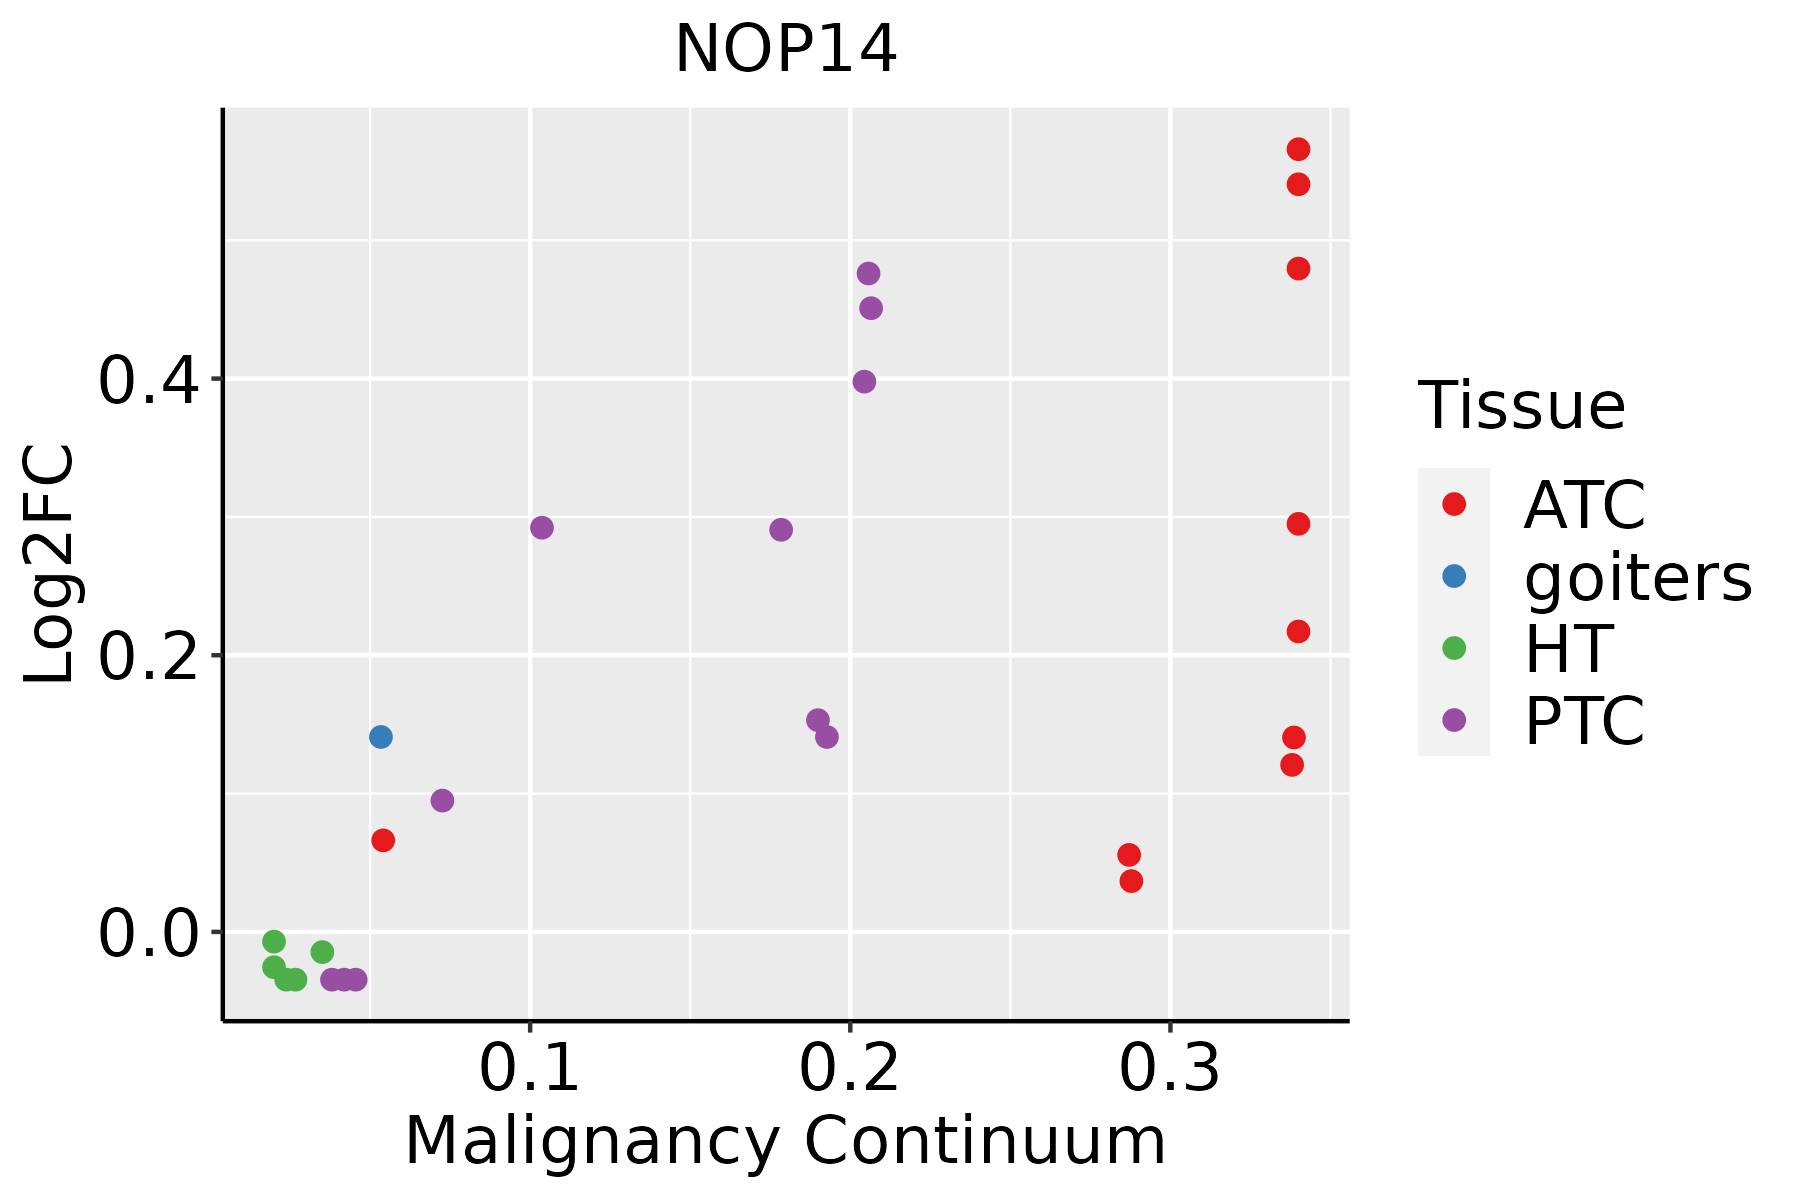
ATC: Anaplastic thyroid cancer
HT: Hashimoto's thyroiditis
PTC: Papillary thyroid cancer
∗log2FC in expression of this searched gene in stem-like cells from each diseased tissue sample relative to stem-like cells in normal samples in each tissue plotted against the malignancy continuum. Samples are colored based on if they are from different disease stage.

Top

Malignant transformation related pathway analysis

check buttonFind out the enriched GO biological processes and KEGG pathways involved in transition from healthy to precancer to cancer
check button Figure of enriched GO biological processes.
TissueDisease StageEnriched GO biological Processes
ColorectumADGO analysis - Figure of enriched GO biological processes: Top 15 enriched GO BP terms are showed in the bar plot of each disease state in each tissue. Each row represents a significant GO biological process which is colored according to the -log10(p.adjust).
ColorectumSERGO analysis - Figure of enriched GO biological processes: Top 15 enriched GO BP terms are showed in the bar plot of each disease state in each tissue. Each row represents a significant GO biological process which is colored according to the -log10(p.adjust).
ColorectumMSSGO analysis - Figure of enriched GO biological processes: Top 15 enriched GO BP terms are showed in the bar plot of each disease state in each tissue. Each row represents a significant GO biological process which is colored according to the -log10(p.adjust).
ColorectumMSI-HGO analysis - Figure of enriched GO biological processes: Top 15 enriched GO BP terms are showed in the bar plot of each disease state in each tissue. Each row represents a significant GO biological process which is colored according to the -log10(p.adjust).
ColorectumFAPGO analysis - Figure of enriched GO biological processes: Top 15 enriched GO BP terms are showed in the bar plot of each disease state in each tissue. Each row represents a significant GO biological process which is colored according to the -log10(p.adjust).
∗Top 15 enriched GO BP terms are showed in the bar plot of each disease state in each tissue. Each row represents a significant GO biological process which is colored according to the -log10(p.adjust).
Page: 1 2 3 4 5 6 7 8 9 

check button Enriched GO biological processes.
GO IDTissueDisease StageDescriptionGene RatioBg Ratiopvaluep.adjustCount
GO:0022613111EsophagusESCCribonucleoprotein complex biogenesis365/8552463/187231.74e-491.11e-45365
GO:0042254111EsophagusESCCribosome biogenesis252/8552299/187233.27e-441.04e-40252
GO:003447015EsophagusESCCncRNA processing300/8552395/187233.09e-353.26e-32300
GO:0016072110EsophagusESCCrRNA metabolic process197/8552236/187231.31e-331.18e-30197
GO:0006364110EsophagusESCCrRNA processing189/8552225/187234.88e-333.87e-30189
GO:003466012EsophagusESCCncRNA metabolic process346/8552485/187234.35e-312.51e-28346
GO:0042274111EsophagusESCCribosomal small subunit biogenesis67/855273/187236.62e-175.38e-1567
GO:00905013EsophagusESCCRNA phosphodiester bond hydrolysis110/8552152/187231.95e-116.81e-10110
GO:00304904EsophagusESCCmaturation of SSU-rRNA45/855250/187235.07e-111.63e-0945
GO:00903053EsophagusESCCnucleic acid phosphodiester bond hydrolysis163/8552261/187233.07e-085.73e-07163
GO:00004623EsophagusESCCmaturation of SSU-rRNA from tricistronic rRNA transcript (SSU-rRNA, 5.8S rRNA, LSU-rRNA)32/855237/187232.96e-074.23e-0632
GO:00004603EsophagusESCCmaturation of 5.8S rRNA30/855235/187231.07e-061.34e-0530
GO:00004693EsophagusESCCcleavage involved in rRNA processing24/855227/187233.48e-063.84e-0524
GO:00004663EsophagusESCCmaturation of 5.8S rRNA from tricistronic rRNA transcript (SSU-rRNA, 5.8S rRNA, LSU-rRNA)21/855224/187232.57e-052.17e-0421
GO:00905023EsophagusESCCRNA phosphodiester bond hydrolysis, endonucleolytic55/855282/187237.34e-055.51e-0455
GO:00004783EsophagusESCCendonucleolytic cleavage involved in rRNA processing14/855215/187231.47e-049.85e-0414
GO:00004793EsophagusESCCendonucleolytic cleavage of tricistronic rRNA transcript (SSU-rRNA, 5.8S rRNA, LSU-rRNA)14/855215/187231.47e-049.85e-0414
GO:00344713EsophagusESCCncRNA 5'-end processing18/855221/187231.81e-041.16e-0318
GO:00009663EsophagusESCCRNA 5'-end processing19/855223/187233.12e-041.85e-0319
GO:002261322LiverHCCribonucleoprotein complex biogenesis355/7958463/187237.76e-524.92e-48355
Page: 1 2 3 4 5 6 

check button Enriched KEGG pathways.
Pathway IDTissueDisease StageDescriptionGene RatioBg Ratiopvaluep.adjustqvalueCount
Page: 1 

Top

Cell-cell communication analysis

check buttonIdentification of potential cell-cell interactions between two cell types and their ligand-receptor pairs for different disease states
LigandReceptorLRpairPathwayTissueDisease Stage
Page: 1 

Top

Single-cell gene regulatory network inference analysis

check buttonFind out the significant the regulons (TFs) and the target genes of each regulon across cell types for different disease states
TFCell TypeTissueDisease StageTarget GeneRSSRegulon Activity
∗The dot plots of a searched regulon are shown for all cell subpopulations in each disease state of each tissue based on the regulon specific score inferred using pySCENIC and by calculating the average expression.
Page: 1 

Top

Somatic mutation of malignant transformation related genes

check buttonAnnotation of somatic variants for genes involved in malignant transformation
Hugo SymbolVariant ClassVariant ClassificationdbSNP RSHGVScHGVSpHGVSp ShortSWISSPROTBIOTYPESIFTPolyPhenTumor Sample BarcodeTissueHistologySexAgeStageTherapy TypesDrugsOutcome
NOP14SNVMissense_Mutationnovelc.418C>Ap.His140Asnp.H140NP78316protein_codingdeleterious(0.01)benign(0.359)TCGA-A2-A25A-01Breastbreast invasive carcinomaFemale<65I/IIUnspecificCytoxanSD
NOP14SNVMissense_Mutationc.718G>Cp.Glu240Glnp.E240QP78316protein_codingtolerated(0.15)benign(0.027)TCGA-C8-A1HG-01Breastbreast invasive carcinomaFemale<65I/IIUnknownUnknownSD
NOP14SNVMissense_Mutationc.727G>Cp.Asp243Hisp.D243HP78316protein_codingdeleterious(0.01)benign(0.015)TCGA-D8-A1JA-01Breastbreast invasive carcinomaFemale<65III/IVChemotherapyadriamycinPD
NOP14SNVMissense_Mutationc.1066N>Ap.Glu356Lysp.E356KP78316protein_codingtolerated(0.17)benign(0.012)TCGA-E2-A10C-01Breastbreast invasive carcinomaFemale<65I/IIChemotherapycytoxanSD
NOP14SNVMissense_Mutationc.2571A>Tp.Lys857Asnp.K857NP78316protein_codingdeleterious_low_confidence(0.03)benign(0.006)TCGA-E2-A1IH-01Breastbreast invasive carcinomaFemale>=65I/IIHormone TherapyaromasinSD
NOP14insertionFrame_Shift_Insnovelc.840_841insTTCAGGCGGGGAGGACACAGAGGAGAGCGACAGCCp.Glu281PhefsTer49p.E281Ffs*49P78316protein_codingTCGA-BH-A0HK-01Breastbreast invasive carcinomaFemale>=65I/IIHormone TherapyarimidexSD
NOP14SNVMissense_Mutationrs770027682c.2238N>Cp.Gln746Hisp.Q746HP78316protein_codingtolerated(0.16)possibly_damaging(0.69)TCGA-DS-A1OB-01Cervixcervical & endocervical cancerFemale<65I/IIChemotherapycarboplatinPD
NOP14SNVMissense_Mutationnovelc.1240N>Cp.Ala414Prop.A414PP78316protein_codingtolerated(0.14)possibly_damaging(0.602)TCGA-JW-A5VL-01Cervixcervical & endocervical cancerFemale<65I/IIUnknownUnknownSD
NOP14SNVMissense_Mutationc.1483N>Tp.Ile495Phep.I495FP78316protein_codingtolerated(0.14)possibly_damaging(0.899)TCGA-JX-A3Q8-01Cervixcervical & endocervical cancerFemale<65I/IIUnknownUnknownSD
NOP14SNVMissense_Mutationnovelc.2363N>Gp.Glu788Glyp.E788GP78316protein_codingdeleterious(0)probably_damaging(0.999)TCGA-VS-A954-01Cervixcervical & endocervical cancerFemale>=65III/IVChemotherapycisplatinCR
Page: 1 2 3 4 5 6 7 

Top

Related drugs of malignant transformation related genes

check buttonIdentification of chemicals and drugs interact with genes involved in malignant transfromation
(DGIdb 4.0)
Entrez IDSymbolCategoryInteraction TypesDrug Claim NameDrug NamePMIDs
Page: 1