
|
|||||
|
 | |
| |
| |
| |
| |
| |
|
Gene: NBR1 |
Gene summary for NBR1 |
| Gene information | Species | Human | Gene symbol | NBR1 | Gene ID | 4077 |
| Gene name | NBR1 autophagy cargo receptor | |
| Gene Alias | 1A1-3B | |
| Cytomap | 17q21.31 | |
| Gene Type | protein-coding | GO ID | GO:0000165 | UniProtAcc | Q14596 |
Top |
Malignant transformation analysis |
| Identification of the aberrant gene expression in precancerous and cancerous lesions by comparing the gene expression of stem-like cells in diseased tissues with normal stem cells |
| Entrez ID | Symbol | Replicates | Species | Organ | Tissue | Adj P-value | Log2FC | Malignancy |
| 4077 | NBR1 | LZE24T | Human | Esophagus | ESCC | 1.25e-21 | 6.51e-01 | 0.0596 |
| 4077 | NBR1 | LZE21T | Human | Esophagus | ESCC | 3.73e-04 | 3.60e-01 | 0.0655 |
| 4077 | NBR1 | LZE6T | Human | Esophagus | ESCC | 2.99e-02 | 2.14e-01 | 0.0845 |
| 4077 | NBR1 | P1T-E | Human | Esophagus | ESCC | 3.35e-11 | 5.42e-01 | 0.0875 |
| 4077 | NBR1 | P2T-E | Human | Esophagus | ESCC | 1.96e-21 | 3.92e-01 | 0.1177 |
| 4077 | NBR1 | P4T-E | Human | Esophagus | ESCC | 5.28e-19 | 3.86e-01 | 0.1323 |
| 4077 | NBR1 | P5T-E | Human | Esophagus | ESCC | 1.71e-16 | 1.45e-01 | 0.1327 |
| 4077 | NBR1 | P8T-E | Human | Esophagus | ESCC | 2.45e-22 | 4.86e-01 | 0.0889 |
| 4077 | NBR1 | P9T-E | Human | Esophagus | ESCC | 1.34e-06 | 3.10e-01 | 0.1131 |
| 4077 | NBR1 | P10T-E | Human | Esophagus | ESCC | 9.69e-11 | 1.13e-01 | 0.116 |
| 4077 | NBR1 | P11T-E | Human | Esophagus | ESCC | 2.56e-20 | 5.58e-01 | 0.1426 |
| 4077 | NBR1 | P12T-E | Human | Esophagus | ESCC | 2.83e-28 | 4.86e-01 | 0.1122 |
| 4077 | NBR1 | P15T-E | Human | Esophagus | ESCC | 3.46e-28 | 5.87e-01 | 0.1149 |
| 4077 | NBR1 | P16T-E | Human | Esophagus | ESCC | 1.67e-30 | 6.32e-01 | 0.1153 |
| 4077 | NBR1 | P17T-E | Human | Esophagus | ESCC | 4.45e-12 | 3.27e-01 | 0.1278 |
| 4077 | NBR1 | P19T-E | Human | Esophagus | ESCC | 1.53e-08 | 5.04e-01 | 0.1662 |
| 4077 | NBR1 | P20T-E | Human | Esophagus | ESCC | 7.57e-23 | 4.07e-01 | 0.1124 |
| 4077 | NBR1 | P21T-E | Human | Esophagus | ESCC | 4.37e-26 | 3.86e-01 | 0.1617 |
| 4077 | NBR1 | P22T-E | Human | Esophagus | ESCC | 4.35e-25 | 4.30e-01 | 0.1236 |
| 4077 | NBR1 | P23T-E | Human | Esophagus | ESCC | 1.73e-26 | 5.45e-01 | 0.108 |
| Page: 1 2 3 4 5 6 7 8 9 |
| Tissue | Expression Dynamics | Abbreviation |
| Colorectum (GSE201348) |  | FAP: Familial adenomatous polyposis |
| CRC: Colorectal cancer | ||
| Colorectum (HTA11) |  | AD: Adenomas |
| SER: Sessile serrated lesions | ||
| MSI-H: Microsatellite-high colorectal cancer | ||
| MSS: Microsatellite stable colorectal cancer | ||
| Esophagus |  | ESCC: Esophageal squamous cell carcinoma |
| HGIN: High-grade intraepithelial neoplasias | ||
| LGIN: Low-grade intraepithelial neoplasias | ||
| Liver | 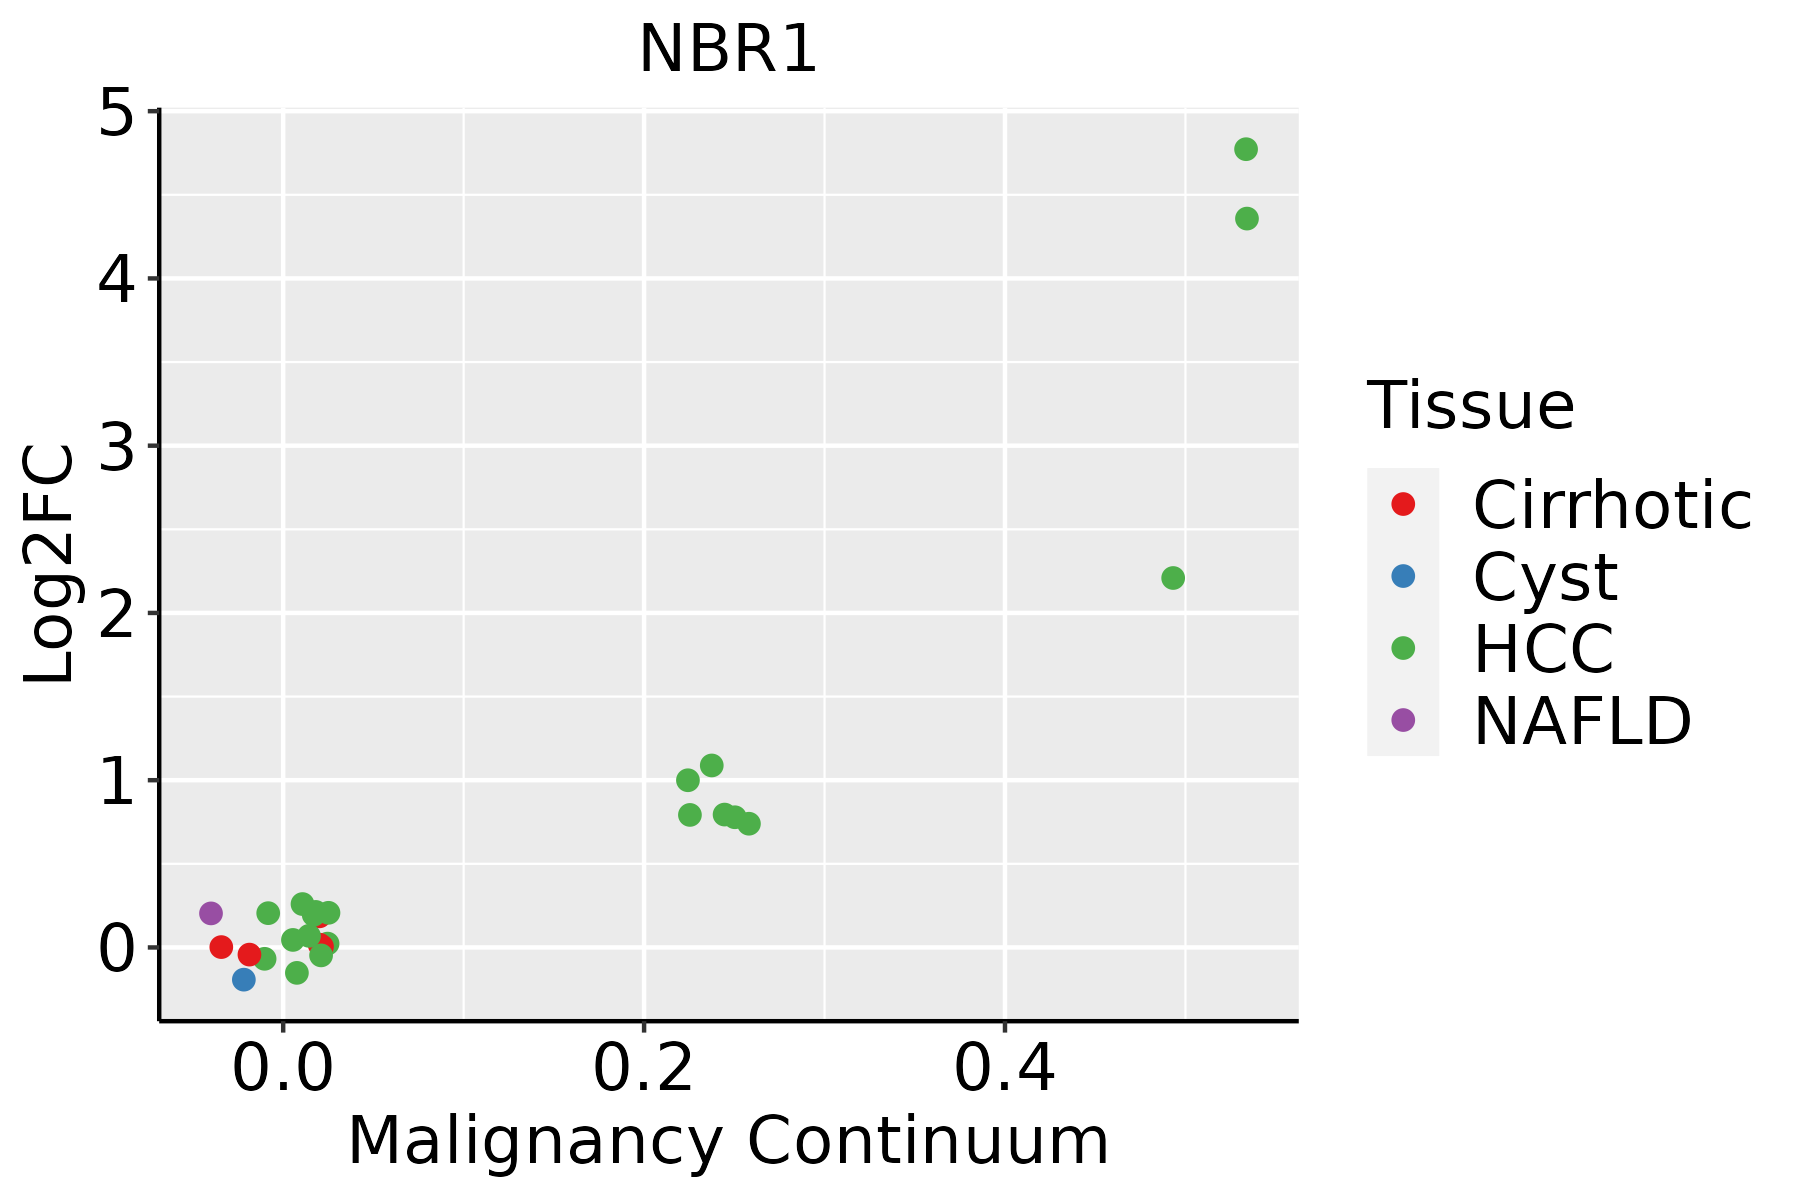 | HCC: Hepatocellular carcinoma |
| NAFLD: Non-alcoholic fatty liver disease | ||
| Oral Cavity |  | EOLP: Erosive Oral lichen planus |
| LP: leukoplakia | ||
| NEOLP: Non-erosive oral lichen planus | ||
| OSCC: Oral squamous cell carcinoma | ||
| Prostate | 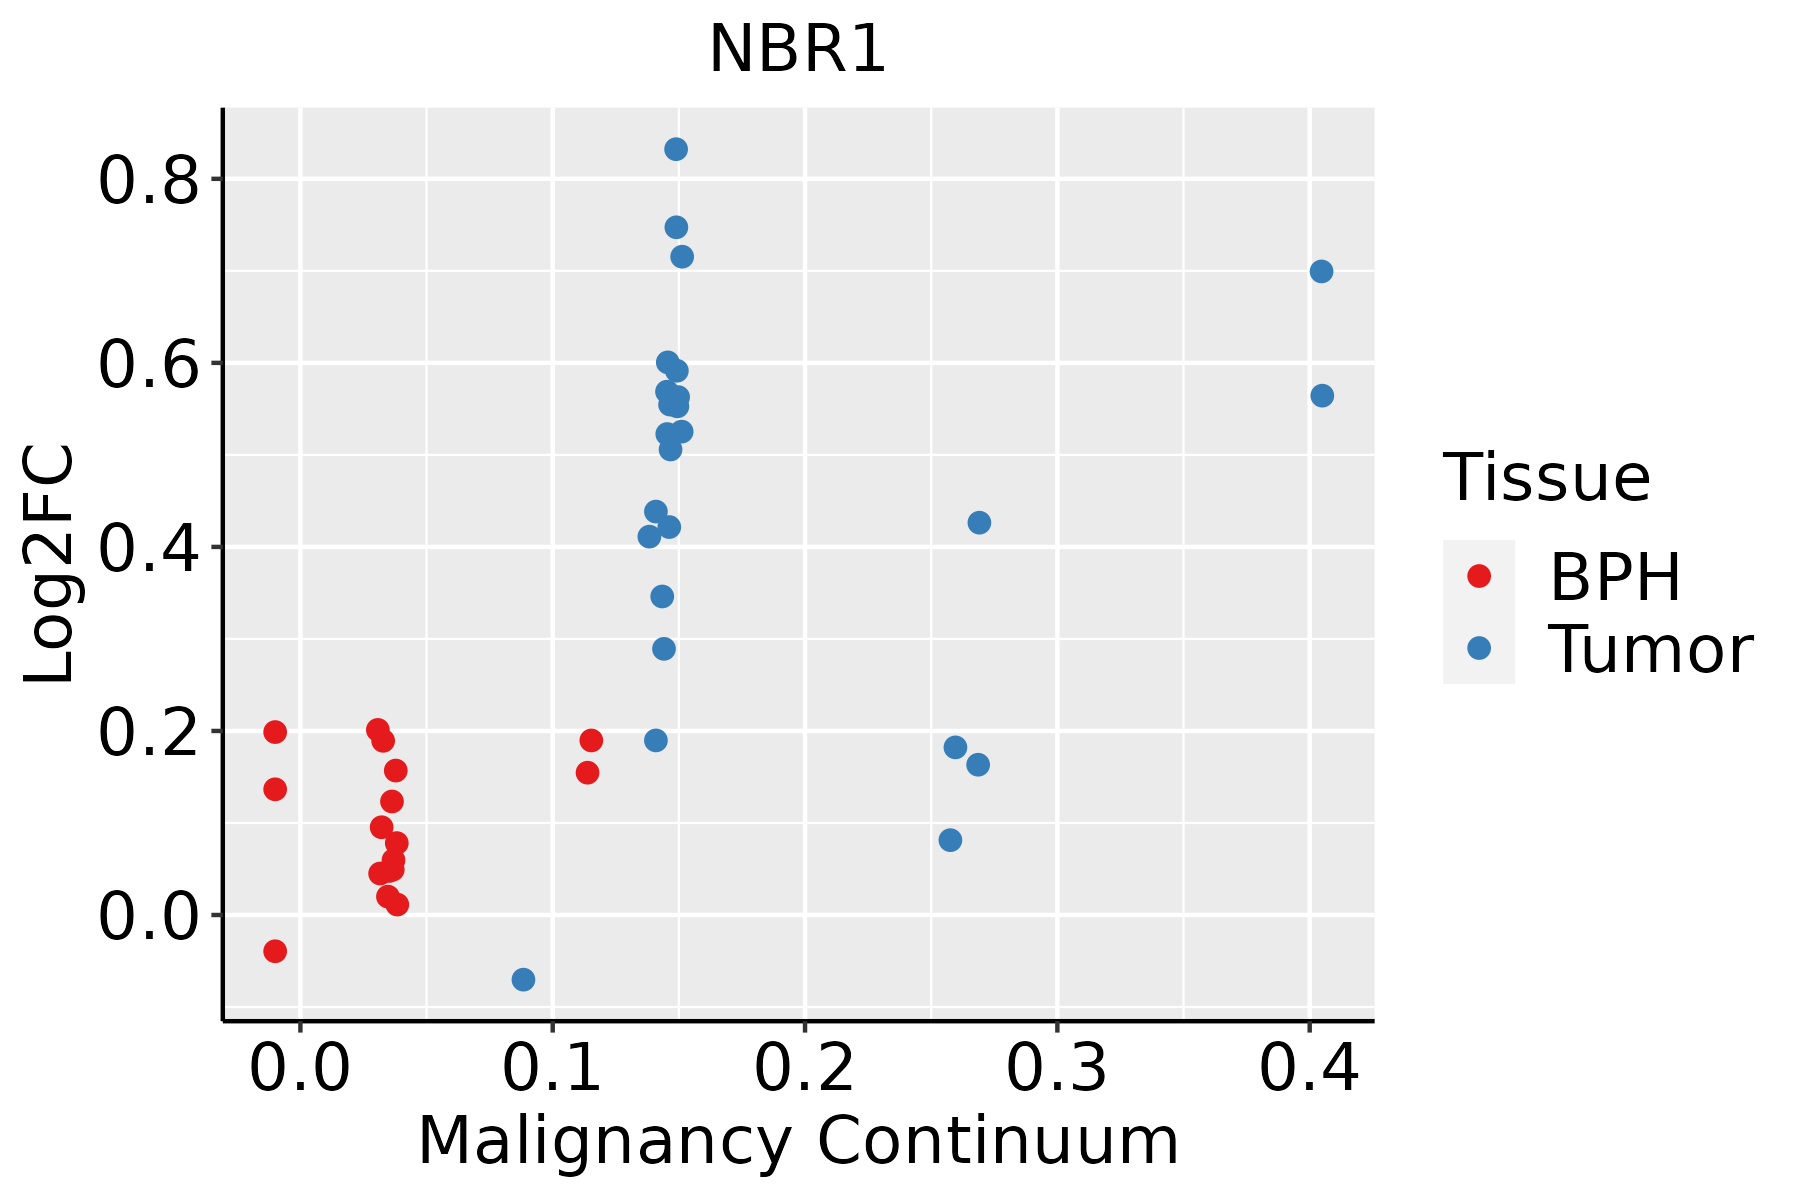 | BPH: Benign Prostatic Hyperplasia |
| Skin |  | AK: Actinic keratosis |
| cSCC: Cutaneous squamous cell carcinoma | ||
| SCCIS:squamous cell carcinoma in situ | ||
| Thyroid | 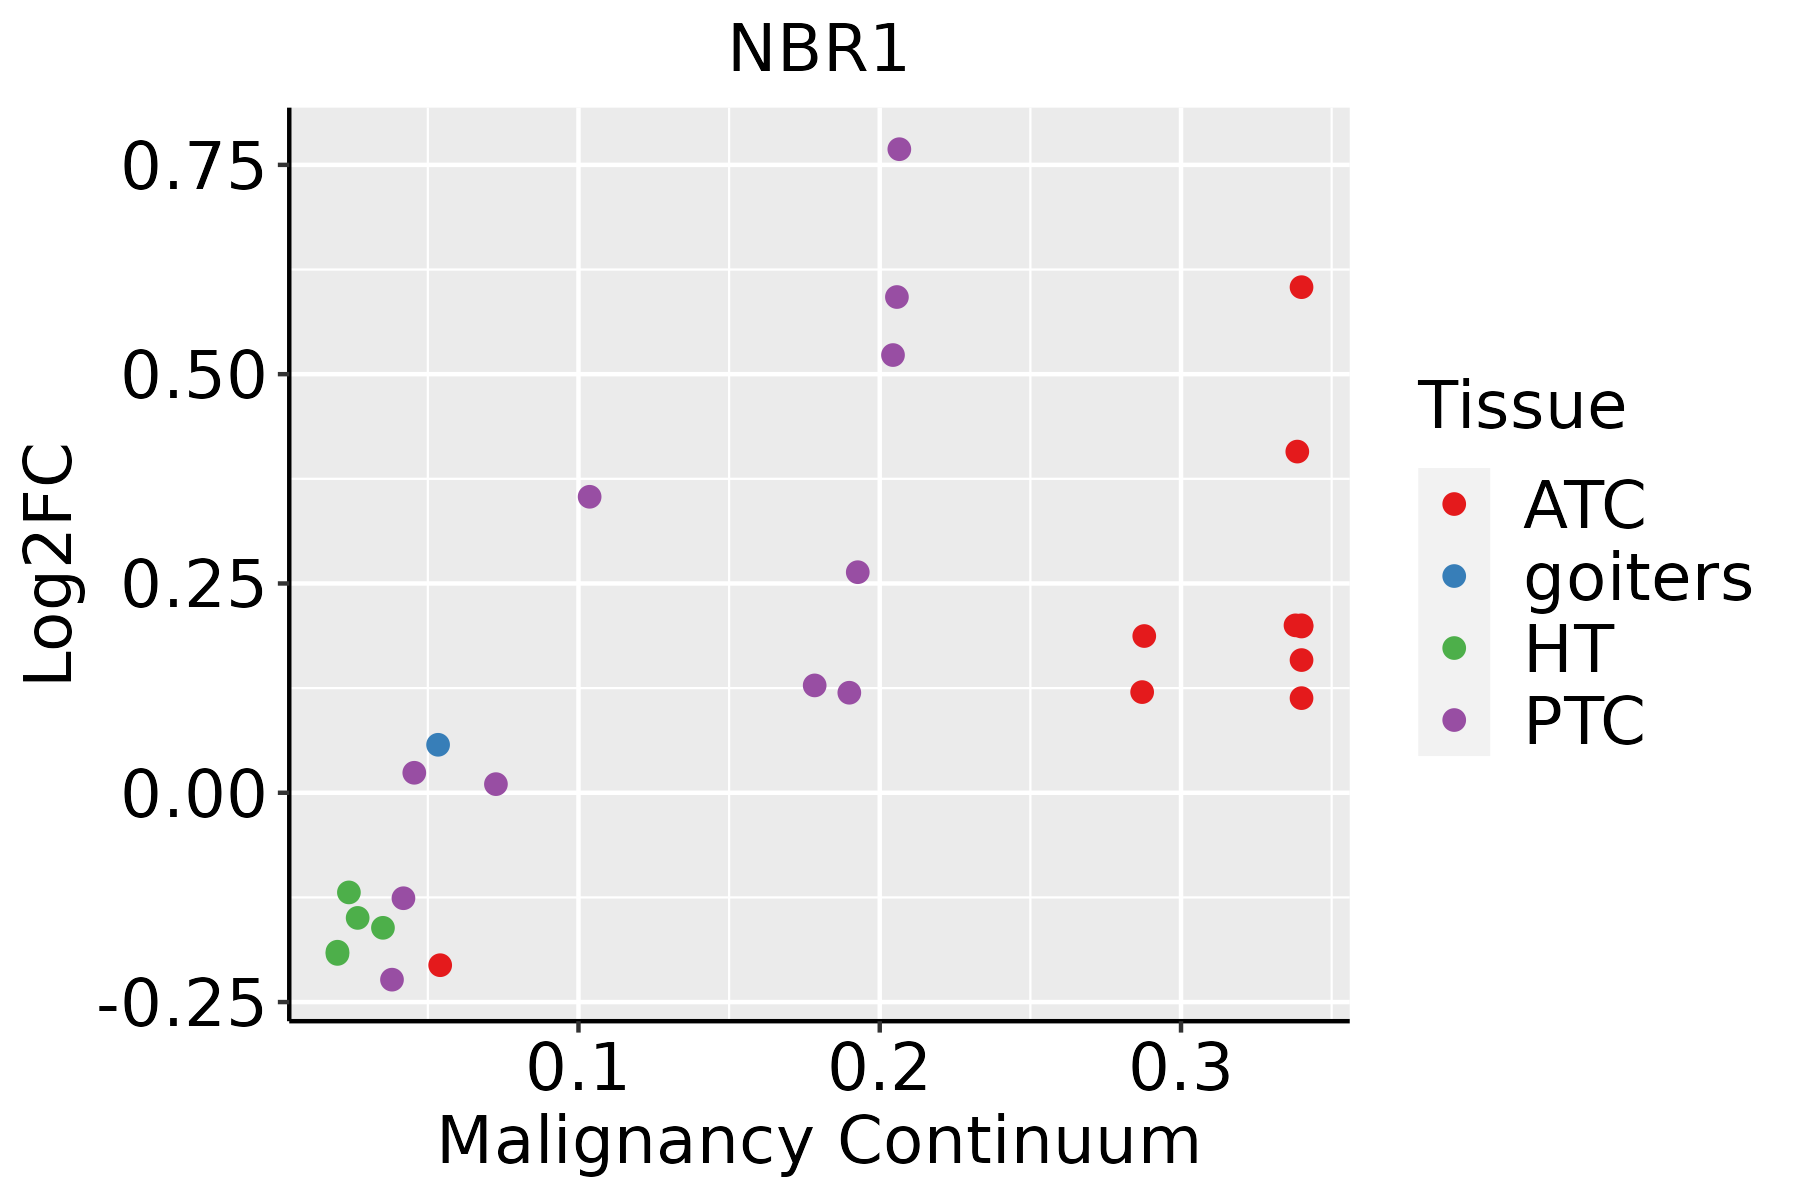 | ATC: Anaplastic thyroid cancer |
| HT: Hashimoto's thyroiditis | ||
| PTC: Papillary thyroid cancer |
| ∗log2FC in expression of this searched gene in stem-like cells from each diseased tissue sample relative to stem-like cells in normal samples in each tissue plotted against the malignancy continuum. Samples are colored based on if they are from different disease stage. |
Top |
Malignant transformation related pathway analysis |
| Find out the enriched GO biological processes and KEGG pathways involved in transition from healthy to precancer to cancer |
| Tissue | Disease Stage | Enriched GO biological Processes |
| Colorectum | AD |  |
| Colorectum | SER |  |
| Colorectum | MSS |  |
| Colorectum | MSI-H |  |
| Colorectum | FAP |  |
| ∗Top 15 enriched GO BP terms are showed in the bar plot of each disease state in each tissue. Each row represents a significant GO biological process which is colored according to the -log10(p.adjust). |
| Page: 1 2 3 4 5 6 7 8 9 |
| GO ID | Tissue | Disease Stage | Description | Gene Ratio | Bg Ratio | pvalue | p.adjust | Count |
| GO:0016236 | Colorectum | AD | macroautophagy | 103/3918 | 291/18723 | 6.76e-09 | 4.15e-07 | 103 |
| GO:0001649 | Colorectum | AD | osteoblast differentiation | 70/3918 | 229/18723 | 3.59e-04 | 4.18e-03 | 70 |
| GO:0051403 | Colorectum | AD | stress-activated MAPK cascade | 72/3918 | 239/18723 | 4.77e-04 | 5.25e-03 | 72 |
| GO:0031098 | Colorectum | AD | stress-activated protein kinase signaling cascade | 74/3918 | 247/18723 | 4.80e-04 | 5.27e-03 | 74 |
| GO:0070302 | Colorectum | AD | regulation of stress-activated protein kinase signaling cascade | 58/3918 | 195/18723 | 2.21e-03 | 1.74e-02 | 58 |
| GO:0032872 | Colorectum | AD | regulation of stress-activated MAPK cascade | 57/3918 | 192/18723 | 2.51e-03 | 1.92e-02 | 57 |
| GO:0001503 | Colorectum | AD | ossification | 106/3918 | 408/18723 | 7.68e-03 | 4.64e-02 | 106 |
| GO:00162361 | Colorectum | SER | macroautophagy | 79/2897 | 291/18723 | 1.97e-07 | 1.10e-05 | 79 |
| GO:00016491 | Colorectum | SER | osteoblast differentiation | 56/2897 | 229/18723 | 2.49e-04 | 4.21e-03 | 56 |
| GO:00310981 | Colorectum | SER | stress-activated protein kinase signaling cascade | 54/2897 | 247/18723 | 4.65e-03 | 3.67e-02 | 54 |
| GO:00514031 | Colorectum | SER | stress-activated MAPK cascade | 52/2897 | 239/18723 | 5.96e-03 | 4.35e-02 | 52 |
| GO:00015031 | Colorectum | SER | ossification | 82/2897 | 408/18723 | 6.76e-03 | 4.78e-02 | 82 |
| GO:00162362 | Colorectum | MSS | macroautophagy | 93/3467 | 291/18723 | 2.08e-08 | 1.17e-06 | 93 |
| GO:00016492 | Colorectum | MSS | osteoblast differentiation | 64/3467 | 229/18723 | 2.91e-04 | 3.83e-03 | 64 |
| GO:00310982 | Colorectum | MSS | stress-activated protein kinase signaling cascade | 67/3467 | 247/18723 | 5.28e-04 | 5.99e-03 | 67 |
| GO:00514032 | Colorectum | MSS | stress-activated MAPK cascade | 65/3467 | 239/18723 | 5.87e-04 | 6.49e-03 | 65 |
| GO:00703021 | Colorectum | MSS | regulation of stress-activated protein kinase signaling cascade | 52/3467 | 195/18723 | 3.07e-03 | 2.34e-02 | 52 |
| GO:00328721 | Colorectum | MSS | regulation of stress-activated MAPK cascade | 51/3467 | 192/18723 | 3.65e-03 | 2.69e-02 | 51 |
| GO:00015032 | Colorectum | MSS | ossification | 96/3467 | 408/18723 | 6.09e-03 | 4.07e-02 | 96 |
| GO:00162363 | Colorectum | FAP | macroautophagy | 70/2622 | 291/18723 | 2.73e-06 | 1.02e-04 | 70 |
| Page: 1 2 3 4 5 6 |
| Pathway ID | Tissue | Disease Stage | Description | Gene Ratio | Bg Ratio | pvalue | p.adjust | qvalue | Count |
| hsa04137 | Colorectum | AD | Mitophagy - animal | 29/2092 | 72/8465 | 2.49e-03 | 1.35e-02 | 8.59e-03 | 29 |
| hsa041371 | Colorectum | AD | Mitophagy - animal | 29/2092 | 72/8465 | 2.49e-03 | 1.35e-02 | 8.59e-03 | 29 |
| hsa041372 | Colorectum | SER | Mitophagy - animal | 22/1580 | 72/8465 | 9.93e-03 | 4.78e-02 | 3.47e-02 | 22 |
| hsa041373 | Colorectum | SER | Mitophagy - animal | 22/1580 | 72/8465 | 9.93e-03 | 4.78e-02 | 3.47e-02 | 22 |
| hsa041374 | Colorectum | MSS | Mitophagy - animal | 27/1875 | 72/8465 | 2.17e-03 | 1.10e-02 | 6.76e-03 | 27 |
| hsa041375 | Colorectum | MSS | Mitophagy - animal | 27/1875 | 72/8465 | 2.17e-03 | 1.10e-02 | 6.76e-03 | 27 |
| hsa041376 | Colorectum | MSI-H | Mitophagy - animal | 16/797 | 72/8465 | 8.73e-04 | 1.01e-02 | 8.48e-03 | 16 |
| hsa041377 | Colorectum | MSI-H | Mitophagy - animal | 16/797 | 72/8465 | 8.73e-04 | 1.01e-02 | 8.48e-03 | 16 |
| hsa041378 | Colorectum | FAP | Mitophagy - animal | 20/1404 | 72/8465 | 1.14e-02 | 3.92e-02 | 2.38e-02 | 20 |
| hsa041379 | Colorectum | FAP | Mitophagy - animal | 20/1404 | 72/8465 | 1.14e-02 | 3.92e-02 | 2.38e-02 | 20 |
| hsa0413730 | Esophagus | HGIN | Mitophagy - animal | 23/1383 | 72/8465 | 7.69e-04 | 7.59e-03 | 6.03e-03 | 23 |
| hsa04137113 | Esophagus | HGIN | Mitophagy - animal | 23/1383 | 72/8465 | 7.69e-04 | 7.59e-03 | 6.03e-03 | 23 |
| hsa04137210 | Esophagus | ESCC | Mitophagy - animal | 54/4205 | 72/8465 | 9.33e-06 | 4.96e-05 | 2.54e-05 | 54 |
| hsa0413738 | Esophagus | ESCC | Mitophagy - animal | 54/4205 | 72/8465 | 9.33e-06 | 4.96e-05 | 2.54e-05 | 54 |
| hsa0413721 | Liver | Cirrhotic | Mitophagy - animal | 39/2530 | 72/8465 | 1.38e-05 | 1.24e-04 | 7.64e-05 | 39 |
| hsa0413731 | Liver | Cirrhotic | Mitophagy - animal | 39/2530 | 72/8465 | 1.38e-05 | 1.24e-04 | 7.64e-05 | 39 |
| hsa0413741 | Liver | HCC | Mitophagy - animal | 53/4020 | 72/8465 | 5.49e-06 | 4.59e-05 | 2.56e-05 | 53 |
| hsa0413751 | Liver | HCC | Mitophagy - animal | 53/4020 | 72/8465 | 5.49e-06 | 4.59e-05 | 2.56e-05 | 53 |
| hsa0413728 | Oral cavity | OSCC | Mitophagy - animal | 58/3704 | 72/8465 | 1.48e-10 | 2.07e-09 | 1.05e-09 | 58 |
| hsa04137112 | Oral cavity | OSCC | Mitophagy - animal | 58/3704 | 72/8465 | 1.48e-10 | 2.07e-09 | 1.05e-09 | 58 |
| Page: 1 2 |
Top |
Cell-cell communication analysis |
| Identification of potential cell-cell interactions between two cell types and their ligand-receptor pairs for different disease states |
| Ligand | Receptor | LRpair | Pathway | Tissue | Disease Stage |
| Page: 1 |
Top |
Single-cell gene regulatory network inference analysis |
| Find out the significant the regulons (TFs) and the target genes of each regulon across cell types for different disease states |
| TF | Cell Type | Tissue | Disease Stage | Target Gene | RSS | Regulon Activity |
| ∗The dot plots of a searched regulon are shown for all cell subpopulations in each disease state of each tissue based on the regulon specific score inferred using pySCENIC and by calculating the average expression. |
| Page: 1 |
Top |
Somatic mutation of malignant transformation related genes |
| Annotation of somatic variants for genes involved in malignant transformation |
| Hugo Symbol | Variant Class | Variant Classification | dbSNP RS | HGVSc | HGVSp | HGVSp Short | SWISSPROT | BIOTYPE | SIFT | PolyPhen | Tumor Sample Barcode | Tissue | Histology | Sex | Age | Stage | Therapy Types | Drugs | Outcome |
| NBR1 | SNV | Missense_Mutation | rs748165854 | c.2363N>C | p.Asn788Thr | p.N788T | Q14596 | protein_coding | tolerated(0.14) | benign(0) | TCGA-A2-A04Q-01 | Breast | breast invasive carcinoma | Female | <65 | I/II | Chemotherapy | adriamycin | SD |
| NBR1 | SNV | Missense_Mutation | rs778793245 | c.1510A>C | p.Thr504Pro | p.T504P | Q14596 | protein_coding | tolerated(0.24) | benign(0) | TCGA-BH-A0BS-01 | Breast | breast invasive carcinoma | Female | <65 | III/IV | Chemotherapy | adriamycin | CR |
| NBR1 | SNV | Missense_Mutation | c.487N>A | p.Glu163Lys | p.E163K | Q14596 | protein_coding | deleterious(0) | probably_damaging(0.996) | TCGA-BH-A0W7-01 | Breast | breast invasive carcinoma | Female | <65 | I/II | Chemotherapy | taxotere | CR | |
| NBR1 | SNV | Missense_Mutation | c.1652N>T | p.Ser551Phe | p.S551F | Q14596 | protein_coding | deleterious(0) | probably_damaging(0.999) | TCGA-D8-A1XY-01 | Breast | breast invasive carcinoma | Female | >=65 | I/II | Chemotherapy | tamoxiphen | SD | |
| NBR1 | insertion | Nonsense_Mutation | novel | c.1602_1603insTAGTAGAAACAGGGTTTCACCGTGTTAGCCAGGATGGTCT | p.Pro535Ter | p.P535* | Q14596 | protein_coding | TCGA-A8-A08H-01 | Breast | breast invasive carcinoma | Female | >=65 | I/II | Unknown | Unknown | SD | ||
| NBR1 | insertion | Nonsense_Mutation | novel | c.1670_1671insTGGCTAAAACTAAAAGAACCCACTCATAGCTGGTTGTTTT | p.Gln558GlyfsTer2 | p.Q558Gfs*2 | Q14596 | protein_coding | TCGA-A8-A08S-01 | Breast | breast invasive carcinoma | Female | >=65 | I/II | Hormone Therapy | anastrozole | SD | ||
| NBR1 | insertion | Frame_Shift_Ins | novel | c.2281_2282insGCAACAGAGTGAGACTCCATCTCAAATCAATC | p.Glu761GlyfsTer46 | p.E761Gfs*46 | Q14596 | protein_coding | TCGA-BH-A0EE-01 | Breast | breast invasive carcinoma | Female | >=65 | I/II | Chemotherapy | docetaxel | SD | ||
| NBR1 | deletion | Frame_Shift_Del | novel | c.290delN | p.Val97GlufsTer6 | p.V97Efs*6 | Q14596 | protein_coding | TCGA-D8-A27V-01 | Breast | breast invasive carcinoma | Female | <65 | I/II | Hormone Therapy | tamoxiphen | SD | ||
| NBR1 | SNV | Missense_Mutation | c.1278N>C | p.Lys426Asn | p.K426N | Q14596 | protein_coding | deleterious(0.02) | benign(0.239) | TCGA-DR-A0ZM-01 | Cervix | cervical & endocervical cancer | Female | <65 | III/IV | Unspecific | Cisplatin | SD | |
| NBR1 | SNV | Missense_Mutation | c.1841N>T | p.Ala614Val | p.A614V | Q14596 | protein_coding | tolerated(0.14) | benign(0.054) | TCGA-EK-A2PL-01 | Cervix | cervical & endocervical cancer | Female | <65 | III/IV | Unknown | Unknown | SD |
| Page: 1 2 3 4 5 6 7 8 9 |
Top |
Related drugs of malignant transformation related genes |
| Identification of chemicals and drugs interact with genes involved in malignant transfromation |
| (DGIdb 4.0) |
| Entrez ID | Symbol | Category | Interaction Types | Drug Claim Name | Drug Name | PMIDs |
| Page: 1 |

Copyright 2023-Present -The University of Texas Health Science Center at Houston |