
|
|||||
|
 | |
| |
| |
| |
| |
| |
|
Gene: MUC3A |
Gene summary for MUC3A |
| Gene information | Species | Human | Gene symbol | MUC3A | Gene ID | 4584 |
| Gene name | mucin 3A, cell surface associated | |
| Gene Alias | MUC-3A | |
| Cytomap | 7q22.1 | |
| Gene Type | protein-coding | GO ID | GO:0005575 | UniProtAcc | Q02505 |
Top |
Malignant transformation analysis |
| Identification of the aberrant gene expression in precancerous and cancerous lesions by comparing the gene expression of stem-like cells in diseased tissues with normal stem cells |
| Entrez ID | Symbol | Replicates | Species | Organ | Tissue | Adj P-value | Log2FC | Malignancy |
| 4584 | MUC3A | Pat01-B | Human | Stomach | GC | 9.82e-51 | 8.57e-01 | 0.5754 |
| 4584 | MUC3A | Pat02-B | Human | Stomach | GC | 1.06e-16 | 3.27e-01 | 0.0368 |
| 4584 | MUC3A | Pat03-B | Human | Stomach | GC | 1.13e-32 | 6.50e-01 | 0.3693 |
| 4584 | MUC3A | Pat04-B | Human | Stomach | GC | 1.42e-03 | 1.40e-01 | -0.1483 |
| 4584 | MUC3A | Pat05-B | Human | Stomach | GC | 7.60e-06 | 2.16e-01 | -0.0353 |
| 4584 | MUC3A | Pat07-B | Human | Stomach | GC | 5.16e-06 | 3.18e-01 | 0.0935 |
| 4584 | MUC3A | Pat09-B | Human | Stomach | GC | 1.10e-11 | 3.18e-01 | -0.0359 |
| 4584 | MUC3A | Pat10-B | Human | Stomach | GC | 1.37e-09 | 5.29e-01 | 0.084 |
| 4584 | MUC3A | Pat12-B | Human | Stomach | GC | 4.36e-27 | 5.88e-01 | 0.0325 |
| 4584 | MUC3A | Pat13-B | Human | Stomach | GC | 6.01e-10 | 3.42e-01 | 0.0555 |
| 4584 | MUC3A | Pat16-B | Human | Stomach | GC | 1.39e-14 | 3.74e-01 | 0.1918 |
| 4584 | MUC3A | Pat17-B | Human | Stomach | GC | 1.22e-15 | 4.74e-01 | 0.3109 |
| 4584 | MUC3A | Pat18-B | Human | Stomach | GC | 4.47e-03 | 1.42e-01 | -0.0432 |
| 4584 | MUC3A | Pat19-B | Human | Stomach | GC | 2.79e-11 | 3.31e-01 | 0.0826 |
| 4584 | MUC3A | Pat22-B | Human | Stomach | GC | 4.38e-03 | 9.48e-02 | -0.1042 |
| Page: 1 2 3 |
| Tissue | Expression Dynamics | Abbreviation |
| Colorectum (GSE201348) |  | FAP: Familial adenomatous polyposis |
| CRC: Colorectal cancer | ||
| Colorectum (HTA11) |  | AD: Adenomas |
| SER: Sessile serrated lesions | ||
| MSI-H: Microsatellite-high colorectal cancer | ||
| MSS: Microsatellite stable colorectal cancer | ||
| Esophagus | 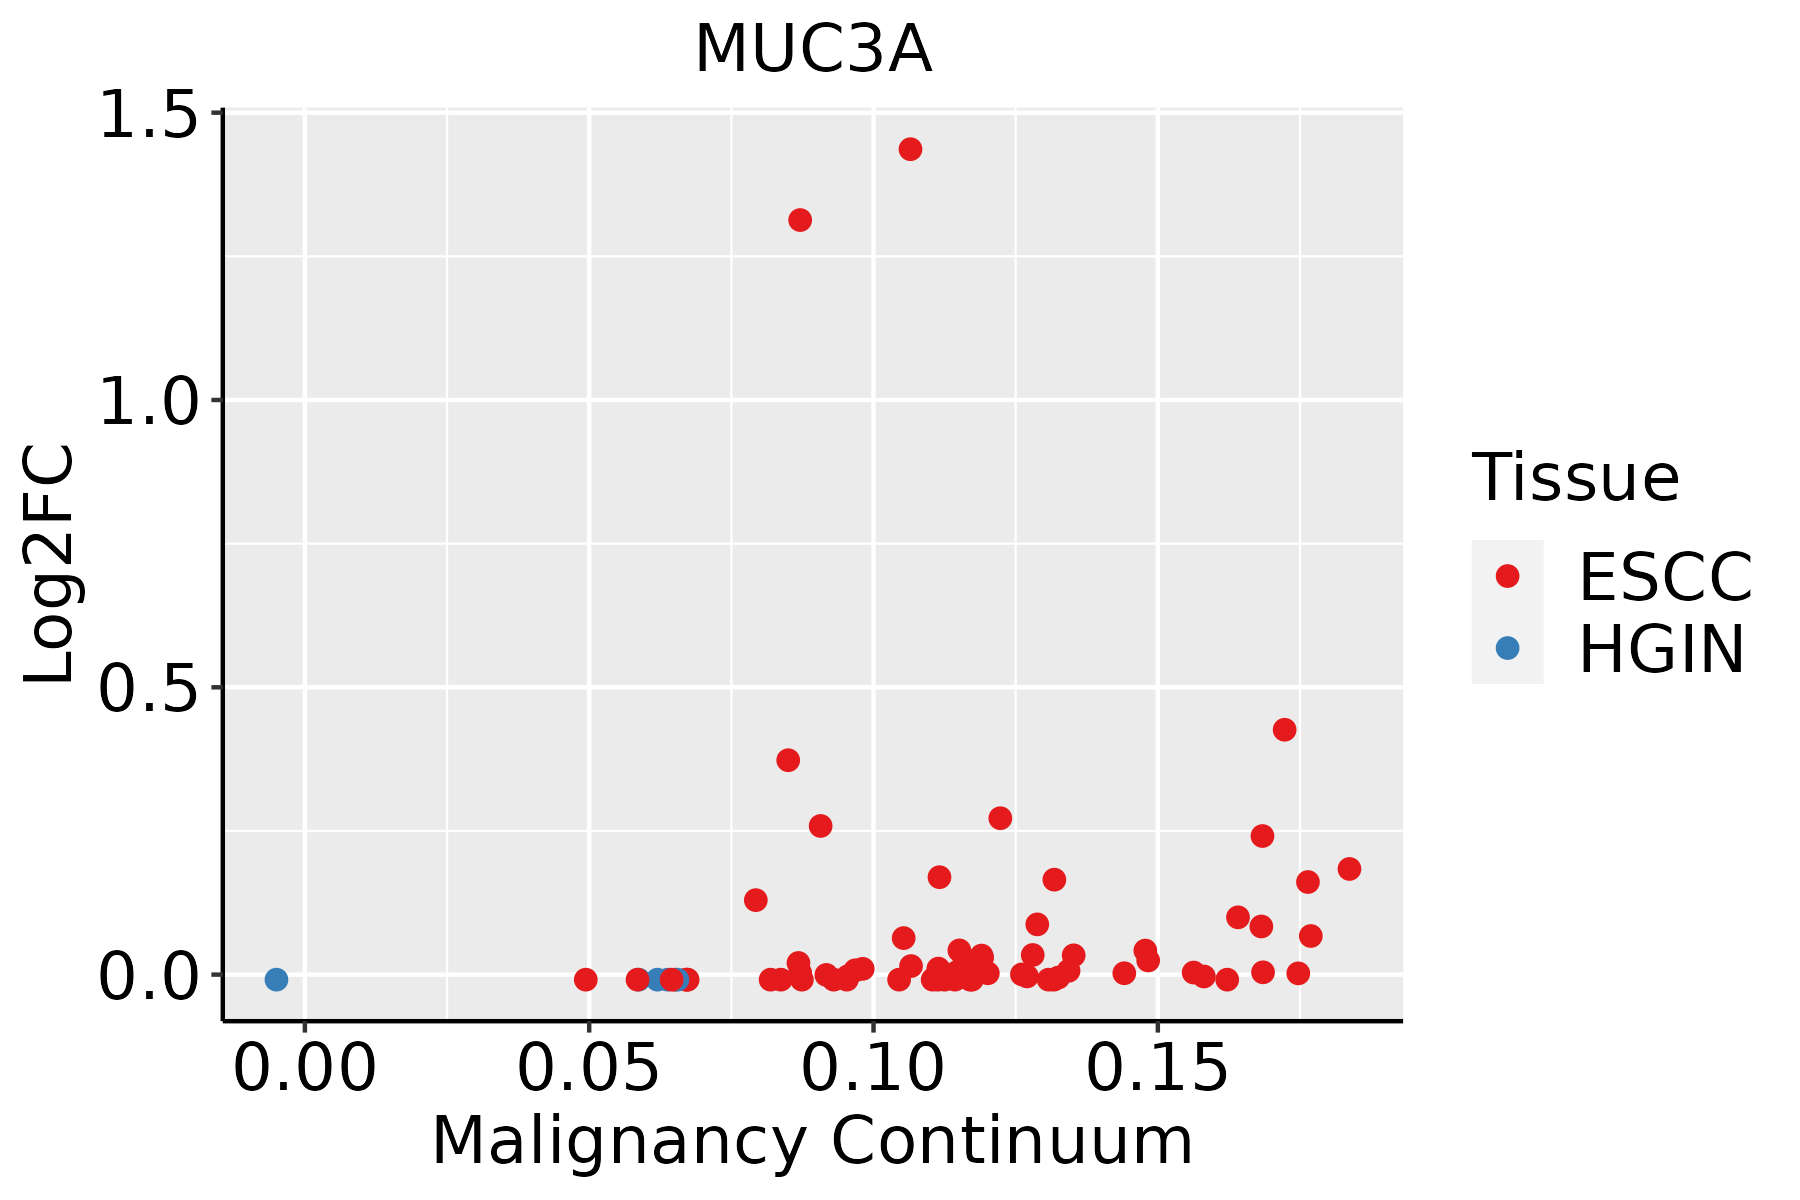 | ESCC: Esophageal squamous cell carcinoma |
| HGIN: High-grade intraepithelial neoplasias | ||
| LGIN: Low-grade intraepithelial neoplasias | ||
| GC | 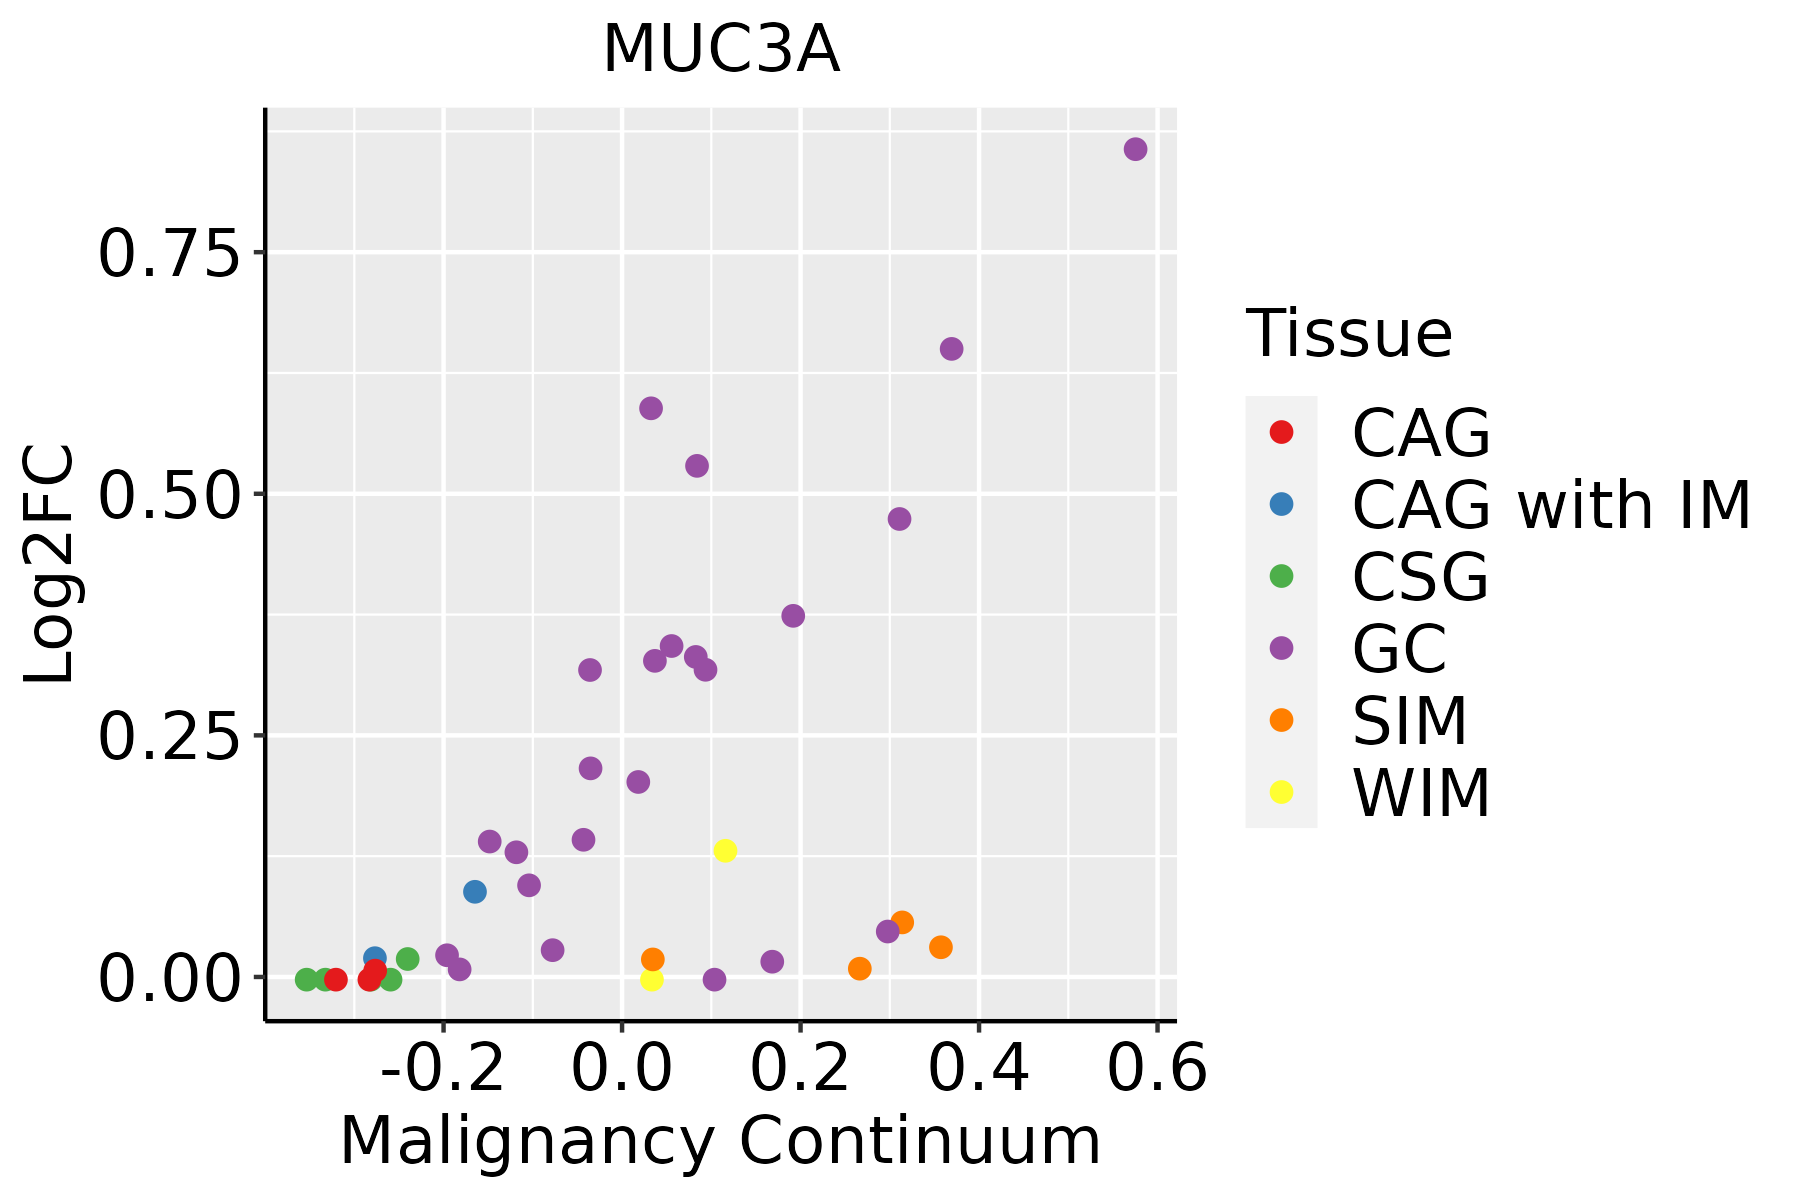 | CAG: Chronic atrophic gastritis |
| CAG with IM: Chronic atrophic gastritis with intestinal metaplasia | ||
| CSG: Chronic superficial gastritis | ||
| GC: Gastric cancer | ||
| SIM: Severe intestinal metaplasia | ||
| WIM: Wild intestinal metaplasia |
| ∗log2FC in expression of this searched gene in stem-like cells from each diseased tissue sample relative to stem-like cells in normal samples in each tissue plotted against the malignancy continuum. Samples are colored based on if they are from different disease stage. |
Top |
Malignant transformation related pathway analysis |
| Find out the enriched GO biological processes and KEGG pathways involved in transition from healthy to precancer to cancer |
| Tissue | Disease Stage | Enriched GO biological Processes |
| Colorectum | AD |  |
| Colorectum | SER |  |
| Colorectum | MSS |  |
| Colorectum | MSI-H |  |
| Colorectum | FAP |  |
| ∗Top 15 enriched GO BP terms are showed in the bar plot of each disease state in each tissue. Each row represents a significant GO biological process which is colored according to the -log10(p.adjust). |
| Page: 1 2 3 4 5 6 7 8 9 |
| GO ID | Tissue | Disease Stage | Description | Gene Ratio | Bg Ratio | pvalue | p.adjust | Count |
| Page: 1 |
| Pathway ID | Tissue | Disease Stage | Description | Gene Ratio | Bg Ratio | pvalue | p.adjust | qvalue | Count |
| Page: 1 |
Top |
Cell-cell communication analysis |
| Identification of potential cell-cell interactions between two cell types and their ligand-receptor pairs for different disease states |
| Ligand | Receptor | LRpair | Pathway | Tissue | Disease Stage |
| Page: 1 |
Top |
Single-cell gene regulatory network inference analysis |
| Find out the significant the regulons (TFs) and the target genes of each regulon across cell types for different disease states |
| TF | Cell Type | Tissue | Disease Stage | Target Gene | RSS | Regulon Activity |
| ∗The dot plots of a searched regulon are shown for all cell subpopulations in each disease state of each tissue based on the regulon specific score inferred using pySCENIC and by calculating the average expression. |
| Page: 1 |
Top |
Somatic mutation of malignant transformation related genes |
| Annotation of somatic variants for genes involved in malignant transformation |
| Hugo Symbol | Variant Class | Variant Classification | dbSNP RS | HGVSc | HGVSp | HGVSp Short | SWISSPROT | BIOTYPE | SIFT | PolyPhen | Tumor Sample Barcode | Tissue | Histology | Sex | Age | Stage | Therapy Types | Drugs | Outcome |
| MUC3A | SNV | Missense_Mutation | novel | c.9826G>A | p.Glu3276Lys | p.E3276K | Q02505 | protein_coding | tolerated_low_confidence(0.11) | benign(0.389) | TCGA-A2-A0CX-01 | Breast | breast invasive carcinoma | Female | <65 | I/II | Chemotherapy | adriamycin | SD |
| MUC3A | SNV | Missense_Mutation | novel | c.8342N>T | p.Ser2781Phe | p.S2781F | Q02505 | protein_coding | deleterious_low_confidence(0) | probably_damaging(0.979) | TCGA-A8-A08J-01 | Breast | breast invasive carcinoma | Female | <65 | III/IV | Unknown | Unknown | PD |
| MUC3A | SNV | Missense_Mutation | novel | c.8003N>G | p.Thr2668Arg | p.T2668R | Q02505 | protein_coding | deleterious_low_confidence(0) | possibly_damaging(0.857) | TCGA-A8-A09M-01 | Breast | breast invasive carcinoma | Female | >=65 | III/IV | Chemotherapy | paclitaxel | CR |
| MUC3A | SNV | Missense_Mutation | novel | c.7985C>T | p.Ser2662Phe | p.S2662F | Q02505 | protein_coding | deleterious_low_confidence(0) | possibly_damaging(0.721) | TCGA-A8-A09T-01 | Breast | breast invasive carcinoma | Female | >=65 | I/II | Hormone Therapy | anastrozole | SD |
| MUC3A | SNV | Missense_Mutation | novel | c.7778N>T | p.Ser2593Phe | p.S2593F | Q02505 | protein_coding | deleterious_low_confidence(0.03) | benign(0) | TCGA-AN-A0AK-01 | Breast | breast invasive carcinoma | Female | >=65 | I/II | Unknown | Unknown | SD |
| MUC3A | SNV | Missense_Mutation | novel | c.1115N>T | p.Ser372Phe | p.S372F | Q02505 | protein_coding | deleterious_low_confidence(0.01) | unknown(0) | TCGA-AN-A0FJ-01 | Breast | breast invasive carcinoma | Female | <65 | III/IV | Unknown | Unknown | SD |
| MUC3A | SNV | Missense_Mutation | novel | c.4718N>T | p.Thr1573Ile | p.T1573I | Q02505 | protein_coding | tolerated_low_confidence(0.12) | unknown(0) | TCGA-AN-A0FJ-01 | Breast | breast invasive carcinoma | Female | <65 | III/IV | Unknown | Unknown | SD |
| MUC3A | SNV | Missense_Mutation | novel | c.5768G>T | p.Arg1923Ile | p.R1923I | Q02505 | protein_coding | tolerated_low_confidence(0.26) | unknown(0) | TCGA-BH-A0B3-01 | Breast | breast invasive carcinoma | Female | <65 | I/II | Chemotherapy | cyclophosphamide | SD |
| MUC3A | SNV | Missense_Mutation | novel | c.8045N>T | p.Trp2682Leu | p.W2682L | Q02505 | protein_coding | tolerated_low_confidence(0.88) | benign(0) | TCGA-EW-A1PC-01 | Breast | breast invasive carcinoma | Female | >=65 | I/II | Hormone Therapy | tamoxiphen | SD |
| MUC3A | SNV | Missense_Mutation | rs753787832 | c.7940C>T | p.Ser2647Leu | p.S2647L | Q02505 | protein_coding | deleterious_low_confidence(0.01) | benign(0.015) | TCGA-PE-A5DE-01 | Breast | breast invasive carcinoma | Female | <65 | I/II | Chemotherapy | taxotere | CR |
| Page: 1 2 3 4 5 6 7 8 9 10 11 12 13 14 15 16 17 18 19 20 21 22 23 24 |
Top |
Related drugs of malignant transformation related genes |
| Identification of chemicals and drugs interact with genes involved in malignant transfromation |
| (DGIdb 4.0) |
| Entrez ID | Symbol | Category | Interaction Types | Drug Claim Name | Drug Name | PMIDs |
| Page: 1 |

Copyright 2023-Present -The University of Texas Health Science Center at Houston |