Schematic overview of the cellular and molecular mechanisms involved in the cancer progression, including the proposed cellular and molecular mechanisms in cancer cells trajectory. AT1: alveolar type 1 cells; AT2: alveolar type 2 cells; AAH: atypical adenomatous hyperplasia; AIS: adenocarcinoma in situ; MIA: minimally invasive adenocarcinoma; IA: invasive adenocarcinoma; EMT: epithelial-mesenchymal transition

Home

Download

Statistics

Help

Contact

Center for Computational Systems Medicine
leaf

Gene summary

leaf

Malignant transformation analysis

leaf

Malignant transformation related pathway analysis

leaf

Cell-cell communication analysis

leaf

Single-cell gene regulatory network inference analysis

leaf

Somatic mutation of malignant transformation related genes

leaf

Related drugs of malignant transformation related genes

Gene: MTCH1

Gene summary for MTCH1

check button Gene summary.

Gene informationSpeciesHuman
Gene symbol

MTCH1

Gene ID

23787

Gene namemitochondrial carrier 1
Gene AliasCGI-64
Cytomap6p21.2
Gene Typeprotein-coding
GO ID

GO:0006508

UniProtAcc

A0A024RCX4


Top

Malignant transformation analysis

check button Identification of the aberrant gene expression in precancerous and cancerous lesions by comparing the gene expression of stem-like cells in diseased tissues with normal stem cells
check button Malignant transformation involving gene list.
Entrez IDSymbolReplicatesSpeciesOrganTissueAdj P-valueLog2FCMalignancy
23787MTCH1GSM6177620_NYU_UCEC1_lib2_lib2HumanEndometriumEEC7.37e-33-1.87e-01-0.1875
23787MTCH1GSM6177620_NYU_UCEC1_lib3_lib3HumanEndometriumEEC8.82e-30-2.06e-01-0.1883
23787MTCH1GSM6177621_NYU_UCEC2_lib1_lib1HumanEndometriumEEC1.77e-28-1.73e-01-0.1934
23787MTCH1GSM6177622_NYU_UCEC3_lib1_lib1HumanEndometriumEEC2.22e-47-1.58e-01-0.1917
23787MTCH1GSM6177622_NYU_UCEC3_lib2_lib2HumanEndometriumEEC5.04e-50-3.04e-01-0.1916
23787MTCH1GSM6177623_NYU_UCEC3_VisHumanEndometriumEEC4.35e-03-3.46e-02-0.1269
23787MTCH1LZE2THumanEsophagusESCC1.24e-101.87e+000.082
23787MTCH1LZE4THumanEsophagusESCC2.36e-155.19e-010.0811
23787MTCH1LZE5THumanEsophagusESCC6.97e-045.44e-010.0514
23787MTCH1LZE7THumanEsophagusESCC1.33e-082.15e-010.0667
23787MTCH1LZE8THumanEsophagusESCC2.90e-04-6.29e-020.067
23787MTCH1LZE20THumanEsophagusESCC8.17e-169.43e-010.0662
23787MTCH1LZE22D1HumanEsophagusHGIN4.76e-041.70e-010.0595
23787MTCH1LZE22THumanEsophagusESCC3.47e-121.61e+000.068
23787MTCH1LZE24THumanEsophagusESCC8.68e-301.19e+000.0596
23787MTCH1LZE21THumanEsophagusESCC3.12e-036.37e-010.0655
23787MTCH1LZE6THumanEsophagusESCC1.18e-03-1.29e-010.0845
23787MTCH1P1T-EHumanEsophagusESCC5.19e-191.32e+000.0875
23787MTCH1P2T-EHumanEsophagusESCC5.62e-701.36e+000.1177
23787MTCH1P4T-EHumanEsophagusESCC1.41e-561.58e+000.1323
Page: 1 2 3 4 5 6 7 8 9 10 

check button Transcriptomic changes along malignancy continuum.
TissueExpression DynamicsAbbreviation
Colorectum (GSE201348)The image shows the transcriptomic changes along malignancy continuum.log2FC in expression of this searched gene in stem-like cells from each diseased tissue sample relative to stem-like cells in normal samples in each tissue plotted against the malignancy continuum. Samples are colored based on if they are from different disease stage.FAP: Familial adenomatous polyposis
CRC: Colorectal cancer
Colorectum (HTA11)The image shows the transcriptomic changes along malignancy continuum.log2FC in expression of this searched gene in stem-like cells from each diseased tissue sample relative to stem-like cells in normal samples in each tissue plotted against the malignancy continuum. Samples are colored based on if they are from different disease stage.AD: Adenomas
SER: Sessile serrated lesions
MSI-H: Microsatellite-high colorectal cancer
MSS: Microsatellite stable colorectal cancer
EndometriumThe image shows the transcriptomic changes along malignancy continuum.log2FC in expression of this searched gene in stem-like cells from each diseased tissue sample relative to stem-like cells in normal samples in each tissue plotted against the malignancy continuum. Samples are colored based on if they are from different disease stage.
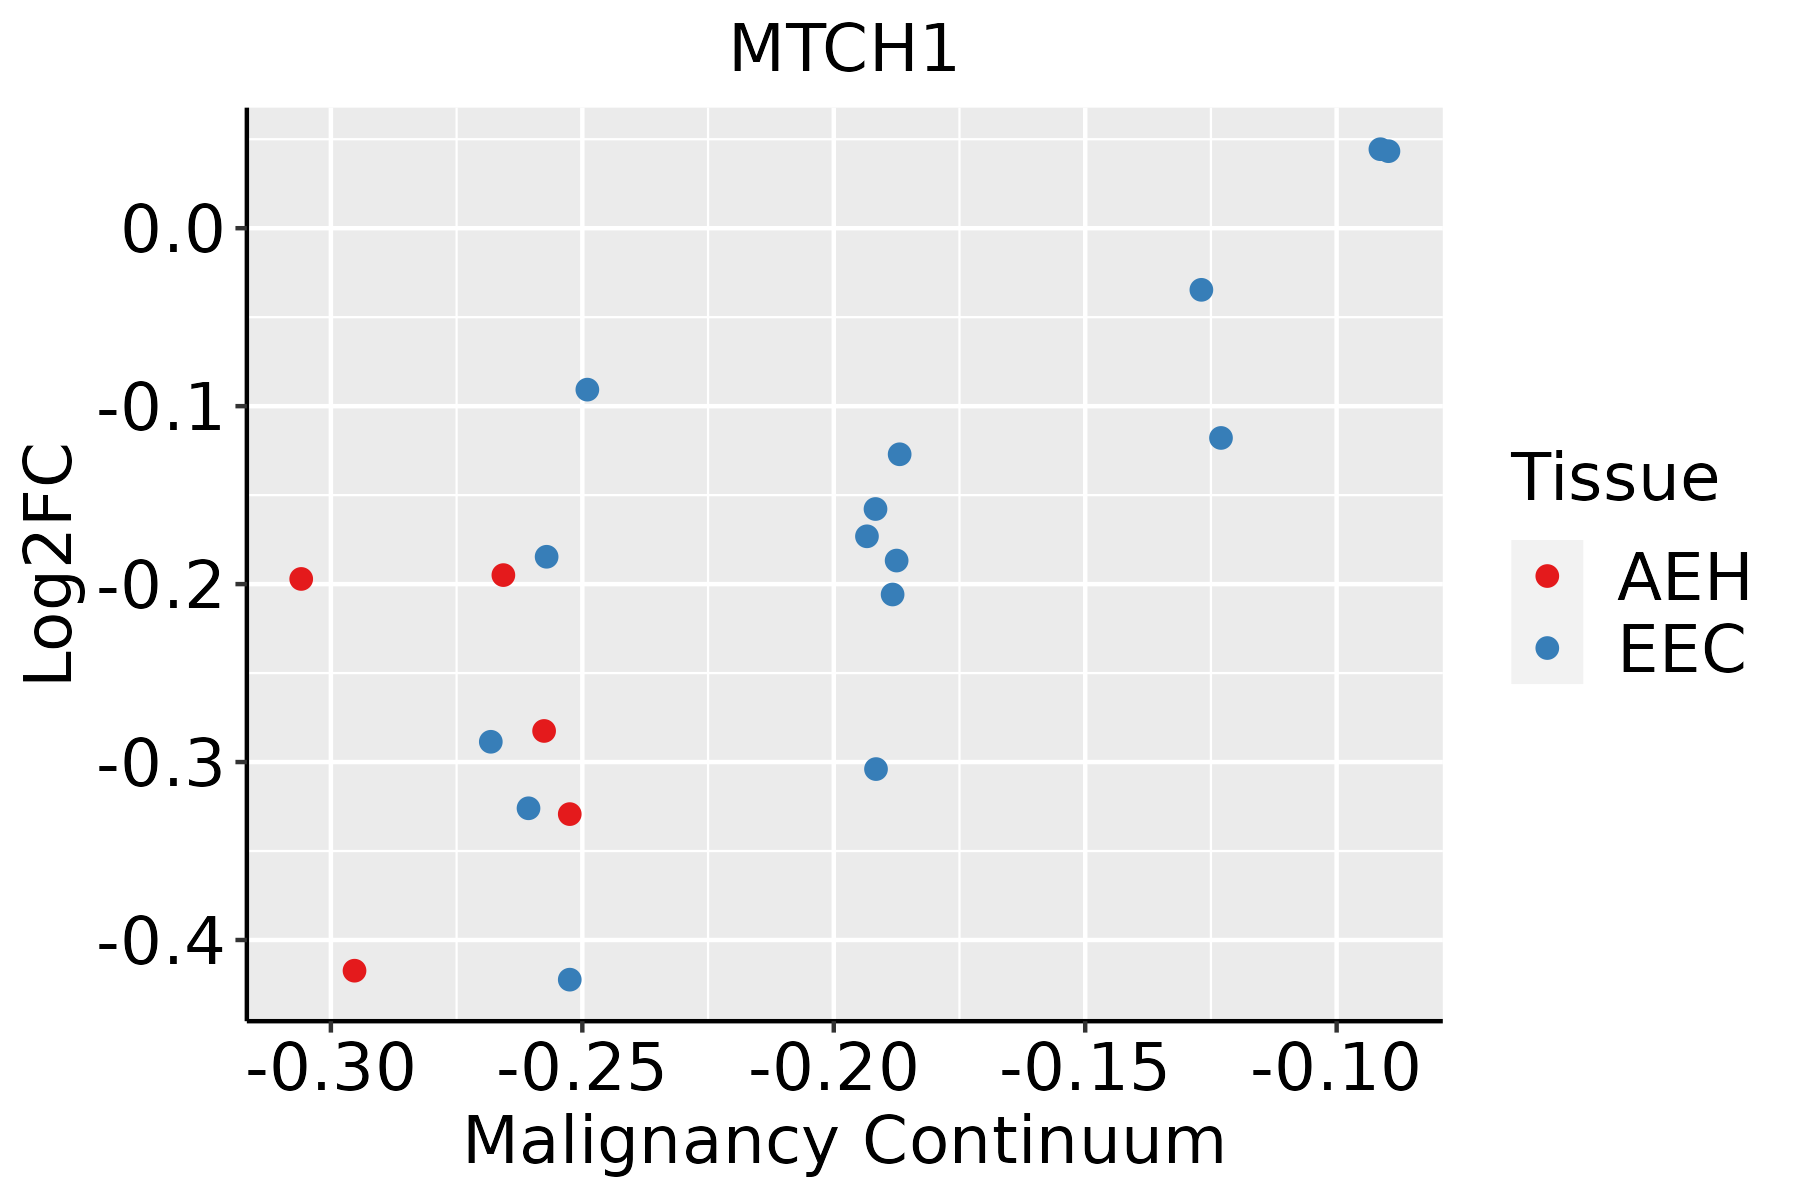
AEH: Atypical endometrial hyperplasia
EEC: Endometrioid Cancer
EsophagusThe image shows the transcriptomic changes along malignancy continuum.log2FC in expression of this searched gene in stem-like cells from each diseased tissue sample relative to stem-like cells in normal samples in each tissue plotted against the malignancy continuum. Samples are colored based on if they are from different disease stage.
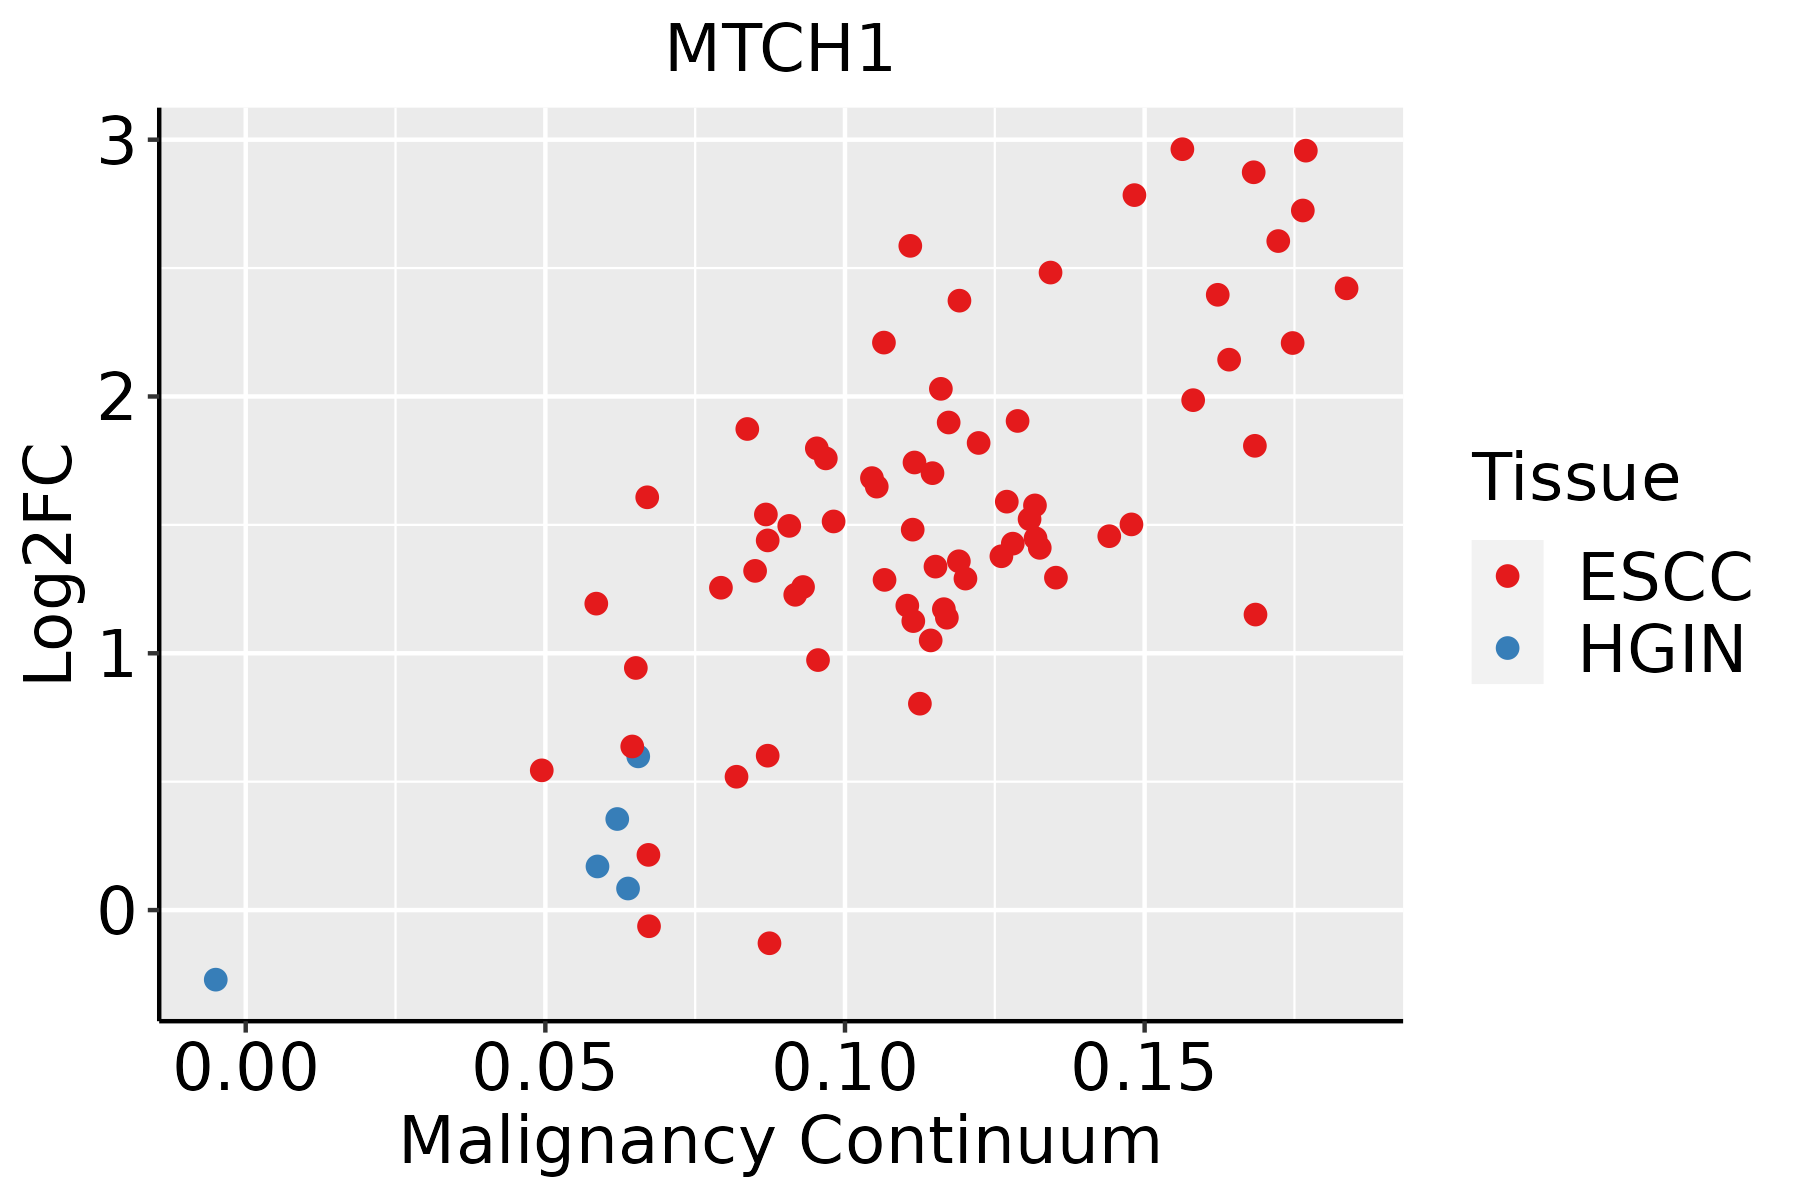
ESCC: Esophageal squamous cell carcinoma
HGIN: High-grade intraepithelial neoplasias
LGIN: Low-grade intraepithelial neoplasias
LiverThe image shows the transcriptomic changes along malignancy continuum.log2FC in expression of this searched gene in stem-like cells from each diseased tissue sample relative to stem-like cells in normal samples in each tissue plotted against the malignancy continuum. Samples are colored based on if they are from different disease stage.HCC: Hepatocellular carcinoma
NAFLD: Non-alcoholic fatty liver disease
Oral CavityThe image shows the transcriptomic changes along malignancy continuum.log2FC in expression of this searched gene in stem-like cells from each diseased tissue sample relative to stem-like cells in normal samples in each tissue plotted against the malignancy continuum. Samples are colored based on if they are from different disease stage.
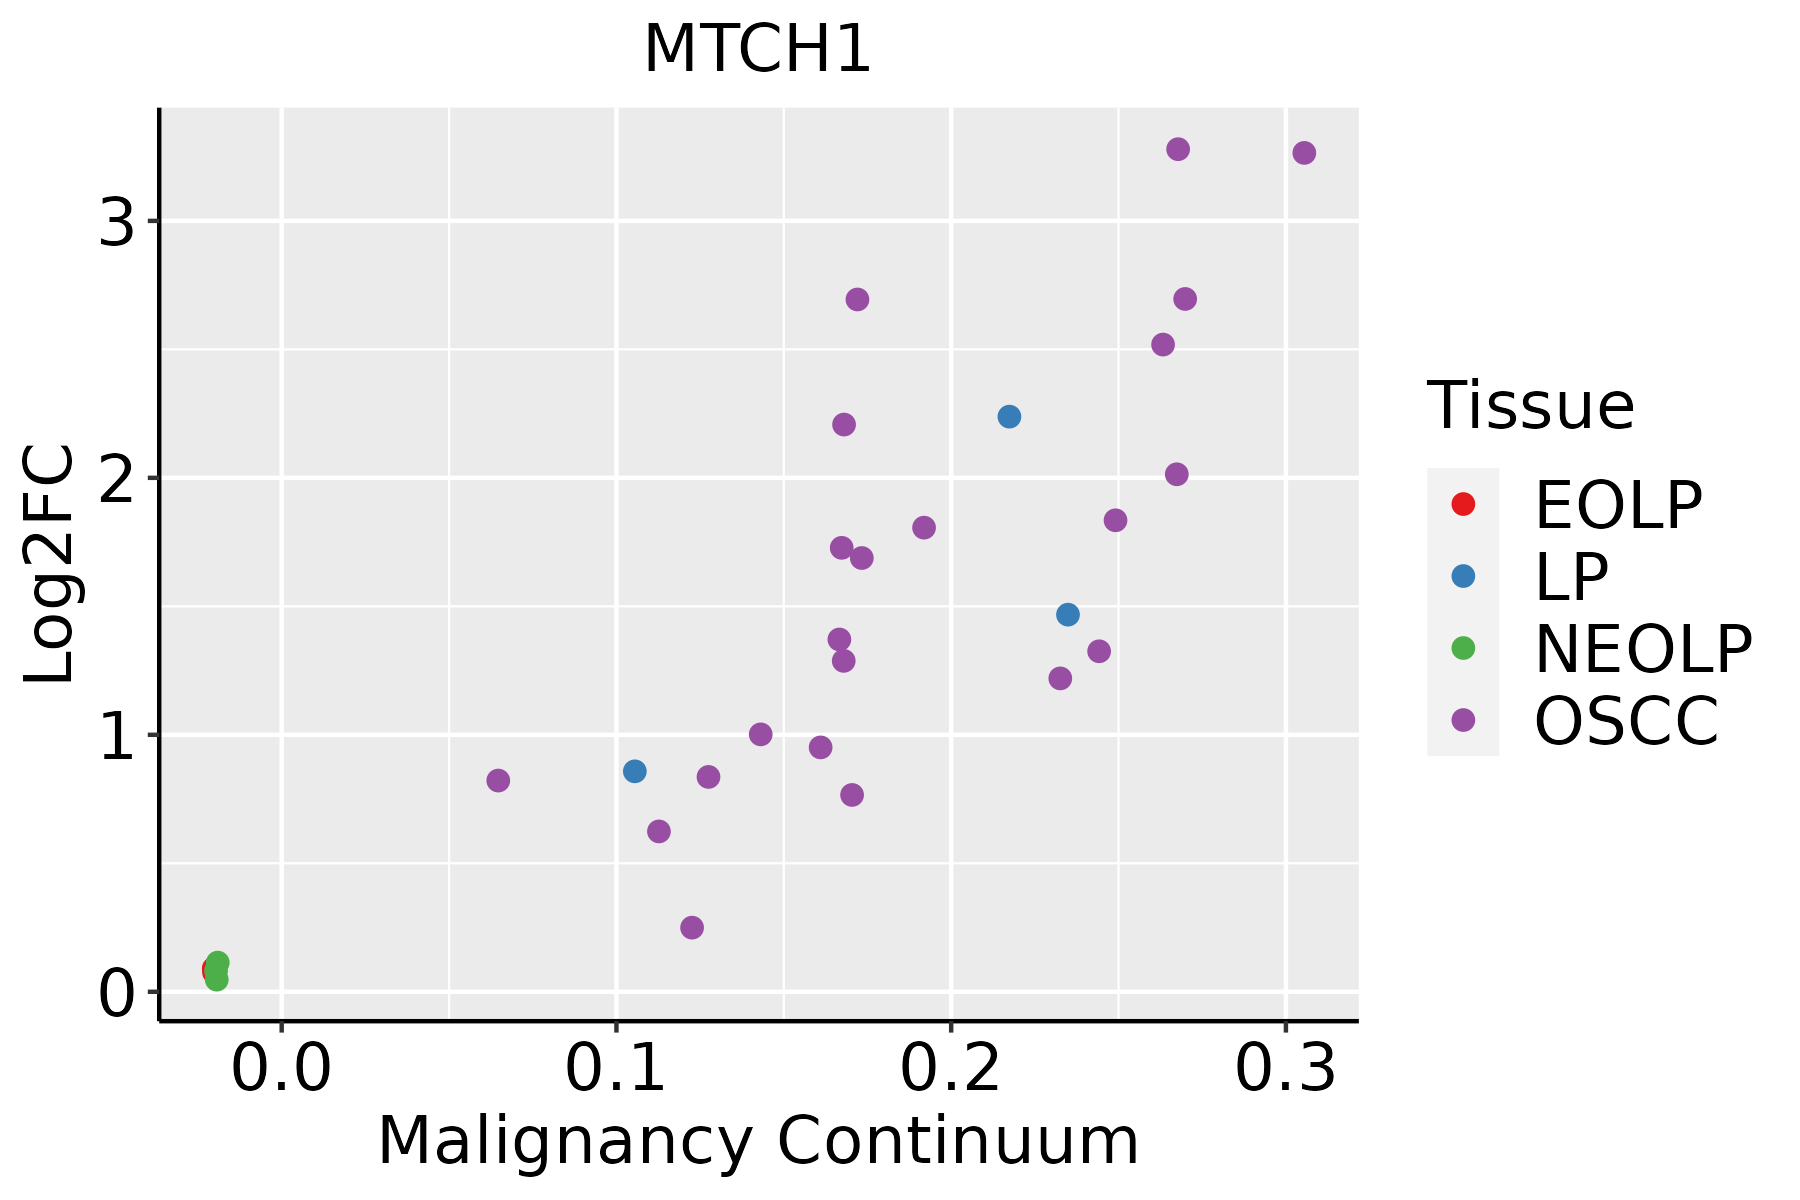
EOLP: Erosive Oral lichen planus
LP: leukoplakia
NEOLP: Non-erosive oral lichen planus
OSCC: Oral squamous cell carcinoma
ProstateThe image shows the transcriptomic changes along malignancy continuum.log2FC in expression of this searched gene in stem-like cells from each diseased tissue sample relative to stem-like cells in normal samples in each tissue plotted against the malignancy continuum. Samples are colored based on if they are from different disease stage.
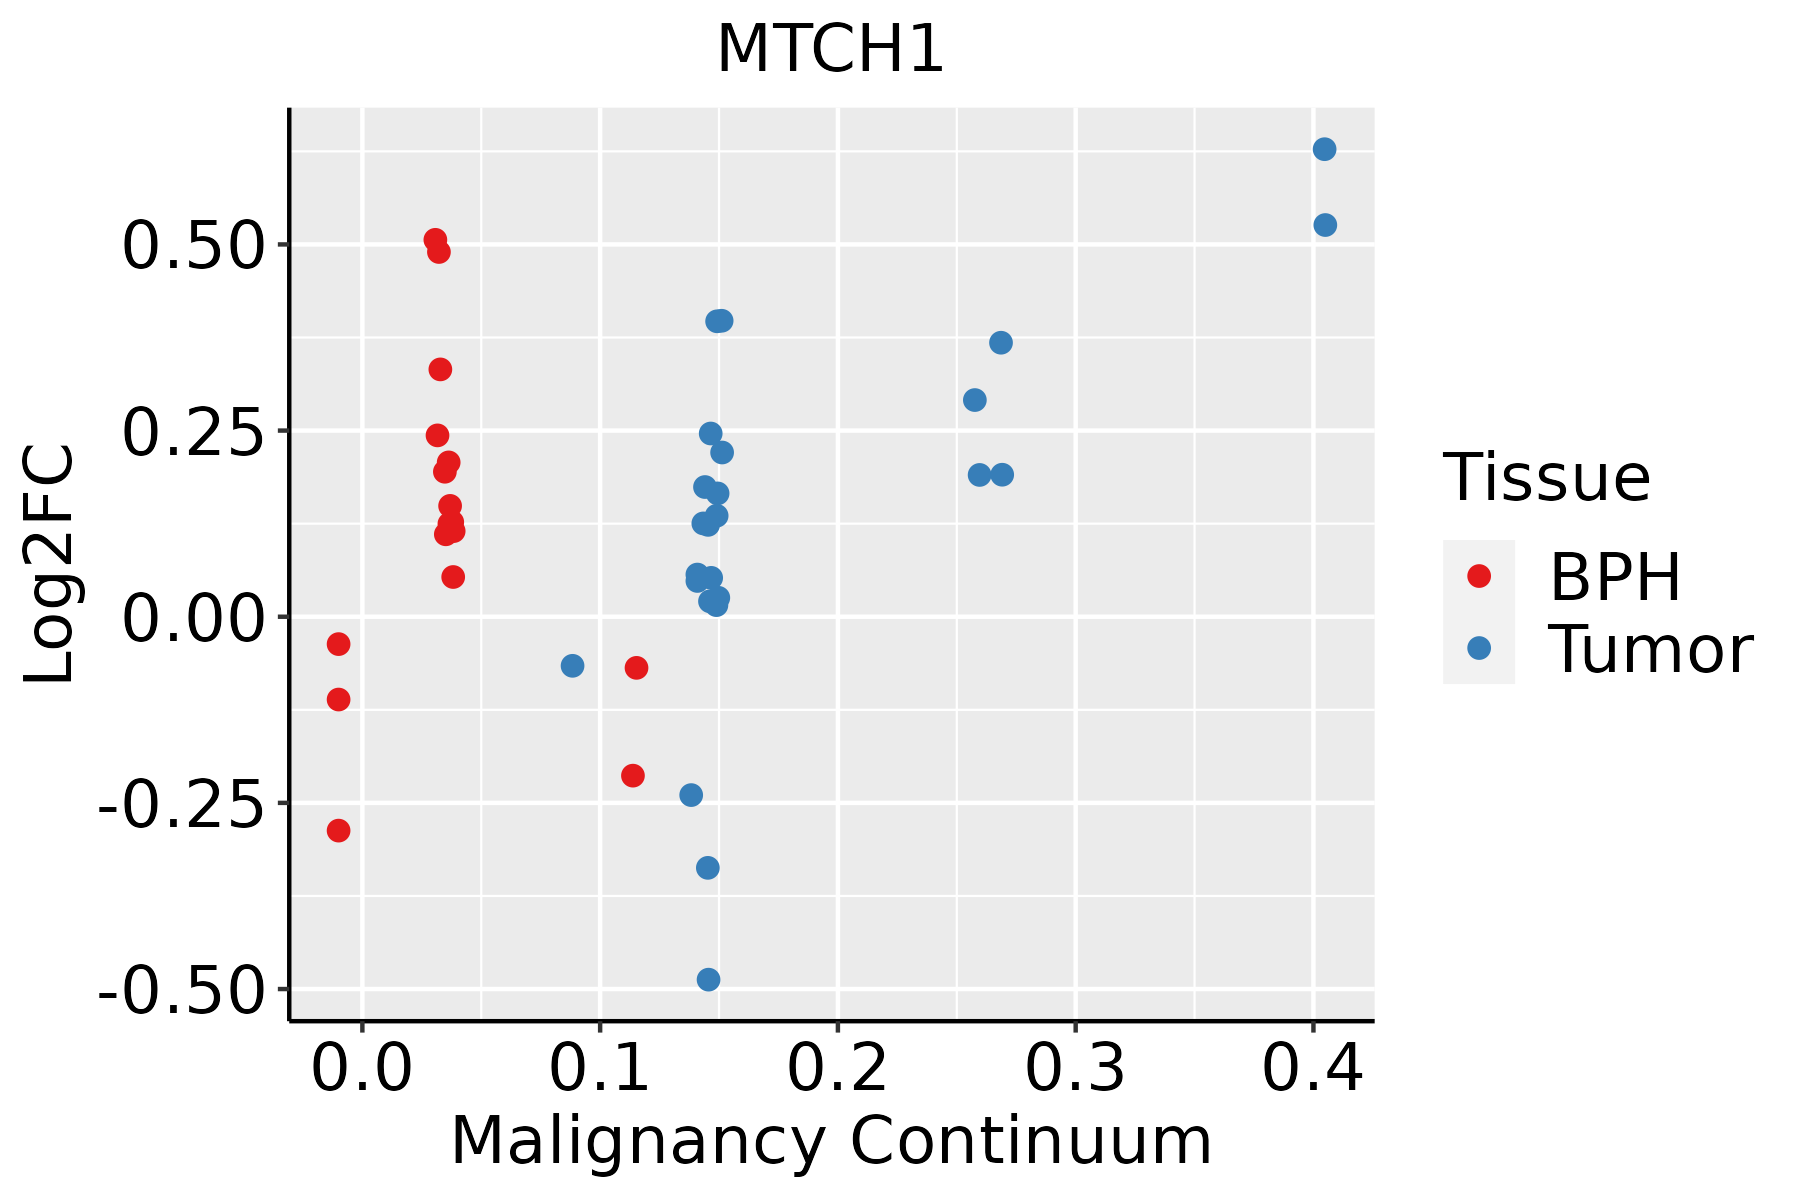
BPH: Benign Prostatic Hyperplasia
SkinThe image shows the transcriptomic changes along malignancy continuum.log2FC in expression of this searched gene in stem-like cells from each diseased tissue sample relative to stem-like cells in normal samples in each tissue plotted against the malignancy continuum. Samples are colored based on if they are from different disease stage.
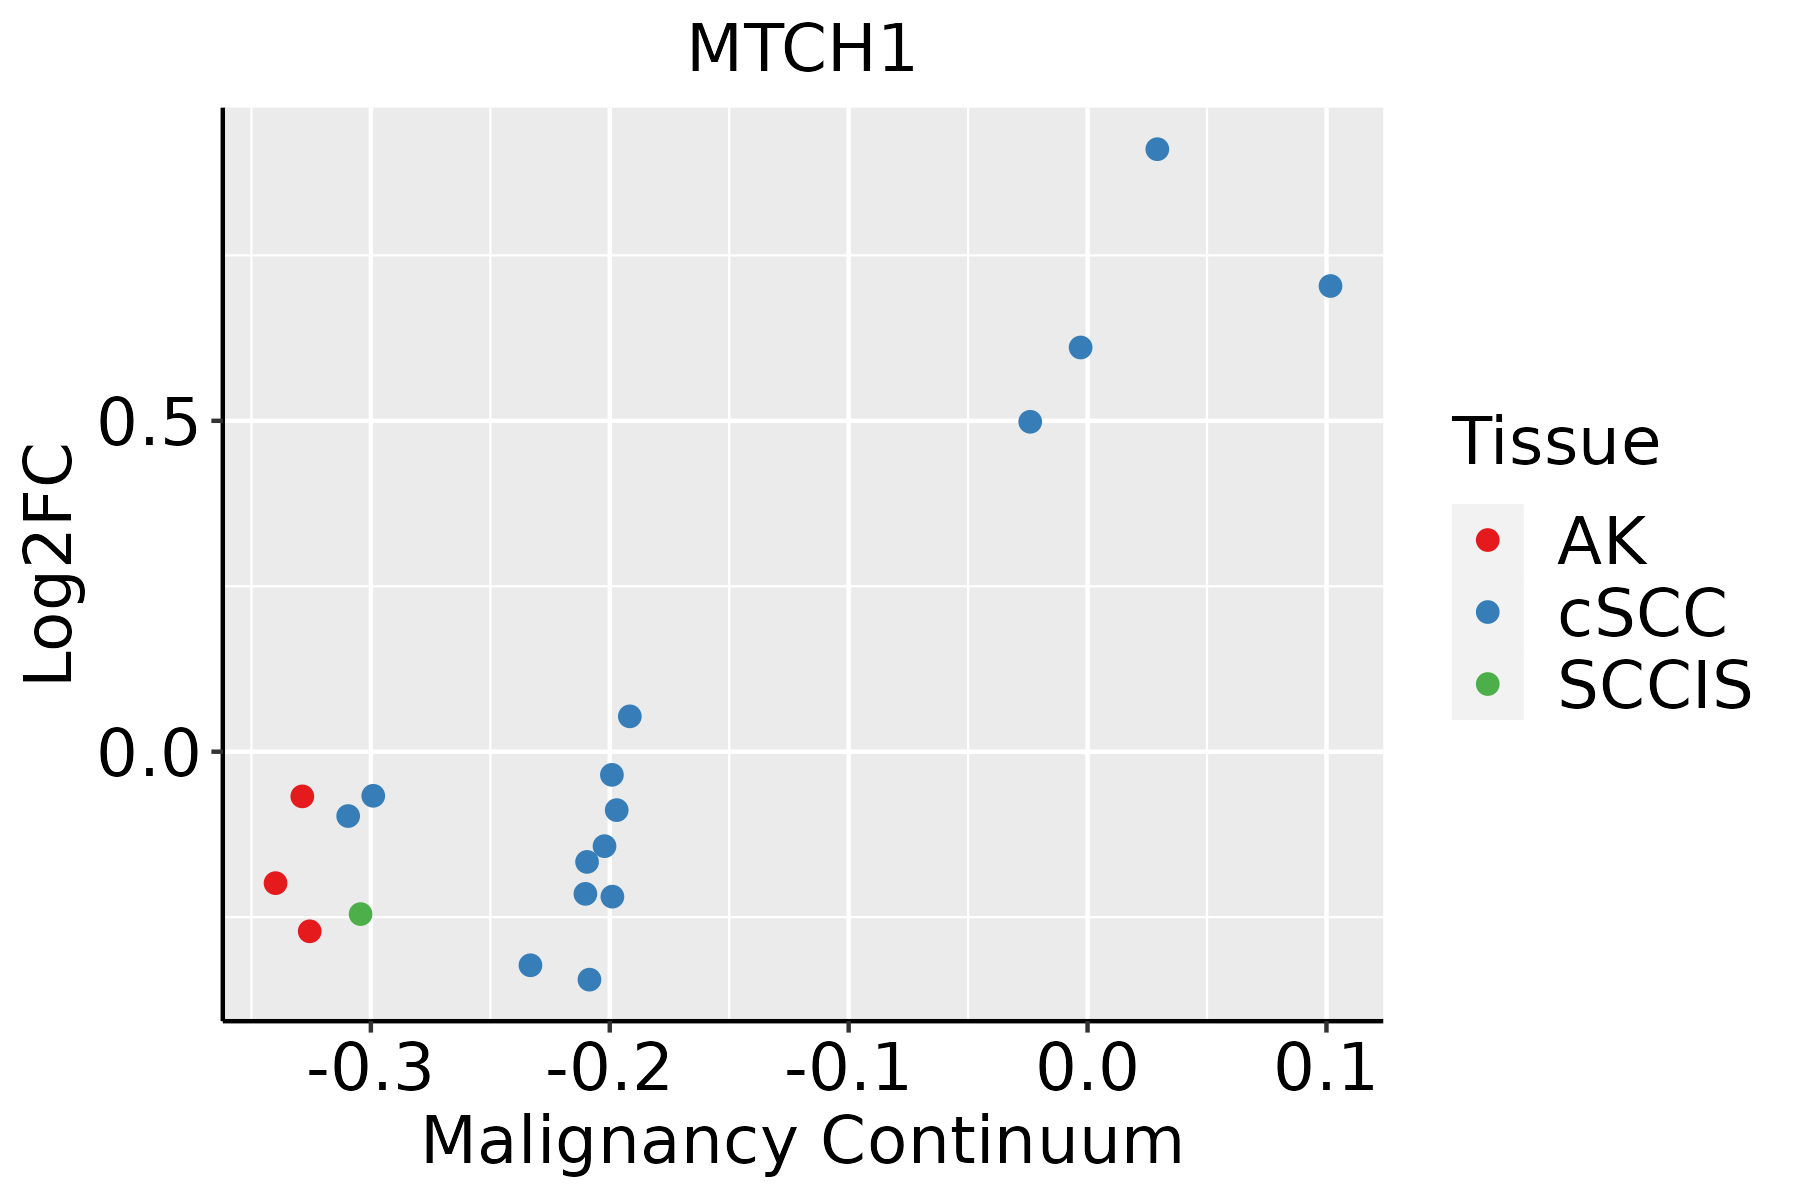
AK: Actinic keratosis
cSCC: Cutaneous squamous cell carcinoma
SCCIS:squamous cell carcinoma in situ
ThyroidThe image shows the transcriptomic changes along malignancy continuum.log2FC in expression of this searched gene in stem-like cells from each diseased tissue sample relative to stem-like cells in normal samples in each tissue plotted against the malignancy continuum. Samples are colored based on if they are from different disease stage.
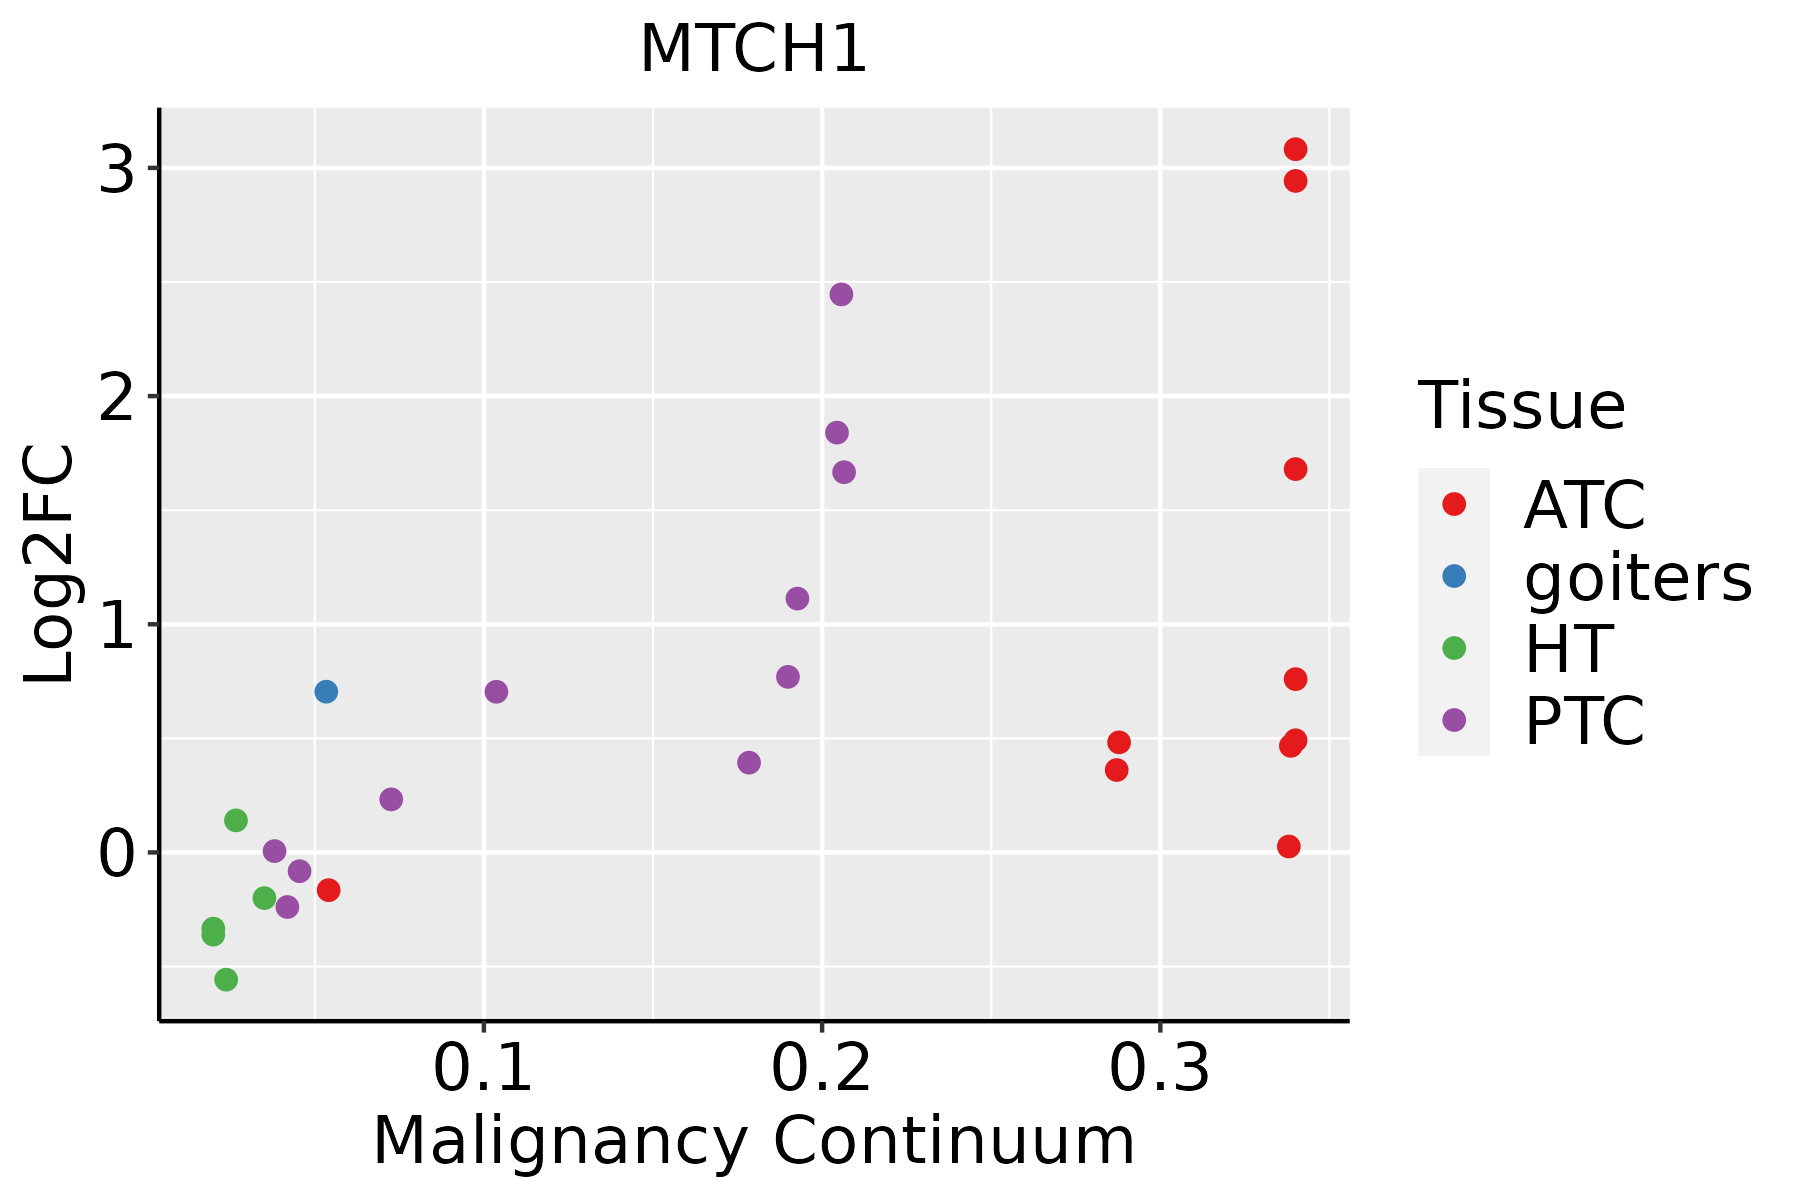
ATC: Anaplastic thyroid cancer
HT: Hashimoto's thyroiditis
PTC: Papillary thyroid cancer
∗log2FC in expression of this searched gene in stem-like cells from each diseased tissue sample relative to stem-like cells in normal samples in each tissue plotted against the malignancy continuum. Samples are colored based on if they are from different disease stage.

Top

Malignant transformation related pathway analysis

check buttonFind out the enriched GO biological processes and KEGG pathways involved in transition from healthy to precancer to cancer
check button Figure of enriched GO biological processes.
TissueDisease StageEnriched GO biological Processes
ColorectumADGO analysis - Figure of enriched GO biological processes: Top 15 enriched GO BP terms are showed in the bar plot of each disease state in each tissue. Each row represents a significant GO biological process which is colored according to the -log10(p.adjust).
ColorectumSERGO analysis - Figure of enriched GO biological processes: Top 15 enriched GO BP terms are showed in the bar plot of each disease state in each tissue. Each row represents a significant GO biological process which is colored according to the -log10(p.adjust).
ColorectumMSSGO analysis - Figure of enriched GO biological processes: Top 15 enriched GO BP terms are showed in the bar plot of each disease state in each tissue. Each row represents a significant GO biological process which is colored according to the -log10(p.adjust).
ColorectumMSI-HGO analysis - Figure of enriched GO biological processes: Top 15 enriched GO BP terms are showed in the bar plot of each disease state in each tissue. Each row represents a significant GO biological process which is colored according to the -log10(p.adjust).
ColorectumFAPGO analysis - Figure of enriched GO biological processes: Top 15 enriched GO BP terms are showed in the bar plot of each disease state in each tissue. Each row represents a significant GO biological process which is colored according to the -log10(p.adjust).
∗Top 15 enriched GO BP terms are showed in the bar plot of each disease state in each tissue. Each row represents a significant GO biological process which is colored according to the -log10(p.adjust).
Page: 1 2 3 4 5 6 7 8 9 

check button Enriched GO biological processes.
GO IDTissueDisease StageDescriptionGene RatioBg Ratiopvaluep.adjustCount
GO:0045862ColorectumADpositive regulation of proteolysis129/3918372/187234.04e-103.46e-08129
GO:0043281ColorectumADregulation of cysteine-type endopeptidase activity involved in apoptotic process72/3918209/187233.70e-061.03e-0472
GO:2000116ColorectumADregulation of cysteine-type endopeptidase activity79/3918235/187233.74e-061.03e-0479
GO:0052547ColorectumADregulation of peptidase activity137/3918461/187234.12e-061.12e-04137
GO:0010952ColorectumADpositive regulation of peptidase activity68/3918197/187236.30e-061.59e-0468
GO:0052548ColorectumADregulation of endopeptidase activity124/3918432/187236.58e-051.07e-03124
GO:0010950ColorectumADpositive regulation of endopeptidase activity59/3918179/187231.11e-041.65e-0359
GO:2001056ColorectumADpositive regulation of cysteine-type endopeptidase activity47/3918148/187231.30e-031.14e-0247
GO:0043280ColorectumADpositive regulation of cysteine-type endopeptidase activity involved in apoptotic process42/3918129/187231.33e-031.16e-0242
GO:00458621ColorectumSERpositive regulation of proteolysis106/2897372/187238.40e-111.20e-08106
GO:00525471ColorectumSERregulation of peptidase activity114/2897461/187231.18e-077.17e-06114
GO:00525481ColorectumSERregulation of endopeptidase activity103/2897432/187232.86e-061.16e-04103
GO:00109521ColorectumSERpositive regulation of peptidase activity55/2897197/187235.44e-062.00e-0455
GO:00432811ColorectumSERregulation of cysteine-type endopeptidase activity involved in apoptotic process57/2897209/187238.08e-062.74e-0457
GO:20001161ColorectumSERregulation of cysteine-type endopeptidase activity62/2897235/187231.05e-053.39e-0462
GO:00109501ColorectumSERpositive regulation of endopeptidase activity47/2897179/187231.32e-042.66e-0347
GO:00432801ColorectumSERpositive regulation of cysteine-type endopeptidase activity involved in apoptotic process33/2897129/187231.97e-031.97e-0233
GO:20010561ColorectumSERpositive regulation of cysteine-type endopeptidase activity36/2897148/187233.21e-032.76e-0236
GO:0006919ColorectumSERactivation of cysteine-type endopeptidase activity involved in apoptotic process21/289778/187236.50e-034.66e-0221
GO:00458622ColorectumMSSpositive regulation of proteolysis119/3467372/187232.14e-102.09e-08119
Page: 1 2 3 4 5 6 7 8 9 10 

check button Enriched KEGG pathways.
Pathway IDTissueDisease StageDescriptionGene RatioBg Ratiopvaluep.adjustqvalueCount
Page: 1 

Top

Cell-cell communication analysis

check buttonIdentification of potential cell-cell interactions between two cell types and their ligand-receptor pairs for different disease states
LigandReceptorLRpairPathwayTissueDisease Stage
Page: 1 

Top

Single-cell gene regulatory network inference analysis

check buttonFind out the significant the regulons (TFs) and the target genes of each regulon across cell types for different disease states
TFCell TypeTissueDisease StageTarget GeneRSSRegulon Activity
∗The dot plots of a searched regulon are shown for all cell subpopulations in each disease state of each tissue based on the regulon specific score inferred using pySCENIC and by calculating the average expression.
Page: 1 

Top

Somatic mutation of malignant transformation related genes

check buttonAnnotation of somatic variants for genes involved in malignant transformation
Hugo SymbolVariant ClassVariant ClassificationdbSNP RSHGVScHGVSpHGVSp ShortSWISSPROTBIOTYPESIFTPolyPhenTumor Sample BarcodeTissueHistologySexAgeStageTherapy TypesDrugsOutcome
MTCH1SNVMissense_Mutationc.1070T>Cp.Ile357Thrp.I357TQ9NZJ7protein_codingtolerated(0.11)possibly_damaging(0.702)TCGA-D8-A147-01Breastbreast invasive carcinomaFemale<65I/IIChemotherapydoxorubicineSD
MTCH1SNVMissense_Mutationc.901N>Gp.Ser301Alap.S301AQ9NZJ7protein_codingtolerated_low_confidence(0.12)benign(0.18)TCGA-D8-A1Y3-01Breastbreast invasive carcinomaFemale<65III/IVChemotherapydoxorubicine+cyclophosphamideSD
MTCH1insertionFrame_Shift_Insnovelc.961_962insCAGTACCAACCTTGGGTTCTCGTGTTCTGp.Val321AlafsTer11p.V321Afs*11Q9NZJ7protein_codingTCGA-A7-A0CD-01Breastbreast invasive carcinomaFemale>=65I/IIHormone TherapyarimidexSD
MTCH1SNVMissense_Mutationc.182N>Tp.Ser61Leup.S61LQ9NZJ7protein_codingdeleterious_low_confidence(0.05)benign(0.025)TCGA-VS-A958-01Cervixcervical & endocervical cancerFemale<65I/IIChemotherapycisplatinCR
MTCH1SNVMissense_Mutationnovelc.685N>Tp.Arg229Trpp.R229WQ9NZJ7protein_codingtolerated(0.07)benign(0.04)TCGA-AA-3966-01Colorectumcolon adenocarcinomaFemale>=65I/IIUnknownUnknownSD
MTCH1SNVMissense_Mutationnovelc.902C>Tp.Ser301Phep.S301FQ9NZJ7protein_codingdeleterious_low_confidence(0.01)possibly_damaging(0.477)TCGA-AA-A00N-01Colorectumcolon adenocarcinomaMale>=65I/IIUnknownUnknownPD
MTCH1SNVMissense_Mutationc.1068N>Tp.Trp356Cysp.W356CQ9NZJ7protein_codingdeleterious(0)possibly_damaging(0.584)TCGA-DM-A28C-01Colorectumcolon adenocarcinomaMale>=65I/IIUnknownUnknownPD
MTCH1SNVMissense_Mutationc.1133G>Ap.Arg378Hisp.R378HQ9NZJ7protein_codingtolerated(0.06)benign(0.009)TCGA-NH-A5IV-01Colorectumcolon adenocarcinomaFemale>=65I/IIUnknownUnknownSD
MTCH1SNVMissense_Mutationnovelc.1072N>Tp.His358Tyrp.H358YQ9NZJ7protein_codingdeleterious(0.02)possibly_damaging(0.651)TCGA-A5-A0G1-01Endometriumuterine corpus endometrioid carcinomaFemale>=65I/IIUnknownUnknownSD
MTCH1SNVMissense_Mutationc.871G>Tp.Gly291Trpp.G291WQ9NZJ7protein_codingdeleterious_low_confidence(0.01)benign(0.157)TCGA-AP-A059-01Endometriumuterine corpus endometrioid carcinomaFemale>=65I/IIUnknownUnknownSD
Page: 1 2 3 

Top

Related drugs of malignant transformation related genes

check buttonIdentification of chemicals and drugs interact with genes involved in malignant transfromation
(DGIdb 4.0)
Entrez IDSymbolCategoryInteraction TypesDrug Claim NameDrug NamePMIDs
Page: 1