
|
|||||
|
 | |
| |
| |
| |
| |
| |
|
Gene: MRPL35 |
Gene summary for MRPL35 |
| Gene information | Species | Human | Gene symbol | MRPL35 | Gene ID | 51318 |
| Gene name | mitochondrial ribosomal protein L35 | |
| Gene Alias | L35mt | |
| Cytomap | 2p11.2 | |
| Gene Type | protein-coding | GO ID | GO:0006412 | UniProtAcc | Q9NZE8 |
Top |
Malignant transformation analysis |
| Identification of the aberrant gene expression in precancerous and cancerous lesions by comparing the gene expression of stem-like cells in diseased tissues with normal stem cells |
| Entrez ID | Symbol | Replicates | Species | Organ | Tissue | Adj P-value | Log2FC | Malignancy |
| 51318 | MRPL35 | P48T-E | Human | Esophagus | ESCC | 1.03e-20 | 3.27e-01 | 0.0959 |
| 51318 | MRPL35 | P49T-E | Human | Esophagus | ESCC | 1.69e-08 | 9.49e-01 | 0.1768 |
| 51318 | MRPL35 | P52T-E | Human | Esophagus | ESCC | 3.14e-30 | 6.11e-01 | 0.1555 |
| 51318 | MRPL35 | P54T-E | Human | Esophagus | ESCC | 1.29e-13 | 3.29e-01 | 0.0975 |
| 51318 | MRPL35 | P56T-E | Human | Esophagus | ESCC | 4.49e-02 | 3.84e-01 | 0.1613 |
| 51318 | MRPL35 | P57T-E | Human | Esophagus | ESCC | 2.04e-07 | 2.00e-01 | 0.0926 |
| 51318 | MRPL35 | P61T-E | Human | Esophagus | ESCC | 3.07e-11 | 2.86e-01 | 0.099 |
| 51318 | MRPL35 | P62T-E | Human | Esophagus | ESCC | 2.08e-36 | 6.23e-01 | 0.1302 |
| 51318 | MRPL35 | P65T-E | Human | Esophagus | ESCC | 5.14e-16 | 2.77e-01 | 0.0978 |
| 51318 | MRPL35 | P74T-E | Human | Esophagus | ESCC | 2.30e-36 | 8.06e-01 | 0.1479 |
| 51318 | MRPL35 | P75T-E | Human | Esophagus | ESCC | 1.43e-38 | 7.50e-01 | 0.1125 |
| 51318 | MRPL35 | P76T-E | Human | Esophagus | ESCC | 7.70e-15 | 3.34e-01 | 0.1207 |
| 51318 | MRPL35 | P79T-E | Human | Esophagus | ESCC | 1.01e-21 | 3.47e-01 | 0.1154 |
| 51318 | MRPL35 | P80T-E | Human | Esophagus | ESCC | 2.45e-38 | 8.79e-01 | 0.155 |
| 51318 | MRPL35 | P82T-E | Human | Esophagus | ESCC | 1.90e-18 | 5.79e-01 | 0.1072 |
| 51318 | MRPL35 | P83T-E | Human | Esophagus | ESCC | 1.35e-30 | 8.21e-01 | 0.1738 |
| 51318 | MRPL35 | P84T-E | Human | Esophagus | ESCC | 1.05e-04 | 2.83e-01 | 0.0933 |
| 51318 | MRPL35 | P89T-E | Human | Esophagus | ESCC | 1.00e-19 | 1.15e+00 | 0.1752 |
| 51318 | MRPL35 | P91T-E | Human | Esophagus | ESCC | 1.70e-16 | 1.60e+00 | 0.1828 |
| 51318 | MRPL35 | P94T-E | Human | Esophagus | ESCC | 7.12e-05 | 5.99e-01 | 0.0879 |
| Page: 1 2 3 4 5 6 |
| Tissue | Expression Dynamics | Abbreviation |
| Esophagus |  | ESCC: Esophageal squamous cell carcinoma |
| HGIN: High-grade intraepithelial neoplasias | ||
| LGIN: Low-grade intraepithelial neoplasias | ||
| Liver |  | HCC: Hepatocellular carcinoma |
| NAFLD: Non-alcoholic fatty liver disease | ||
| Oral Cavity | 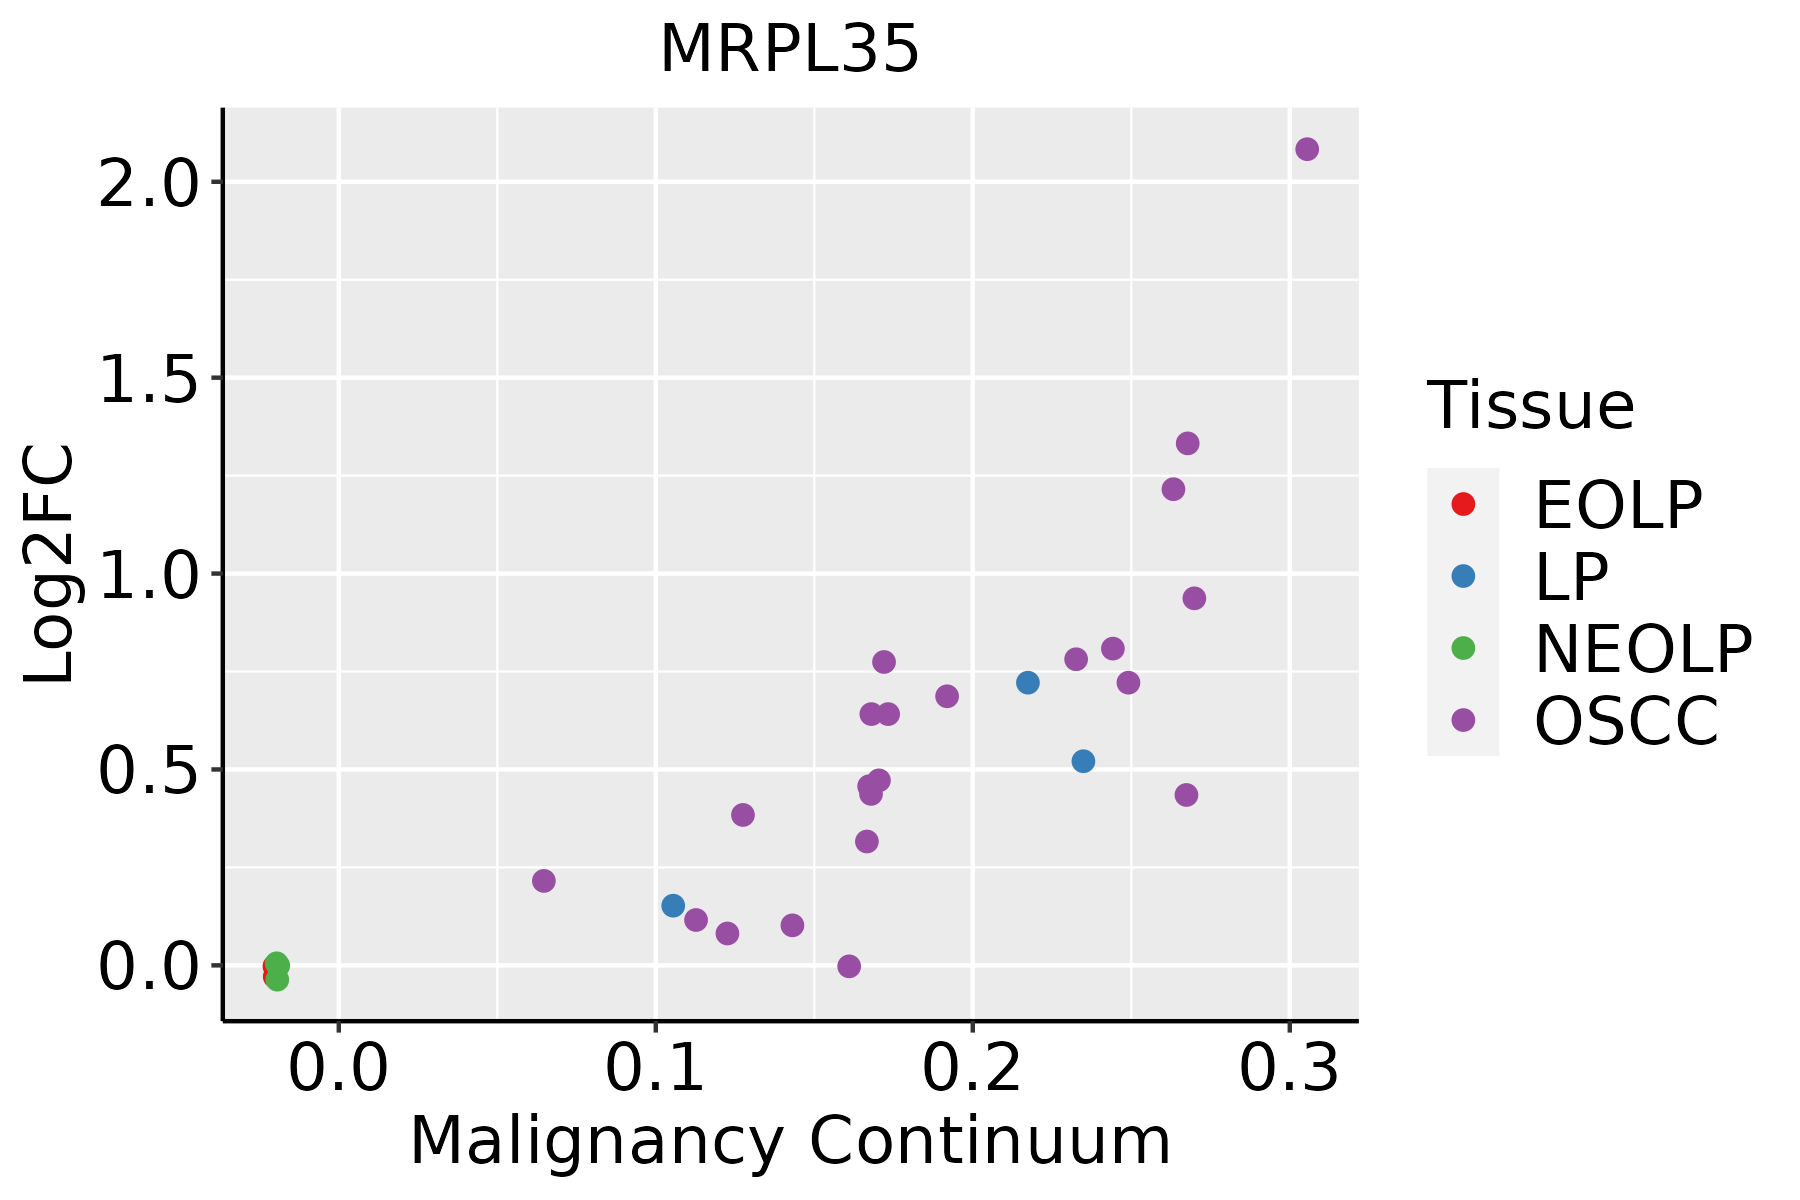 | EOLP: Erosive Oral lichen planus |
| LP: leukoplakia | ||
| NEOLP: Non-erosive oral lichen planus | ||
| OSCC: Oral squamous cell carcinoma | ||
| Skin | 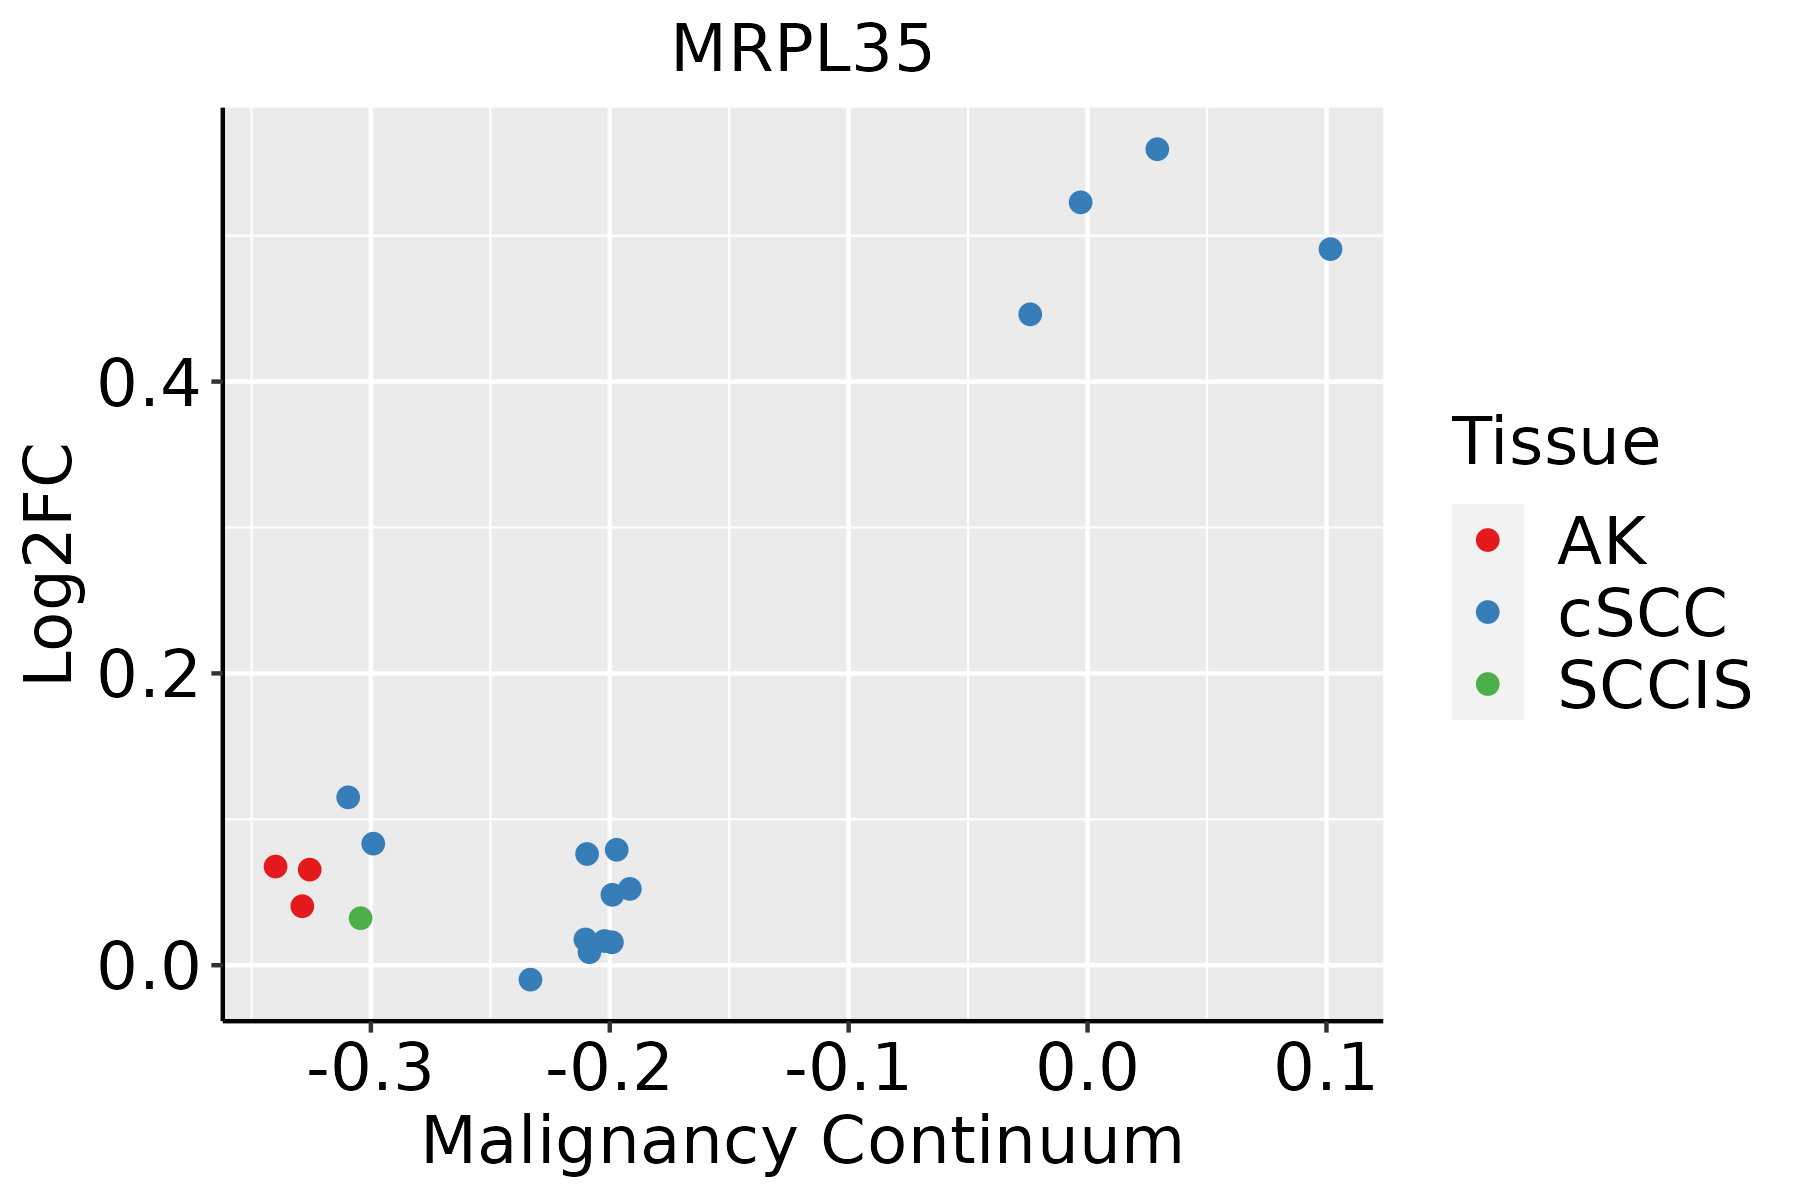 | AK: Actinic keratosis |
| cSCC: Cutaneous squamous cell carcinoma | ||
| SCCIS:squamous cell carcinoma in situ |
| ∗log2FC in expression of this searched gene in stem-like cells from each diseased tissue sample relative to stem-like cells in normal samples in each tissue plotted against the malignancy continuum. Samples are colored based on if they are from different disease stage. |
Top |
Malignant transformation related pathway analysis |
| Find out the enriched GO biological processes and KEGG pathways involved in transition from healthy to precancer to cancer |
| Tissue | Disease Stage | Enriched GO biological Processes |
| Colorectum | AD |  |
| Colorectum | SER |  |
| Colorectum | MSS |  |
| Colorectum | MSI-H |  |
| Colorectum | FAP |  |
| ∗Top 15 enriched GO BP terms are showed in the bar plot of each disease state in each tissue. Each row represents a significant GO biological process which is colored according to the -log10(p.adjust). |
| Page: 1 2 3 4 5 6 7 8 9 |
| GO ID | Tissue | Disease Stage | Description | Gene Ratio | Bg Ratio | pvalue | p.adjust | Count |
| Page: 1 |
| Pathway ID | Tissue | Disease Stage | Description | Gene Ratio | Bg Ratio | pvalue | p.adjust | qvalue | Count |
| hsa03010211 | Esophagus | ESCC | Ribosome | 129/4205 | 167/8465 | 1.43e-13 | 3.43e-12 | 1.75e-12 | 129 |
| hsa03010310 | Esophagus | ESCC | Ribosome | 129/4205 | 167/8465 | 1.43e-13 | 3.43e-12 | 1.75e-12 | 129 |
| hsa0301042 | Liver | HCC | Ribosome | 128/4020 | 167/8465 | 7.32e-15 | 2.23e-13 | 1.24e-13 | 128 |
| hsa0301052 | Liver | HCC | Ribosome | 128/4020 | 167/8465 | 7.32e-15 | 2.23e-13 | 1.24e-13 | 128 |
| hsa0301030 | Oral cavity | OSCC | Ribosome | 128/3704 | 167/8465 | 2.42e-18 | 1.62e-16 | 8.25e-17 | 128 |
| hsa03010114 | Oral cavity | OSCC | Ribosome | 128/3704 | 167/8465 | 2.42e-18 | 1.62e-16 | 8.25e-17 | 128 |
| hsa03010210 | Oral cavity | LP | Ribosome | 127/2418 | 167/8465 | 1.22e-37 | 4.05e-35 | 2.61e-35 | 127 |
| hsa0301038 | Oral cavity | LP | Ribosome | 127/2418 | 167/8465 | 1.22e-37 | 4.05e-35 | 2.61e-35 | 127 |
| Page: 1 |
Top |
Cell-cell communication analysis |
| Identification of potential cell-cell interactions between two cell types and their ligand-receptor pairs for different disease states |
| Ligand | Receptor | LRpair | Pathway | Tissue | Disease Stage |
| Page: 1 |
Top |
Single-cell gene regulatory network inference analysis |
| Find out the significant the regulons (TFs) and the target genes of each regulon across cell types for different disease states |
| TF | Cell Type | Tissue | Disease Stage | Target Gene | RSS | Regulon Activity |
| ∗The dot plots of a searched regulon are shown for all cell subpopulations in each disease state of each tissue based on the regulon specific score inferred using pySCENIC and by calculating the average expression. |
| Page: 1 |
Top |
Somatic mutation of malignant transformation related genes |
| Annotation of somatic variants for genes involved in malignant transformation |
| Hugo Symbol | Variant Class | Variant Classification | dbSNP RS | HGVSc | HGVSp | HGVSp Short | SWISSPROT | BIOTYPE | SIFT | PolyPhen | Tumor Sample Barcode | Tissue | Histology | Sex | Age | Stage | Therapy Types | Drugs | Outcome |
| MRPL35 | SNV | Missense_Mutation | novel | c.190G>C | p.Glu64Gln | p.E64Q | Q9NZE8 | protein_coding | tolerated(0.3) | benign(0.018) | TCGA-LD-A74U-01 | Breast | breast invasive carcinoma | Female | >=65 | III/IV | Chemotherapy | taxotere | SD |
| MRPL35 | SNV | Missense_Mutation | novel | c.309G>C | p.Lys103Asn | p.K103N | Q9NZE8 | protein_coding | deleterious(0) | probably_damaging(0.999) | TCGA-LD-A74U-01 | Breast | breast invasive carcinoma | Female | >=65 | III/IV | Chemotherapy | taxotere | SD |
| MRPL35 | SNV | Missense_Mutation | rs773669532 | c.32N>A | p.Arg11Lys | p.R11K | Q9NZE8 | protein_coding | tolerated(0.09) | benign(0) | TCGA-DR-A0ZM-01 | Cervix | cervical & endocervical cancer | Female | <65 | III/IV | Unspecific | Cisplatin | SD |
| MRPL35 | SNV | Missense_Mutation | c.390N>T | p.Lys130Asn | p.K130N | Q9NZE8 | protein_coding | deleterious(0) | probably_damaging(0.999) | TCGA-CA-6718-01 | Colorectum | colon adenocarcinoma | Male | <65 | I/II | Unknown | Unknown | PD | |
| MRPL35 | SNV | Missense_Mutation | novel | c.227N>G | p.Leu76Arg | p.L76R | Q9NZE8 | protein_coding | deleterious(0) | possibly_damaging(0.641) | TCGA-F5-6814-01 | Colorectum | rectum adenocarcinoma | Male | <65 | I/II | Unknown | Unknown | SD |
| MRPL35 | SNV | Missense_Mutation | rs751296332 | c.397N>A | p.Leu133Ile | p.L133I | Q9NZE8 | protein_coding | deleterious(0) | probably_damaging(0.998) | TCGA-A5-A0G2-01 | Endometrium | uterine corpus endometrioid carcinoma | Female | <65 | III/IV | Unknown | Unknown | SD |
| MRPL35 | SNV | Missense_Mutation | c.436N>A | p.Glu146Lys | p.E146K | Q9NZE8 | protein_coding | deleterious(0.02) | probably_damaging(0.967) | TCGA-AP-A0LM-01 | Endometrium | uterine corpus endometrioid carcinoma | Female | <65 | III/IV | Chemotherapy | cisplatin | SD | |
| MRPL35 | SNV | Missense_Mutation | novel | c.61N>G | p.Asn21Asp | p.N21D | Q9NZE8 | protein_coding | tolerated(0.09) | benign(0.027) | TCGA-AP-A1DK-01 | Endometrium | uterine corpus endometrioid carcinoma | Female | <65 | I/II | Unknown | Unknown | SD |
| MRPL35 | SNV | Missense_Mutation | rs1051949 | c.86N>A | p.Arg29His | p.R29H | Q9NZE8 | protein_coding | deleterious(0.05) | benign(0.23) | TCGA-AP-A1DV-01 | Endometrium | uterine corpus endometrioid carcinoma | Female | <65 | I/II | Unknown | Unknown | SD |
| MRPL35 | SNV | Missense_Mutation | novel | c.176N>T | p.Arg59Ile | p.R59I | Q9NZE8 | protein_coding | tolerated(0.08) | benign(0.3) | TCGA-AX-A06F-01 | Endometrium | uterine corpus endometrioid carcinoma | Female | <65 | III/IV | Chemotherapy | carboplatin | SD |
| Page: 1 2 3 |
Top |
Related drugs of malignant transformation related genes |
| Identification of chemicals and drugs interact with genes involved in malignant transfromation |
| (DGIdb 4.0) |
| Entrez ID | Symbol | Category | Interaction Types | Drug Claim Name | Drug Name | PMIDs |
| Page: 1 |

Copyright 2023-Present -The University of Texas Health Science Center at Houston |