
|
|||||
|
 | |
| |
| |
| |
| |
| |
|
Gene: MRPL34 |
Gene summary for MRPL34 |
| Gene information | Species | Human | Gene symbol | MRPL34 | Gene ID | 64981 |
| Gene name | mitochondrial ribosomal protein L34 | |
| Gene Alias | L34mt | |
| Cytomap | 19p13.11 | |
| Gene Type | protein-coding | GO ID | GO:0006412 | UniProtAcc | A0A024R7J4 |
Top |
Malignant transformation analysis |
| Identification of the aberrant gene expression in precancerous and cancerous lesions by comparing the gene expression of stem-like cells in diseased tissues with normal stem cells |
| Entrez ID | Symbol | Replicates | Species | Organ | Tissue | Adj P-value | Log2FC | Malignancy |
| 64981 | MRPL34 | LZE7T | Human | Esophagus | ESCC | 1.20e-19 | 1.04e+00 | 0.0667 |
| 64981 | MRPL34 | LZE8T | Human | Esophagus | ESCC | 6.47e-05 | 1.52e-01 | 0.067 |
| 64981 | MRPL34 | LZE20T | Human | Esophagus | ESCC | 1.01e-04 | 1.57e-01 | 0.0662 |
| 64981 | MRPL34 | LZE22D1 | Human | Esophagus | HGIN | 3.80e-07 | 2.81e-01 | 0.0595 |
| 64981 | MRPL34 | LZE22T | Human | Esophagus | ESCC | 2.35e-03 | 6.53e-01 | 0.068 |
| 64981 | MRPL34 | LZE24T | Human | Esophagus | ESCC | 7.25e-27 | 7.95e-01 | 0.0596 |
| 64981 | MRPL34 | LZE21T | Human | Esophagus | ESCC | 1.71e-06 | 6.79e-01 | 0.0655 |
| 64981 | MRPL34 | LZE6T | Human | Esophagus | ESCC | 4.72e-10 | 8.09e-01 | 0.0845 |
| 64981 | MRPL34 | P1T-E | Human | Esophagus | ESCC | 1.33e-13 | 7.65e-01 | 0.0875 |
| 64981 | MRPL34 | P2T-E | Human | Esophagus | ESCC | 8.63e-25 | 5.53e-01 | 0.1177 |
| 64981 | MRPL34 | P4T-E | Human | Esophagus | ESCC | 3.81e-48 | 1.20e+00 | 0.1323 |
| 64981 | MRPL34 | P5T-E | Human | Esophagus | ESCC | 2.46e-50 | 8.47e-01 | 0.1327 |
| 64981 | MRPL34 | P8T-E | Human | Esophagus | ESCC | 9.42e-56 | 9.32e-01 | 0.0889 |
| 64981 | MRPL34 | P9T-E | Human | Esophagus | ESCC | 9.78e-46 | 1.14e+00 | 0.1131 |
| 64981 | MRPL34 | P10T-E | Human | Esophagus | ESCC | 2.06e-68 | 1.13e+00 | 0.116 |
| 64981 | MRPL34 | P11T-E | Human | Esophagus | ESCC | 1.00e-19 | 1.09e+00 | 0.1426 |
| 64981 | MRPL34 | P12T-E | Human | Esophagus | ESCC | 1.50e-59 | 1.05e+00 | 0.1122 |
| 64981 | MRPL34 | P15T-E | Human | Esophagus | ESCC | 3.60e-36 | 7.93e-01 | 0.1149 |
| 64981 | MRPL34 | P16T-E | Human | Esophagus | ESCC | 3.29e-38 | 5.93e-01 | 0.1153 |
| 64981 | MRPL34 | P17T-E | Human | Esophagus | ESCC | 3.22e-13 | 7.40e-01 | 0.1278 |
| Page: 1 2 3 4 5 6 7 8 9 |
| Tissue | Expression Dynamics | Abbreviation |
| Breast | 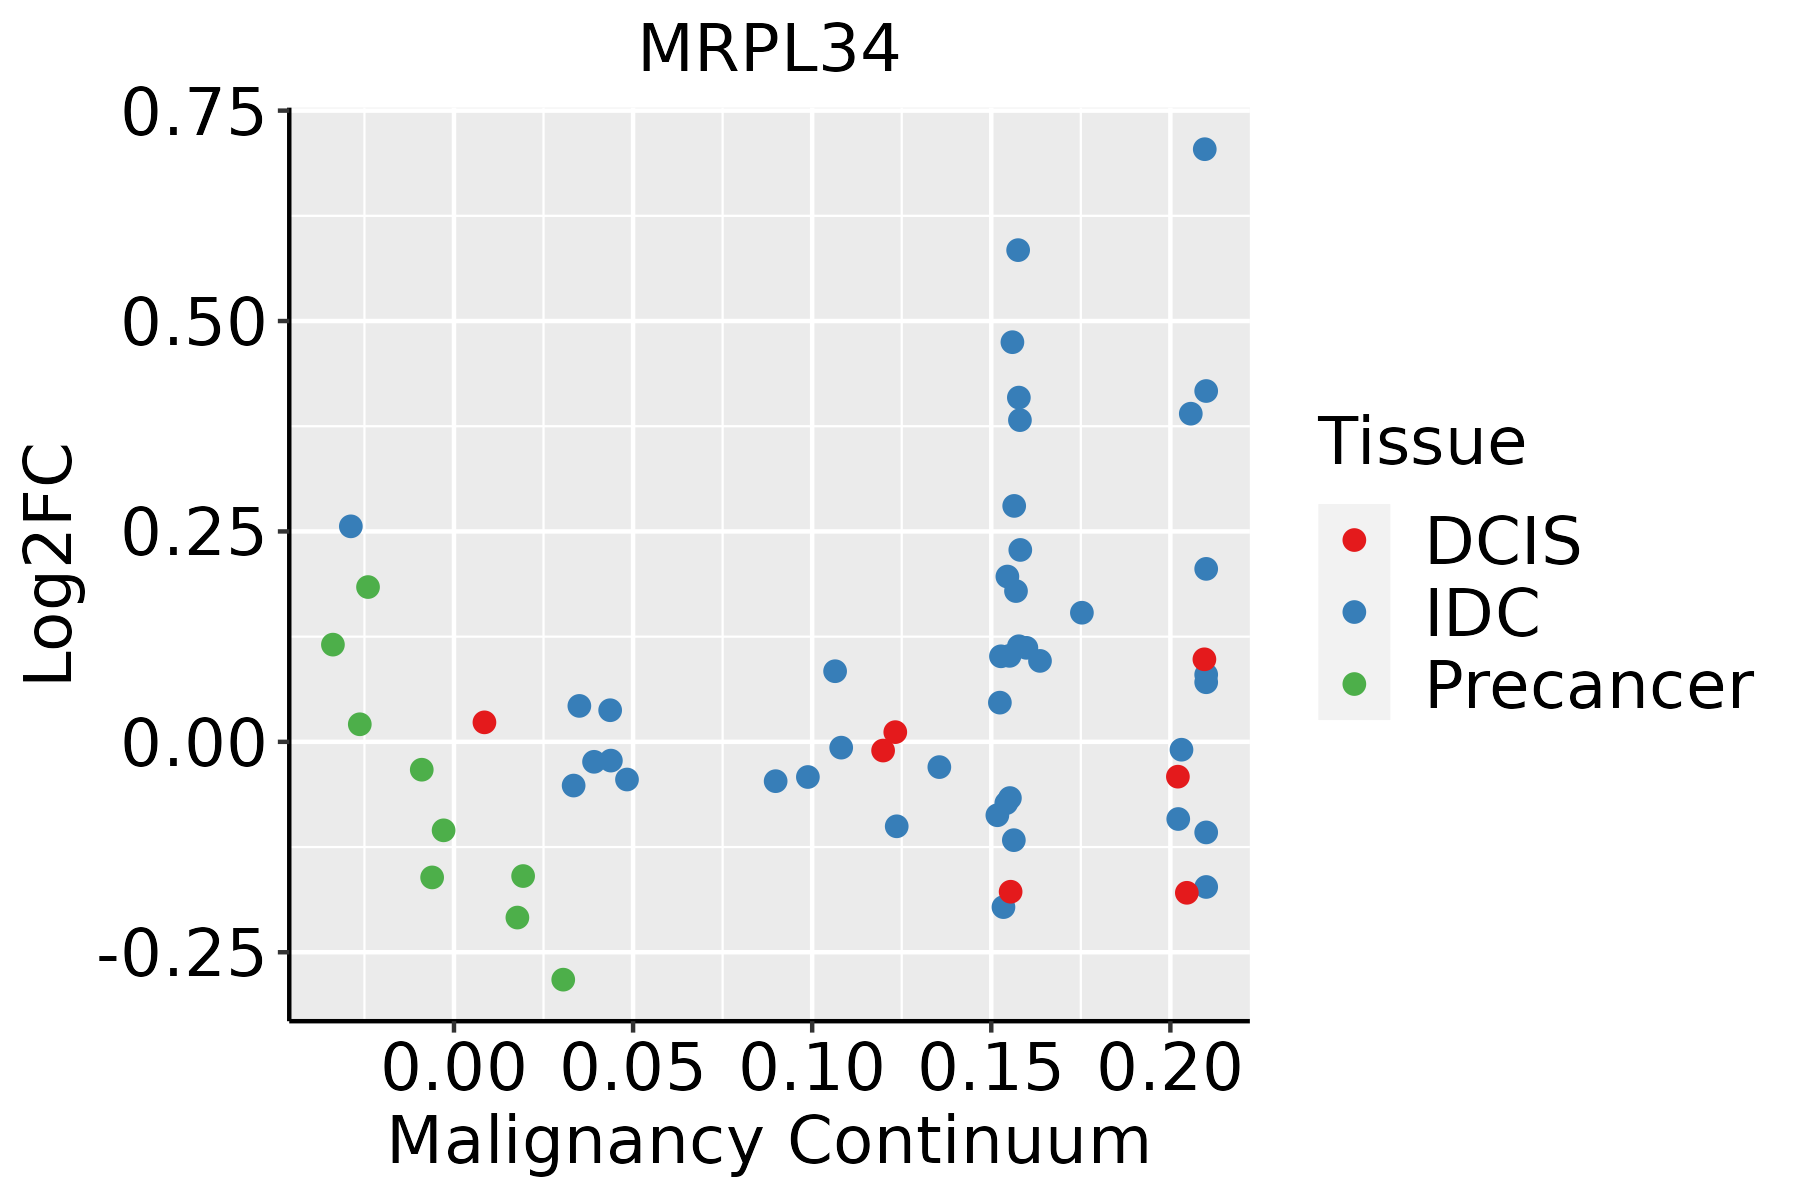 | IDC: Invasive ductal carcinoma |
| DCIS: Ductal carcinoma in situ | ||
| Precancer(BRCA1-mut): Precancerous lesion from BRCA1 mutation carriers | ||
| Colorectum (GSE201348) |  | FAP: Familial adenomatous polyposis |
| CRC: Colorectal cancer | ||
| Colorectum (HTA11) |  | AD: Adenomas |
| SER: Sessile serrated lesions | ||
| MSI-H: Microsatellite-high colorectal cancer | ||
| MSS: Microsatellite stable colorectal cancer | ||
| Esophagus |  | ESCC: Esophageal squamous cell carcinoma |
| HGIN: High-grade intraepithelial neoplasias | ||
| LGIN: Low-grade intraepithelial neoplasias | ||
| Liver | 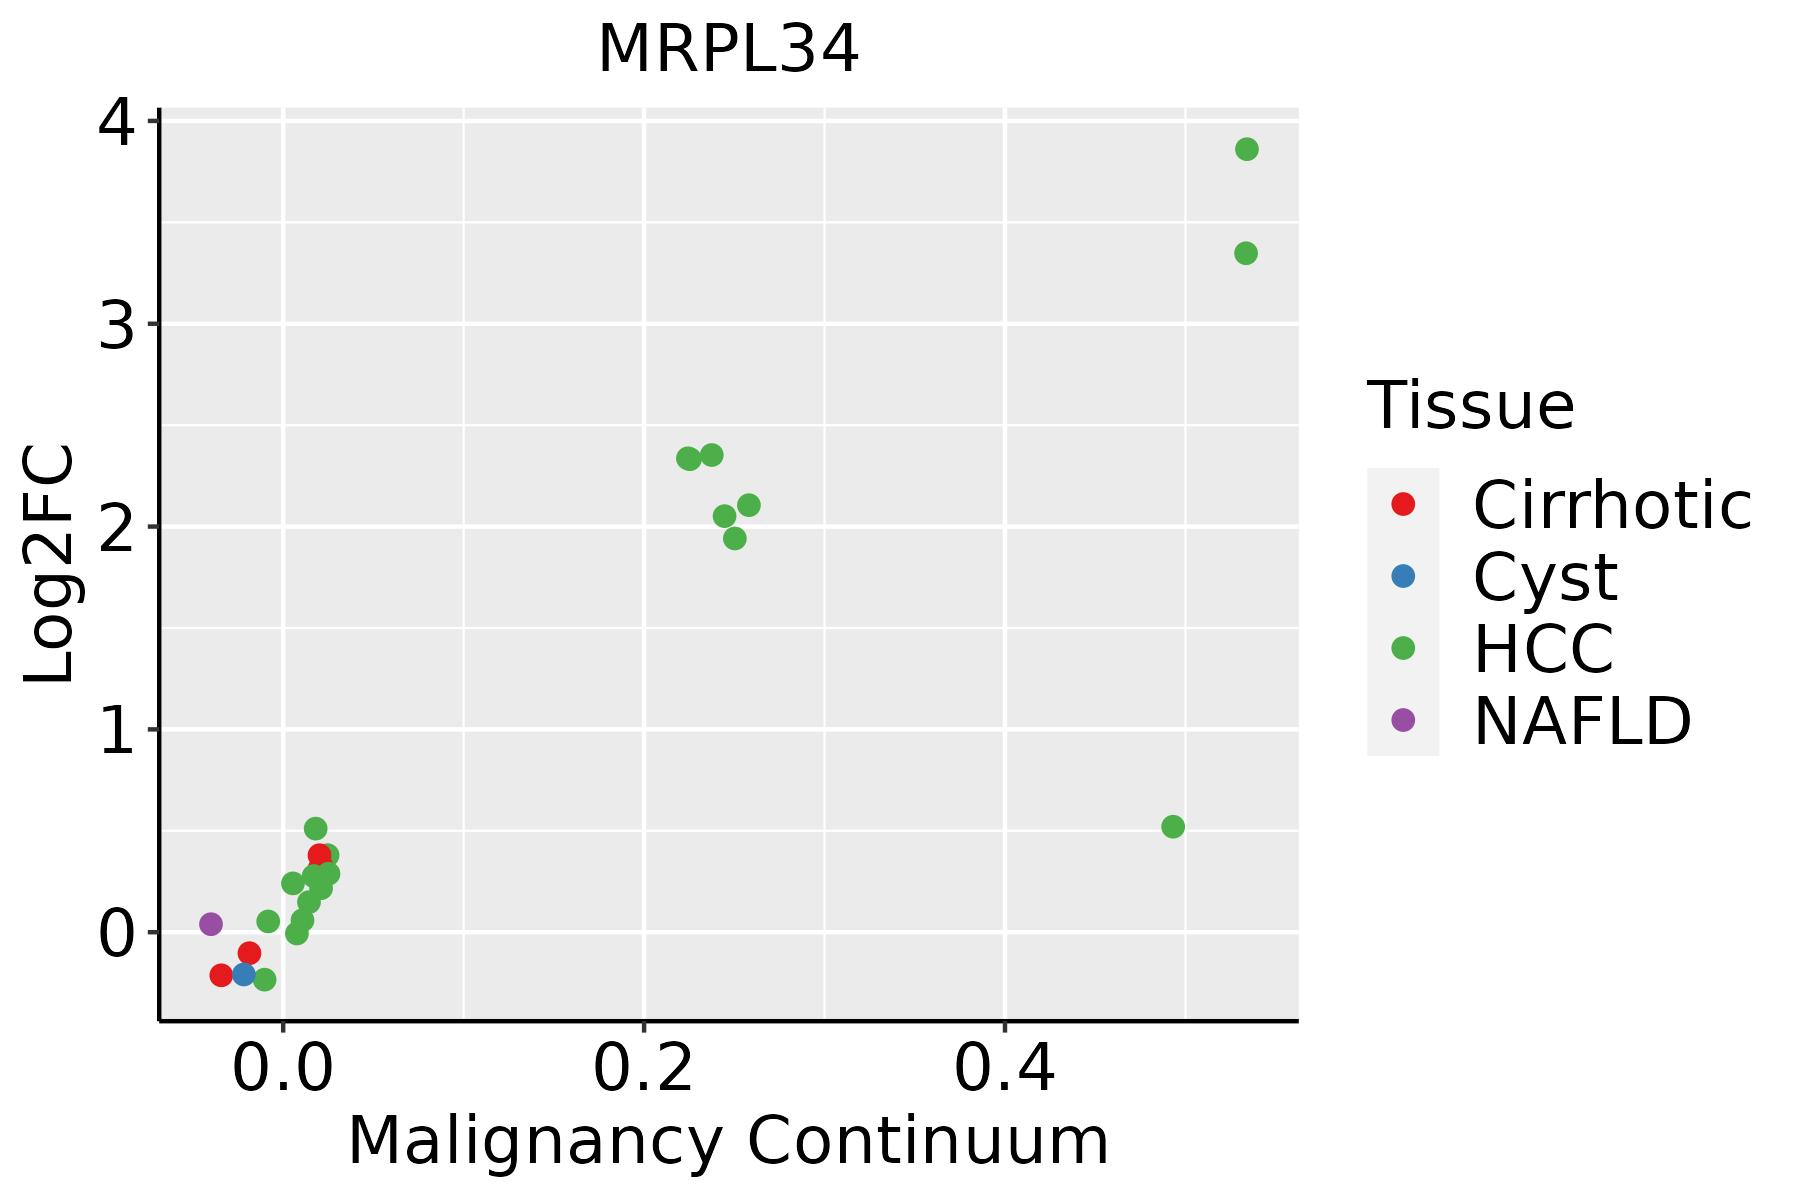 | HCC: Hepatocellular carcinoma |
| NAFLD: Non-alcoholic fatty liver disease | ||
| Oral Cavity | 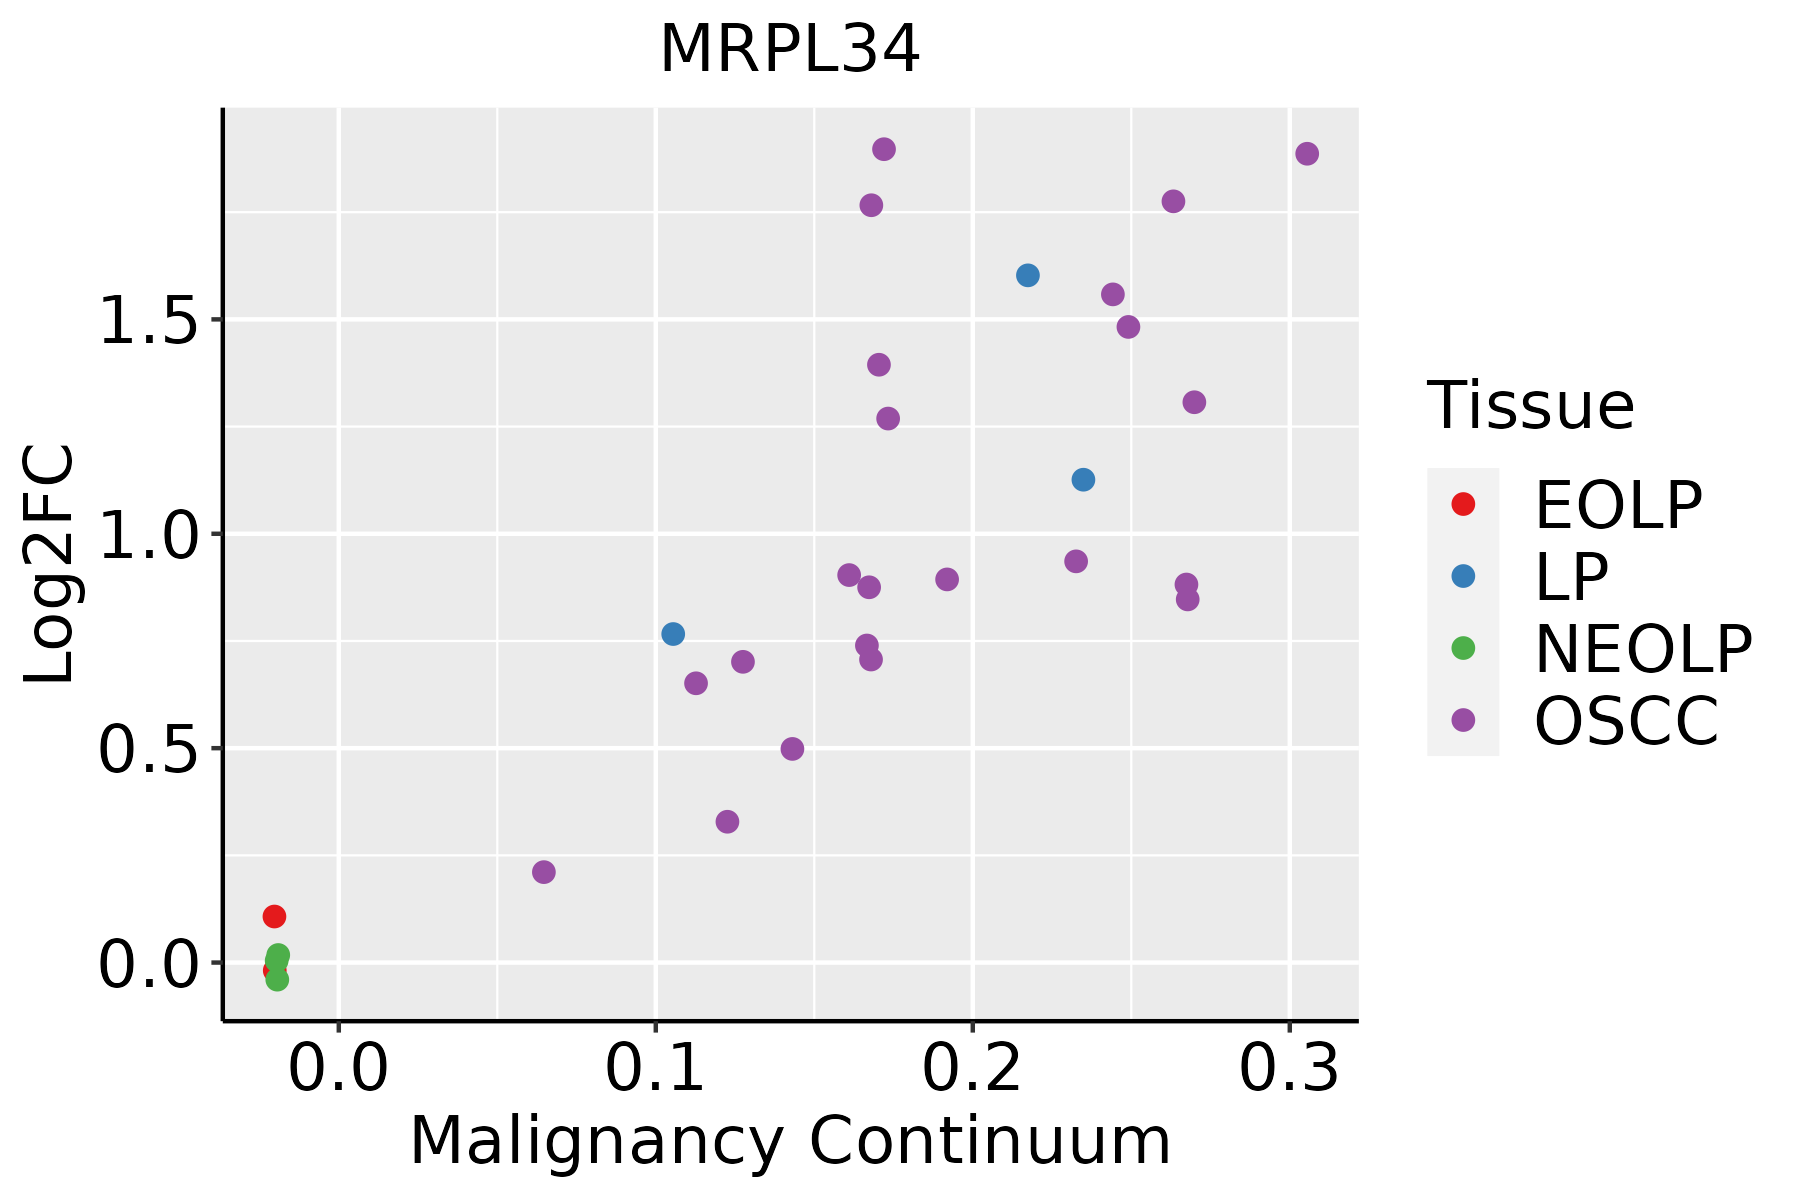 | EOLP: Erosive Oral lichen planus |
| LP: leukoplakia | ||
| NEOLP: Non-erosive oral lichen planus | ||
| OSCC: Oral squamous cell carcinoma | ||
| Prostate |  | BPH: Benign Prostatic Hyperplasia |
| Skin | 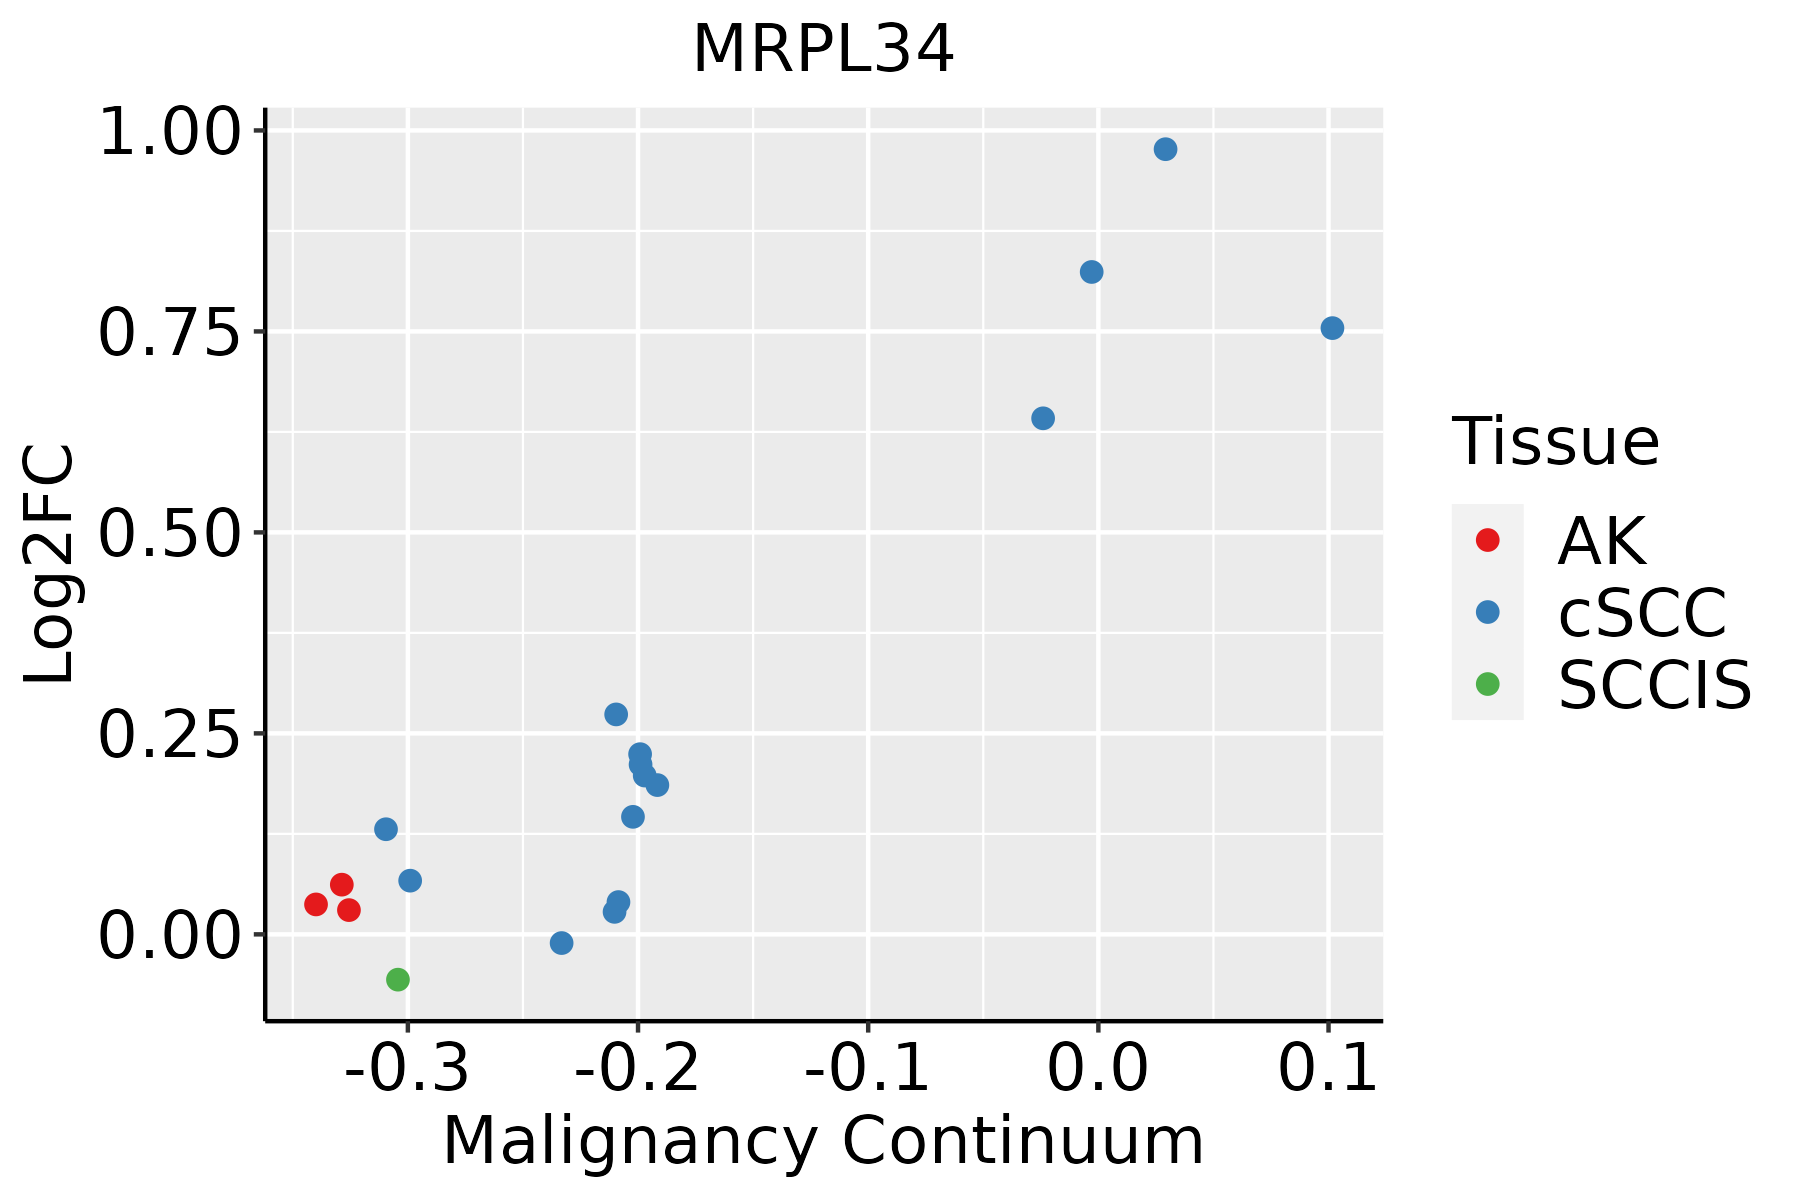 | AK: Actinic keratosis |
| cSCC: Cutaneous squamous cell carcinoma | ||
| SCCIS:squamous cell carcinoma in situ | ||
| Thyroid | 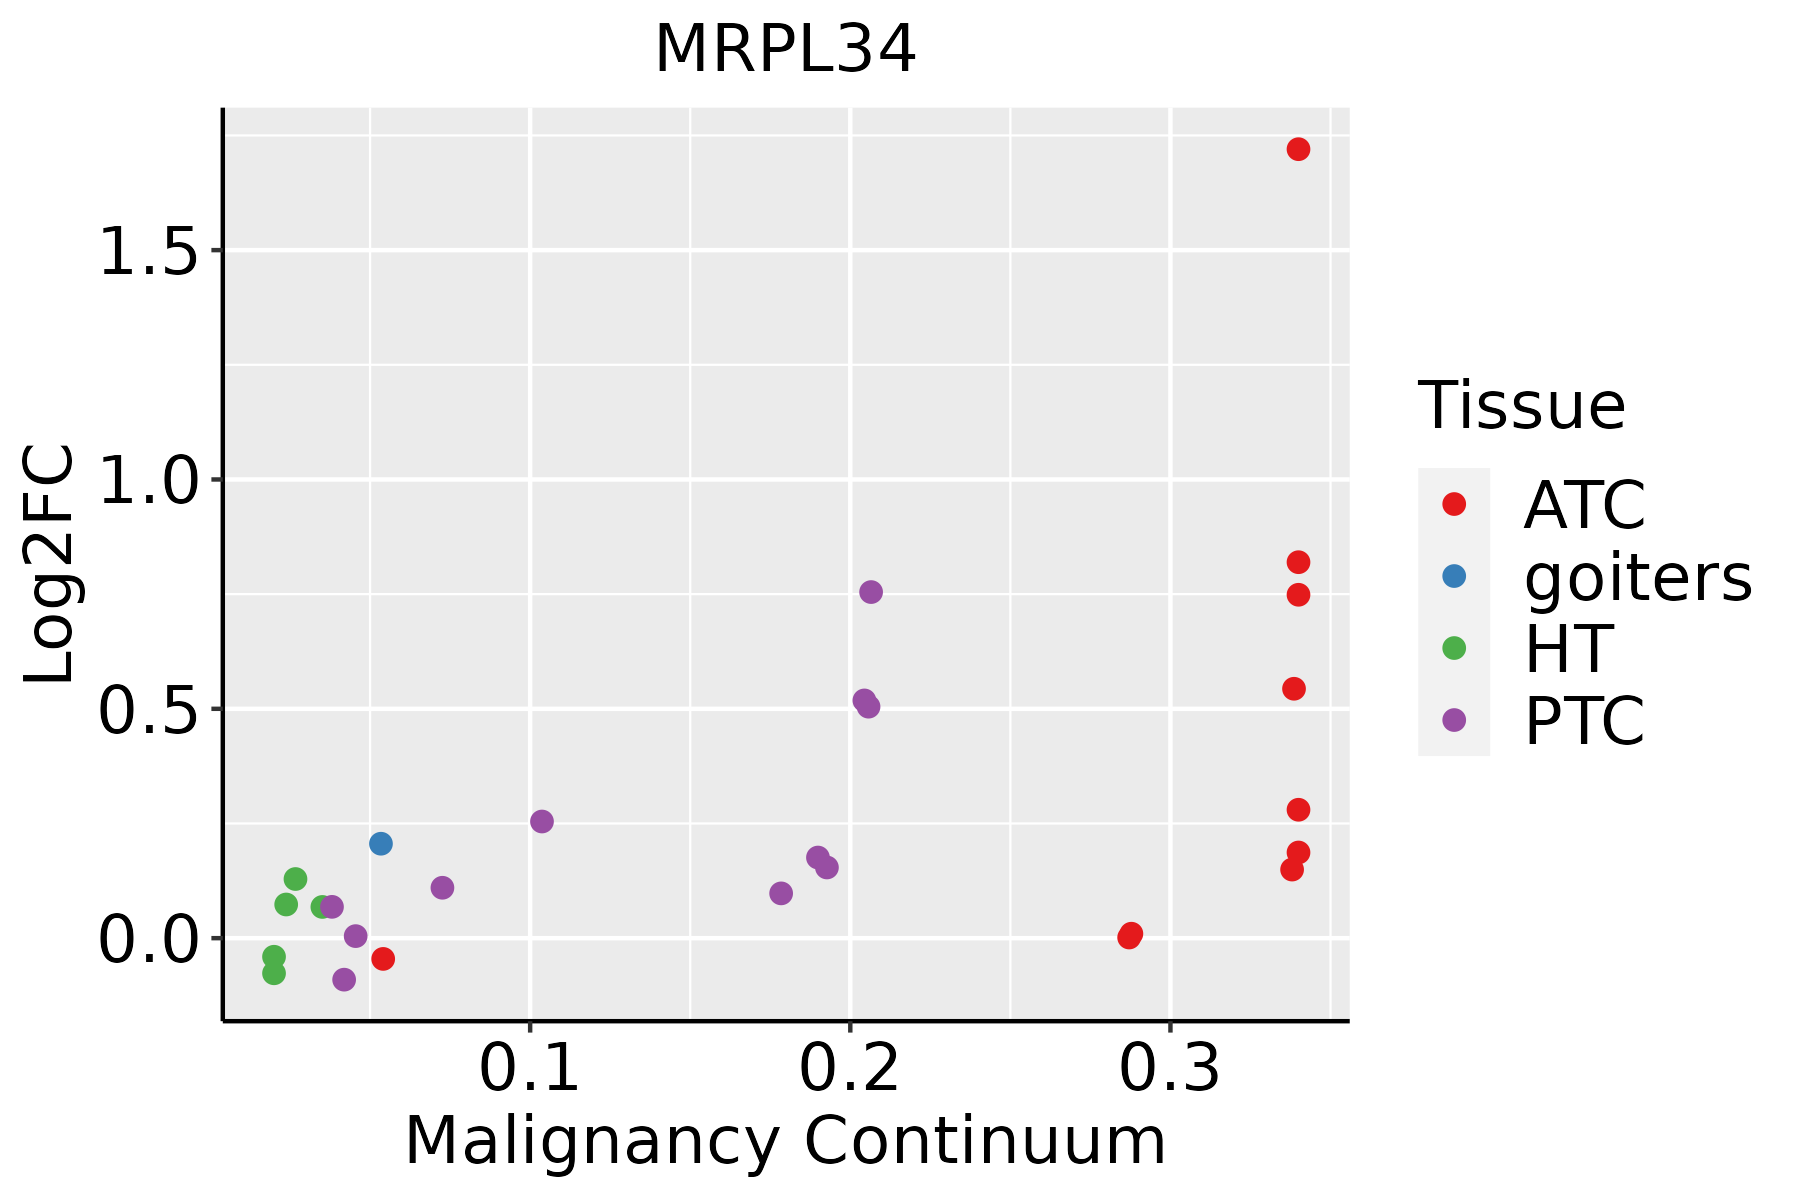 | ATC: Anaplastic thyroid cancer |
| HT: Hashimoto's thyroiditis | ||
| PTC: Papillary thyroid cancer |
| ∗log2FC in expression of this searched gene in stem-like cells from each diseased tissue sample relative to stem-like cells in normal samples in each tissue plotted against the malignancy continuum. Samples are colored based on if they are from different disease stage. |
Top |
Malignant transformation related pathway analysis |
| Find out the enriched GO biological processes and KEGG pathways involved in transition from healthy to precancer to cancer |
| Tissue | Disease Stage | Enriched GO biological Processes |
| Colorectum | AD |  |
| Colorectum | SER |  |
| Colorectum | MSS |  |
| Colorectum | MSI-H |  |
| Colorectum | FAP |  |
| ∗Top 15 enriched GO BP terms are showed in the bar plot of each disease state in each tissue. Each row represents a significant GO biological process which is colored according to the -log10(p.adjust). |
| Page: 1 2 3 4 5 6 7 8 9 |
| GO ID | Tissue | Disease Stage | Description | Gene Ratio | Bg Ratio | pvalue | p.adjust | Count |
| Page: 1 |
| Pathway ID | Tissue | Disease Stage | Description | Gene Ratio | Bg Ratio | pvalue | p.adjust | qvalue | Count |
| hsa0301018 | Breast | Precancer | Ribosome | 80/684 | 167/8465 | 7.33e-44 | 2.32e-41 | 1.77e-41 | 80 |
| hsa0301019 | Breast | Precancer | Ribosome | 80/684 | 167/8465 | 7.33e-44 | 2.32e-41 | 1.77e-41 | 80 |
| hsa0301024 | Breast | IDC | Ribosome | 83/867 | 167/8465 | 6.07e-39 | 9.87e-37 | 7.38e-37 | 83 |
| hsa0301034 | Breast | IDC | Ribosome | 83/867 | 167/8465 | 6.07e-39 | 9.87e-37 | 7.38e-37 | 83 |
| hsa0301044 | Breast | DCIS | Ribosome | 82/846 | 167/8465 | 8.69e-39 | 1.40e-36 | 1.03e-36 | 82 |
| hsa0301054 | Breast | DCIS | Ribosome | 82/846 | 167/8465 | 8.69e-39 | 1.40e-36 | 1.03e-36 | 82 |
| hsa03010 | Colorectum | AD | Ribosome | 96/2092 | 167/8465 | 8.28e-20 | 5.54e-18 | 3.54e-18 | 96 |
| hsa030101 | Colorectum | AD | Ribosome | 96/2092 | 167/8465 | 8.28e-20 | 5.54e-18 | 3.54e-18 | 96 |
| hsa030102 | Colorectum | SER | Ribosome | 92/1580 | 167/8465 | 2.21e-26 | 3.66e-24 | 2.66e-24 | 92 |
| hsa030103 | Colorectum | SER | Ribosome | 92/1580 | 167/8465 | 2.21e-26 | 3.66e-24 | 2.66e-24 | 92 |
| hsa030104 | Colorectum | MSS | Ribosome | 96/1875 | 167/8465 | 1.82e-23 | 2.03e-21 | 1.24e-21 | 96 |
| hsa030105 | Colorectum | MSS | Ribosome | 96/1875 | 167/8465 | 1.82e-23 | 2.03e-21 | 1.24e-21 | 96 |
| hsa030106 | Colorectum | MSI-H | Ribosome | 87/797 | 167/8465 | 5.55e-46 | 1.80e-43 | 1.51e-43 | 87 |
| hsa030107 | Colorectum | MSI-H | Ribosome | 87/797 | 167/8465 | 5.55e-46 | 1.80e-43 | 1.51e-43 | 87 |
| hsa0301039 | Esophagus | HGIN | Ribosome | 108/1383 | 167/8465 | 1.44e-45 | 4.71e-43 | 3.74e-43 | 108 |
| hsa03010115 | Esophagus | HGIN | Ribosome | 108/1383 | 167/8465 | 1.44e-45 | 4.71e-43 | 3.74e-43 | 108 |
| hsa03010211 | Esophagus | ESCC | Ribosome | 129/4205 | 167/8465 | 1.43e-13 | 3.43e-12 | 1.75e-12 | 129 |
| hsa03010310 | Esophagus | ESCC | Ribosome | 129/4205 | 167/8465 | 1.43e-13 | 3.43e-12 | 1.75e-12 | 129 |
| hsa0301022 | Liver | Cirrhotic | Ribosome | 127/2530 | 167/8465 | 2.12e-35 | 7.06e-33 | 4.35e-33 | 127 |
| hsa0301032 | Liver | Cirrhotic | Ribosome | 127/2530 | 167/8465 | 2.12e-35 | 7.06e-33 | 4.35e-33 | 127 |
| Page: 1 2 |
Top |
Cell-cell communication analysis |
| Identification of potential cell-cell interactions between two cell types and their ligand-receptor pairs for different disease states |
| Ligand | Receptor | LRpair | Pathway | Tissue | Disease Stage |
| Page: 1 |
Top |
Single-cell gene regulatory network inference analysis |
| Find out the significant the regulons (TFs) and the target genes of each regulon across cell types for different disease states |
| TF | Cell Type | Tissue | Disease Stage | Target Gene | RSS | Regulon Activity |
| ∗The dot plots of a searched regulon are shown for all cell subpopulations in each disease state of each tissue based on the regulon specific score inferred using pySCENIC and by calculating the average expression. |
| Page: 1 |
Top |
Somatic mutation of malignant transformation related genes |
| Annotation of somatic variants for genes involved in malignant transformation |
| Hugo Symbol | Variant Class | Variant Classification | dbSNP RS | HGVSc | HGVSp | HGVSp Short | SWISSPROT | BIOTYPE | SIFT | PolyPhen | Tumor Sample Barcode | Tissue | Histology | Sex | Age | Stage | Therapy Types | Drugs | Outcome |
| MRPL34 | SNV | Missense_Mutation | c.22C>A | p.Leu8Met | p.L8M | Q9BQ48 | protein_coding | tolerated_low_confidence(0.16) | benign(0.125) | TCGA-A5-A0GB-01 | Endometrium | uterine corpus endometrioid carcinoma | Female | >=65 | I/II | Unknown | Unknown | SD | |
| MRPL34 | SNV | Missense_Mutation | novel | c.208N>A | p.Leu70Met | p.L70M | Q9BQ48 | protein_coding | tolerated(0.07) | possibly_damaging(0.672) | TCGA-AX-A3G9-01 | Endometrium | uterine corpus endometrioid carcinoma | Female | <65 | III/IV | Chemotherapy | carboplatin | SD |
| MRPL34 | SNV | Missense_Mutation | novel | c.170N>G | p.Asn57Ser | p.N57S | Q9BQ48 | protein_coding | deleterious(0.01) | probably_damaging(0.953) | TCGA-DI-A1BU-01 | Endometrium | uterine corpus endometrioid carcinoma | Female | <65 | I/II | Chemotherapy | paclitaxel | SD |
| MRPL34 | SNV | Missense_Mutation | novel | c.199N>A | p.Val67Ile | p.V67I | Q9BQ48 | protein_coding | tolerated(1) | benign(0) | TCGA-E6-A1LX-01 | Endometrium | uterine corpus endometrioid carcinoma | Female | <65 | I/II | Unknown | Unknown | SD |
| MRPL34 | deletion | Frame_Shift_Del | novel | c.181delN | p.Lys61ArgfsTer10 | p.K61Rfs*10 | Q9BQ48 | protein_coding | TCGA-33-4533-01 | Lung | lung squamous cell carcinoma | Female | >=65 | I/II | Unknown | Unknown | SD | ||
| MRPL34 | SNV | Missense_Mutation | c.46N>C | p.Ala16Pro | p.A16P | Q9BQ48 | protein_coding | deleterious_low_confidence(0.01) | benign(0.029) | TCGA-BR-7197-01 | Stomach | stomach adenocarcinoma | Male | >=65 | I/II | Unknown | Unknown | SD | |
| MRPL34 | deletion | In_Frame_Del | novel | c.178_189delNNNNNNNNNNNN | p.Arg60_Lys63del | p.R60_K63del | Q9BQ48 | protein_coding | TCGA-IN-A6RN-01 | Stomach | stomach adenocarcinoma | Female | >=65 | I/II | Unknown | Unknown | SD |
| Page: 1 |
Top |
Related drugs of malignant transformation related genes |
| Identification of chemicals and drugs interact with genes involved in malignant transfromation |
| (DGIdb 4.0) |
| Entrez ID | Symbol | Category | Interaction Types | Drug Claim Name | Drug Name | PMIDs |
| Page: 1 |

Copyright 2023-Present -The University of Texas Health Science Center at Houston |