
|
|||||
|
 | |
| |
| |
| |
| |
| |
|
Gene: MPHOSPH8 |
Gene summary for MPHOSPH8 |
| Gene information | Species | Human | Gene symbol | MPHOSPH8 | Gene ID | 54737 |
| Gene name | M-phase phosphoprotein 8 | |
| Gene Alias | HSMPP8 | |
| Cytomap | 13q12.11 | |
| Gene Type | protein-coding | GO ID | GO:0006139 | UniProtAcc | Q99549 |
Top |
Malignant transformation analysis |
| Identification of the aberrant gene expression in precancerous and cancerous lesions by comparing the gene expression of stem-like cells in diseased tissues with normal stem cells |
| Entrez ID | Symbol | Replicates | Species | Organ | Tissue | Adj P-value | Log2FC | Malignancy |
| 54737 | MPHOSPH8 | EEC-subject1 | Human | Endometrium | EEC | 6.37e-13 | -2.11e-01 | -0.2682 |
| 54737 | MPHOSPH8 | EEC-subject2 | Human | Endometrium | EEC | 3.07e-10 | 5.21e-02 | -0.2607 |
| 54737 | MPHOSPH8 | EEC-subject3 | Human | Endometrium | EEC | 1.05e-31 | -4.58e-01 | -0.2525 |
| 54737 | MPHOSPH8 | EEC-subject4 | Human | Endometrium | EEC | 2.47e-04 | -5.81e-02 | -0.2571 |
| 54737 | MPHOSPH8 | EEC-subject5 | Human | Endometrium | EEC | 3.15e-03 | -1.80e-01 | -0.249 |
| 54737 | MPHOSPH8 | GSM5276934 | Human | Endometrium | EEC | 1.50e-17 | -4.18e-01 | -0.0913 |
| 54737 | MPHOSPH8 | GSM6177620_NYU_UCEC1_lib1_lib1 | Human | Endometrium | EEC | 1.42e-27 | -3.92e-01 | -0.1869 |
| 54737 | MPHOSPH8 | GSM6177620_NYU_UCEC1_lib2_lib2 | Human | Endometrium | EEC | 5.84e-26 | -4.05e-01 | -0.1875 |
| 54737 | MPHOSPH8 | GSM6177620_NYU_UCEC1_lib3_lib3 | Human | Endometrium | EEC | 2.49e-33 | -4.10e-01 | -0.1883 |
| 54737 | MPHOSPH8 | GSM6177621_NYU_UCEC2_lib1_lib1 | Human | Endometrium | EEC | 9.14e-31 | -2.11e-01 | -0.1934 |
| 54737 | MPHOSPH8 | GSM6177622_NYU_UCEC3_lib1_lib1 | Human | Endometrium | EEC | 5.04e-48 | -3.67e-01 | -0.1917 |
| 54737 | MPHOSPH8 | GSM6177622_NYU_UCEC3_lib2_lib2 | Human | Endometrium | EEC | 3.36e-44 | -4.19e-01 | -0.1916 |
| 54737 | MPHOSPH8 | GSM6177623_NYU_UCEC3_Vis | Human | Endometrium | EEC | 8.08e-20 | -4.30e-01 | -0.1269 |
| 54737 | MPHOSPH8 | LZE2D | Human | Esophagus | HGIN | 2.29e-03 | 2.57e-01 | 0.0642 |
| 54737 | MPHOSPH8 | LZE4T | Human | Esophagus | ESCC | 5.75e-15 | 5.78e-01 | 0.0811 |
| 54737 | MPHOSPH8 | LZE7T | Human | Esophagus | ESCC | 7.60e-03 | 3.05e-01 | 0.0667 |
| 54737 | MPHOSPH8 | LZE8T | Human | Esophagus | ESCC | 2.70e-08 | 1.97e-01 | 0.067 |
| 54737 | MPHOSPH8 | LZE20T | Human | Esophagus | ESCC | 1.75e-06 | 2.37e-02 | 0.0662 |
| 54737 | MPHOSPH8 | LZE22D1 | Human | Esophagus | HGIN | 8.58e-09 | 1.14e-01 | 0.0595 |
| 54737 | MPHOSPH8 | LZE22T | Human | Esophagus | ESCC | 1.12e-05 | 8.72e-02 | 0.068 |
| Page: 1 2 3 4 5 6 7 8 9 10 |
| Tissue | Expression Dynamics | Abbreviation |
| Cervix | 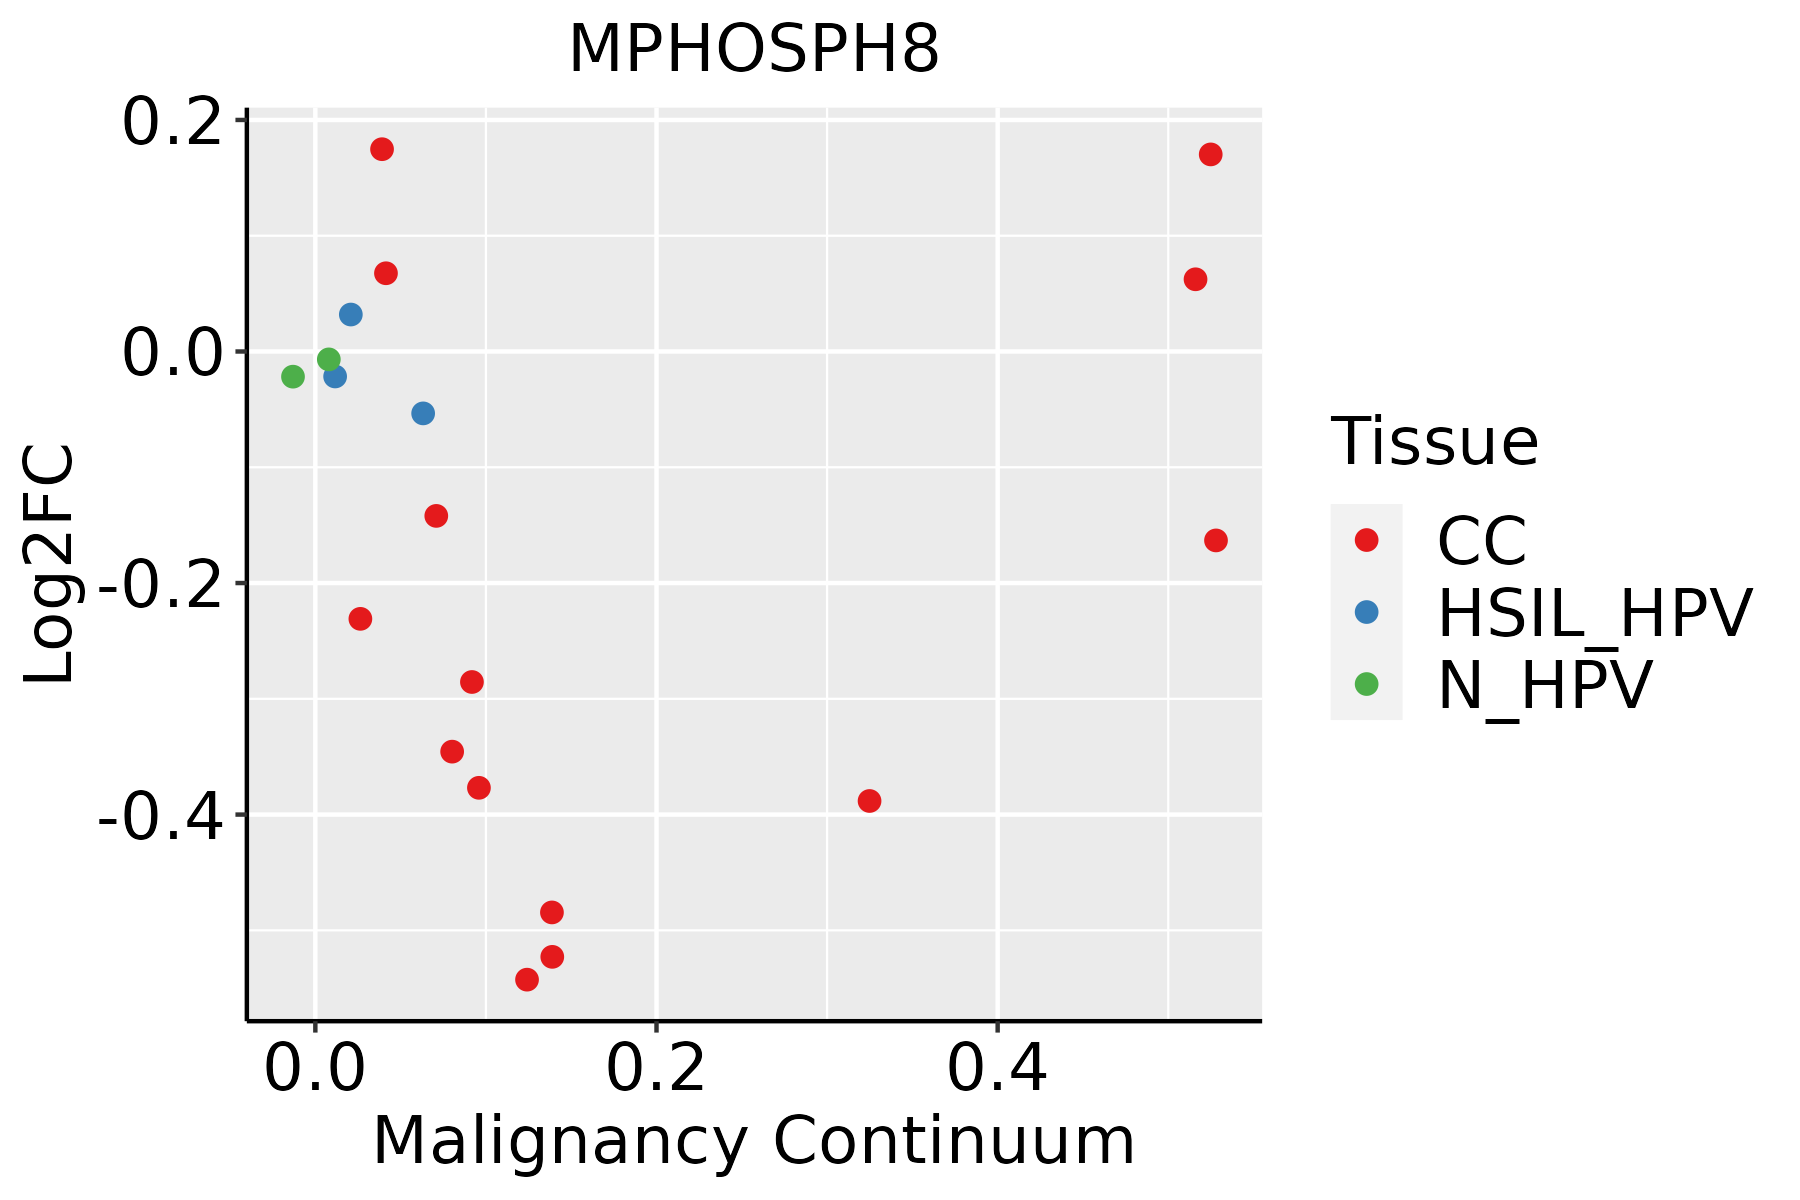 | CC: Cervix cancer |
| HSIL_HPV: HPV-infected high-grade squamous intraepithelial lesions | ||
| N_HPV: HPV-infected normal cervix | ||
| Colorectum (GSE201348) |  | FAP: Familial adenomatous polyposis |
| CRC: Colorectal cancer | ||
| Colorectum (HTA11) |  | AD: Adenomas |
| SER: Sessile serrated lesions | ||
| MSI-H: Microsatellite-high colorectal cancer | ||
| MSS: Microsatellite stable colorectal cancer | ||
| Endometrium | 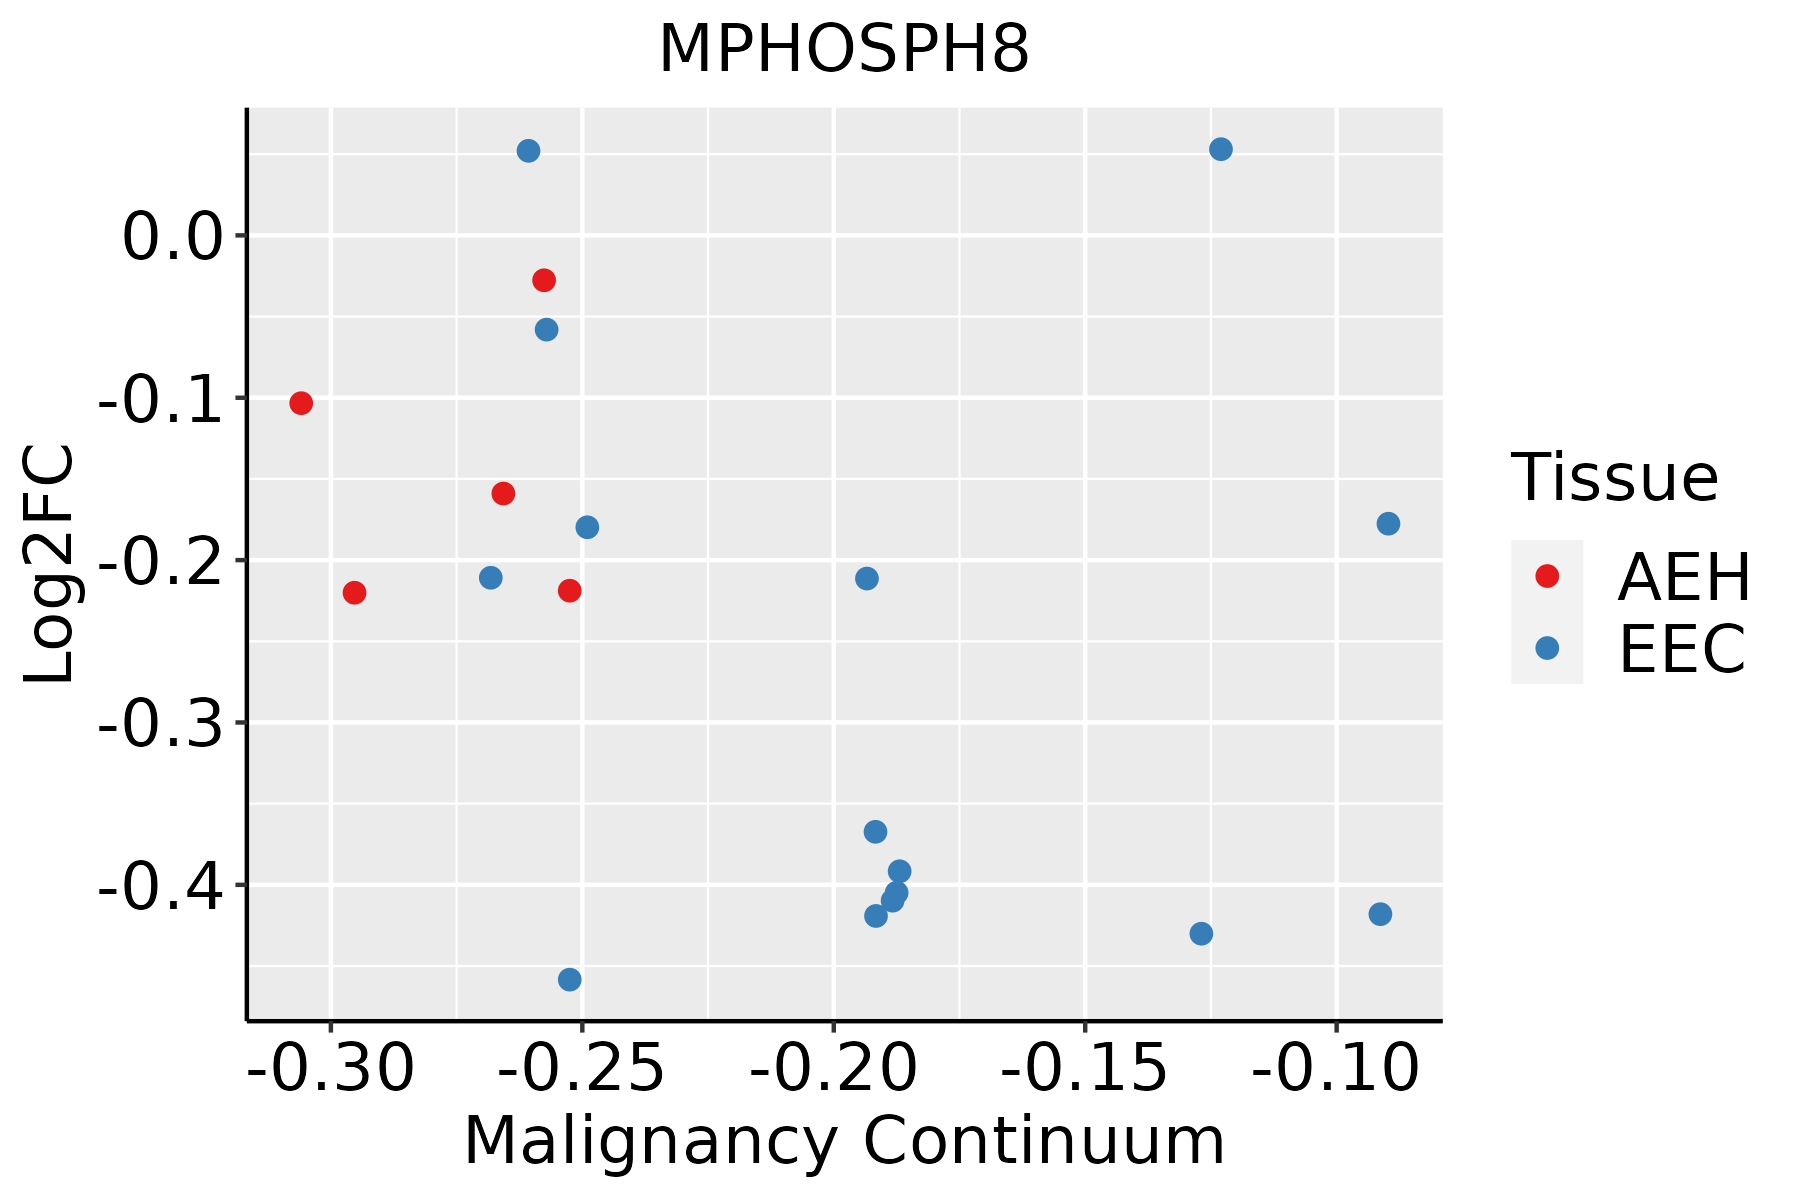 | AEH: Atypical endometrial hyperplasia |
| EEC: Endometrioid Cancer | ||
| Esophagus | 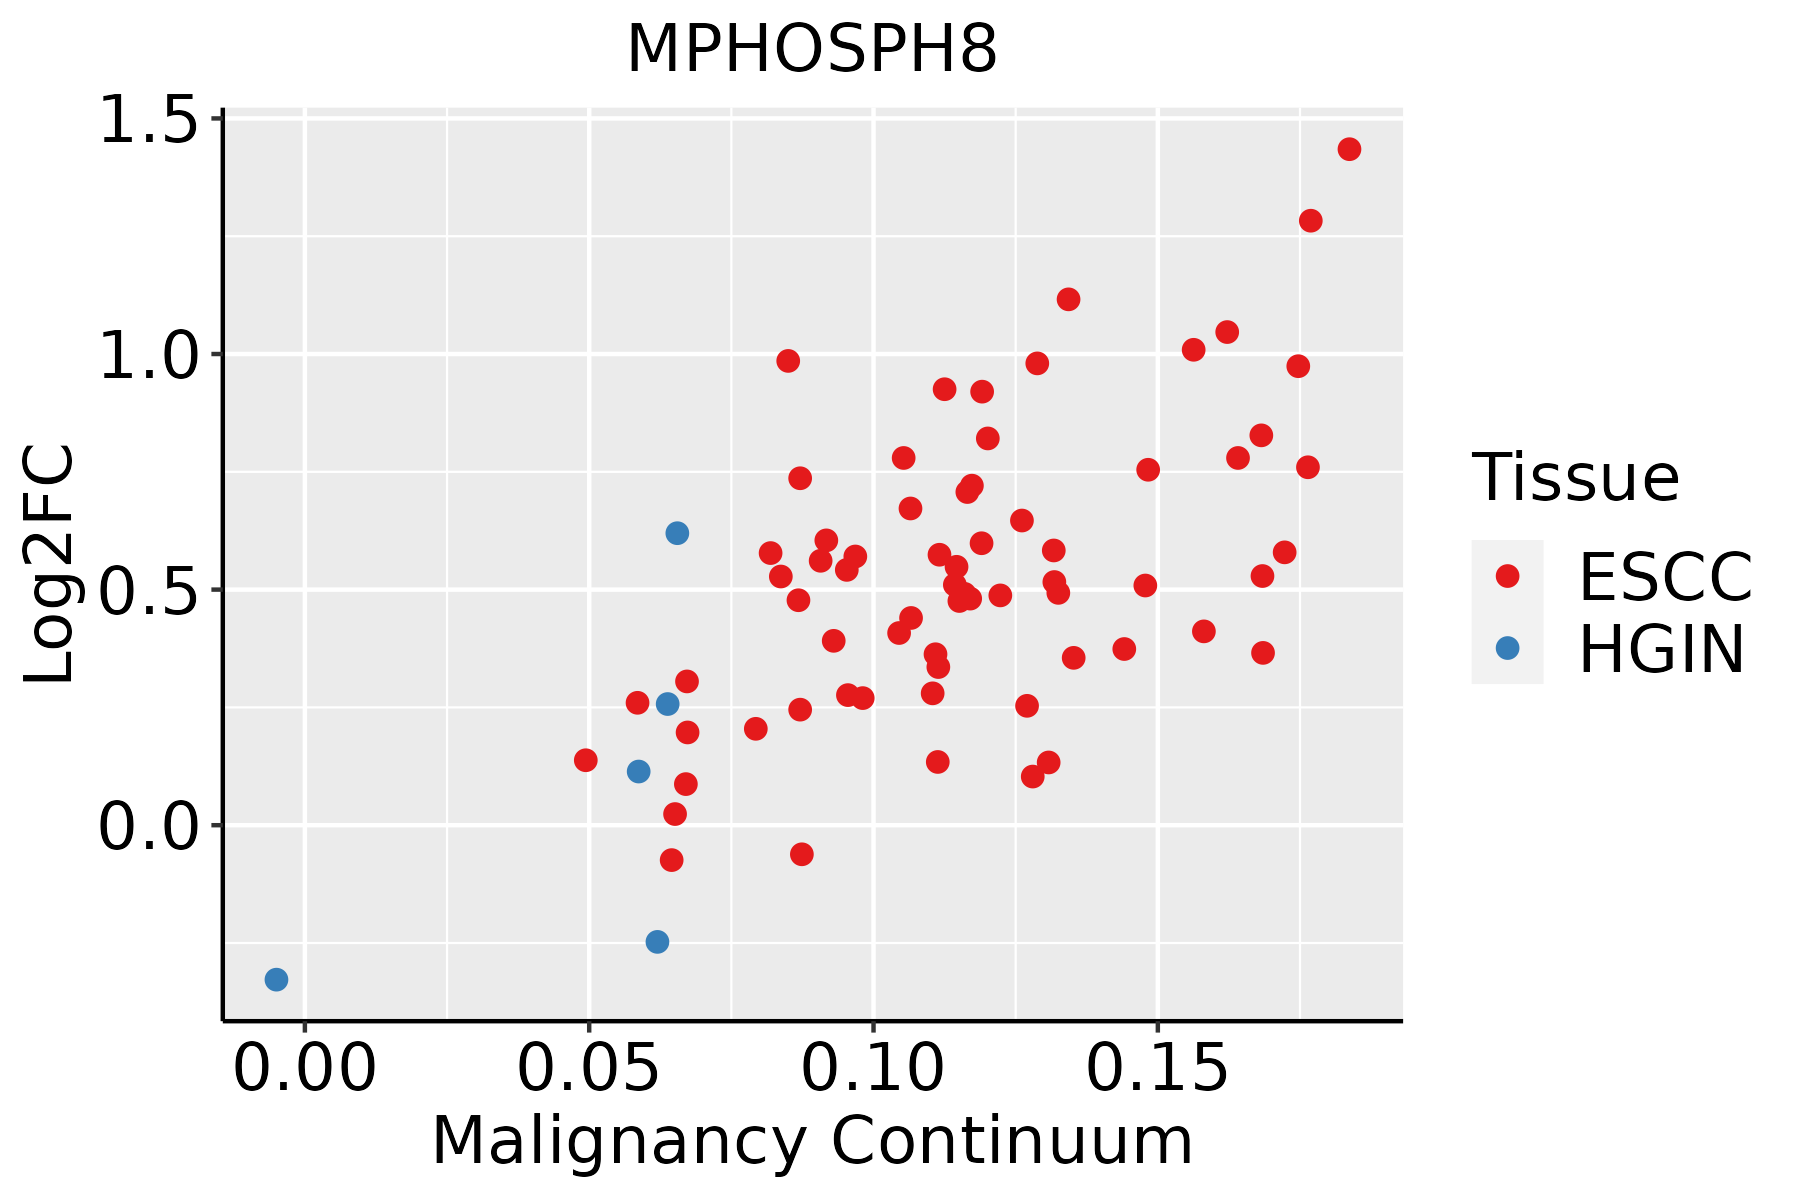 | ESCC: Esophageal squamous cell carcinoma |
| HGIN: High-grade intraepithelial neoplasias | ||
| LGIN: Low-grade intraepithelial neoplasias | ||
| Liver | 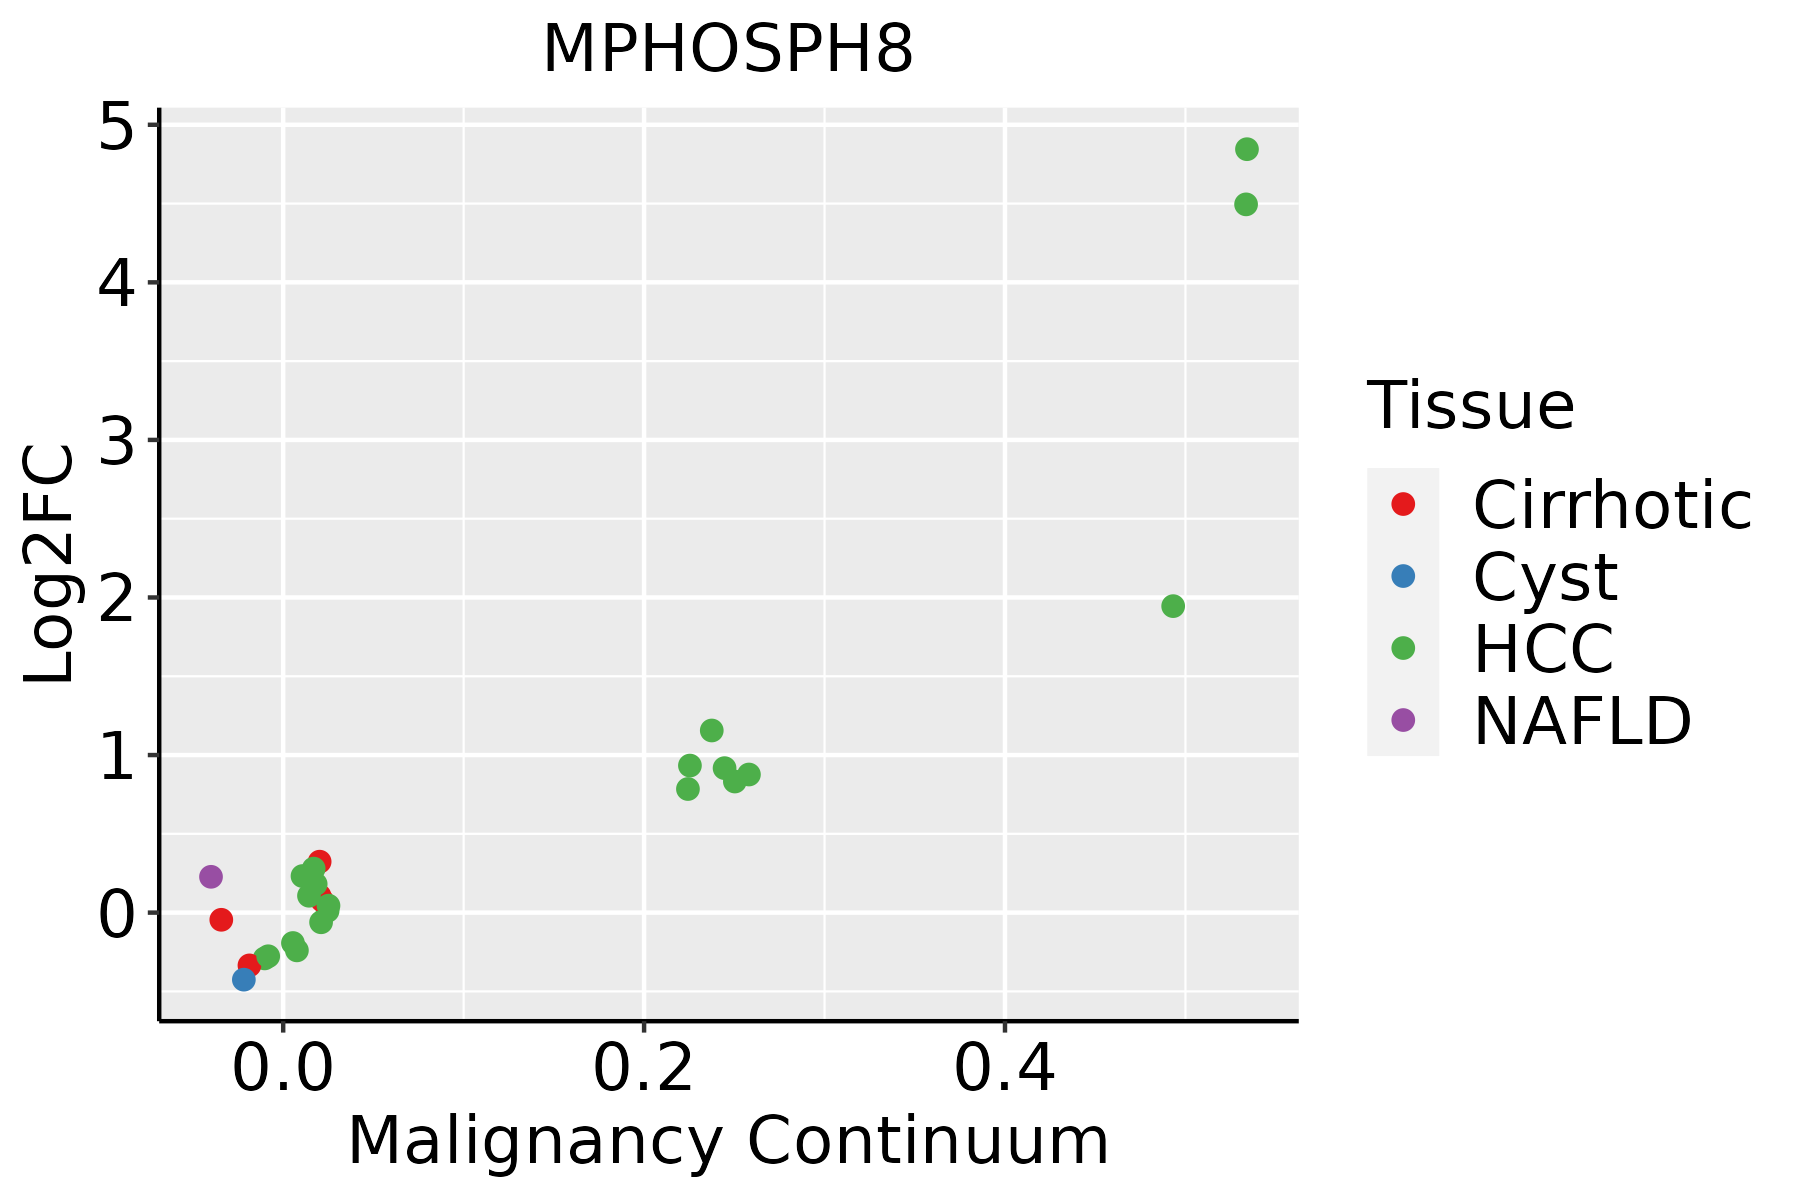 | HCC: Hepatocellular carcinoma |
| NAFLD: Non-alcoholic fatty liver disease | ||
| Oral Cavity | 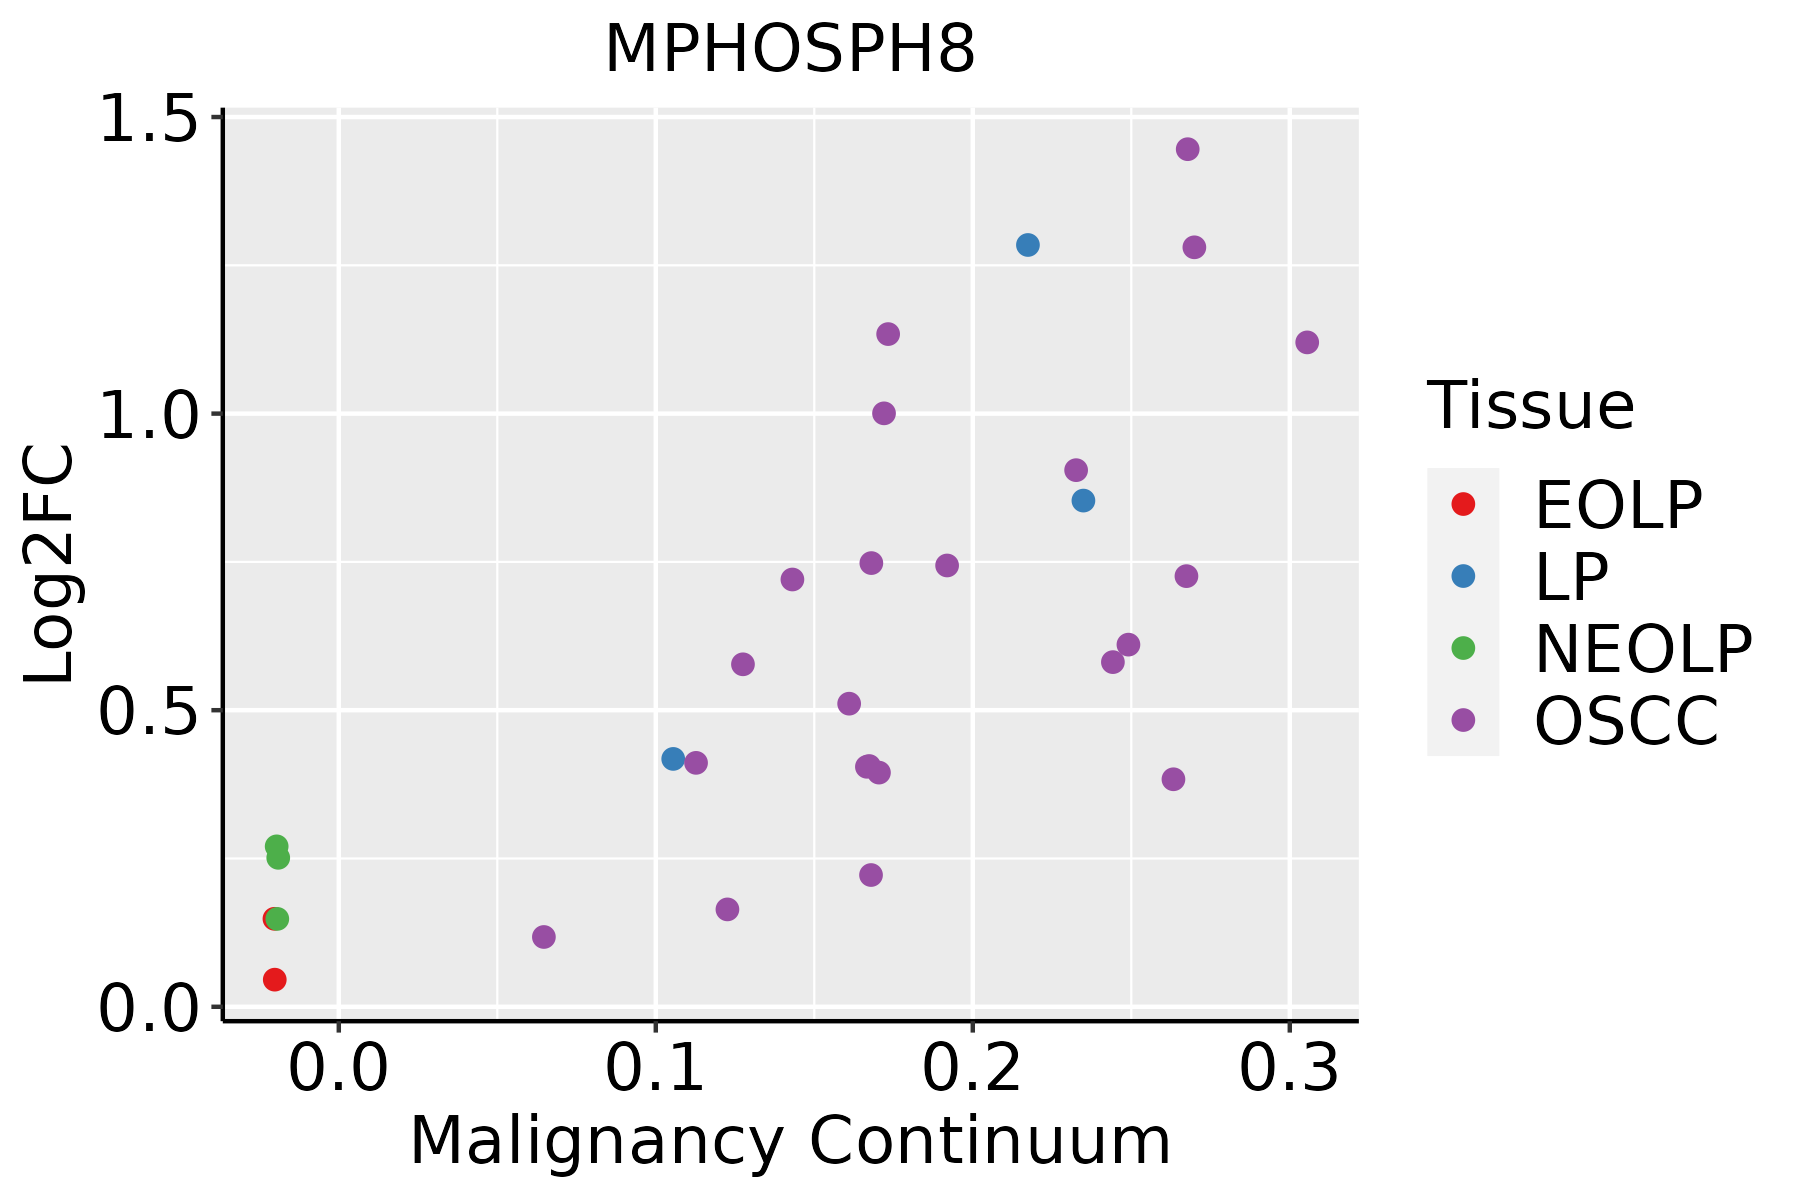 | EOLP: Erosive Oral lichen planus |
| LP: leukoplakia | ||
| NEOLP: Non-erosive oral lichen planus | ||
| OSCC: Oral squamous cell carcinoma | ||
| Prostate | 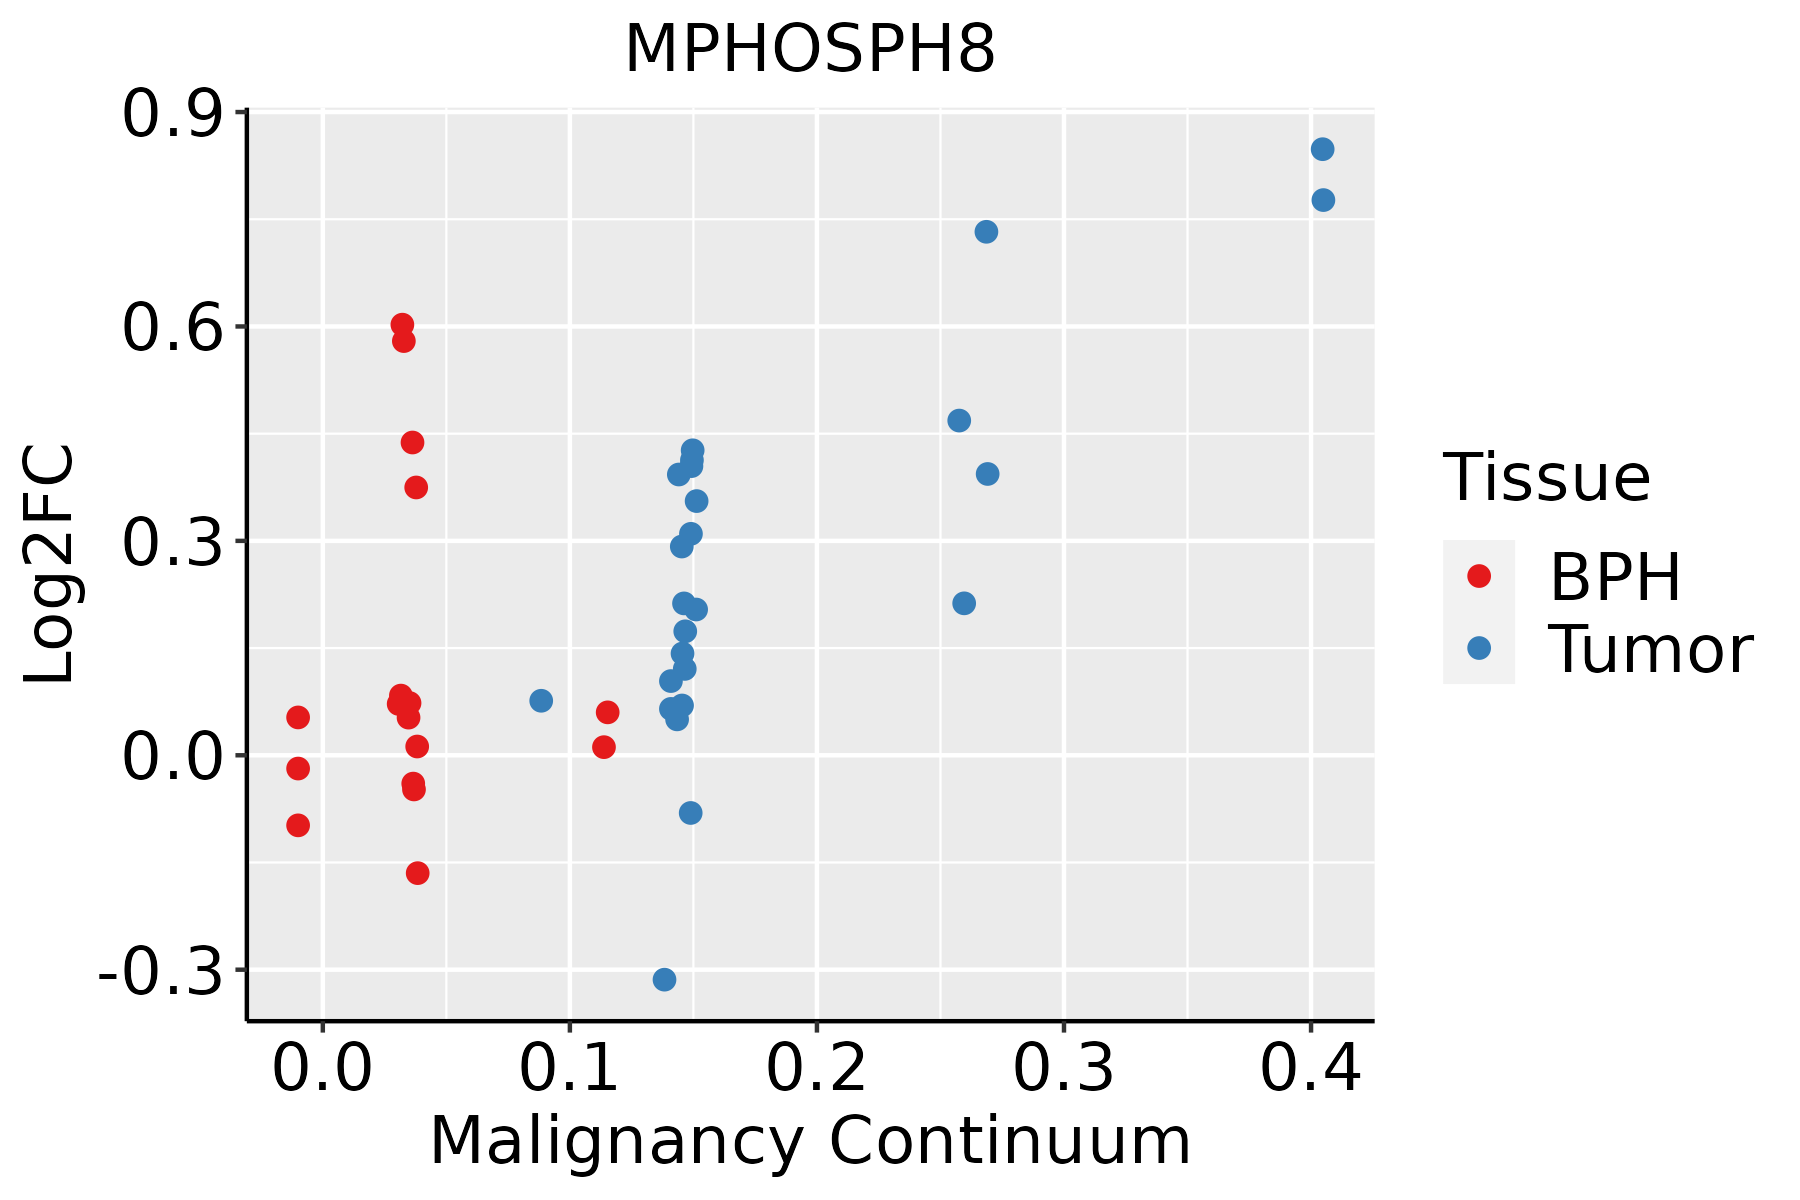 | BPH: Benign Prostatic Hyperplasia |
| Skin | 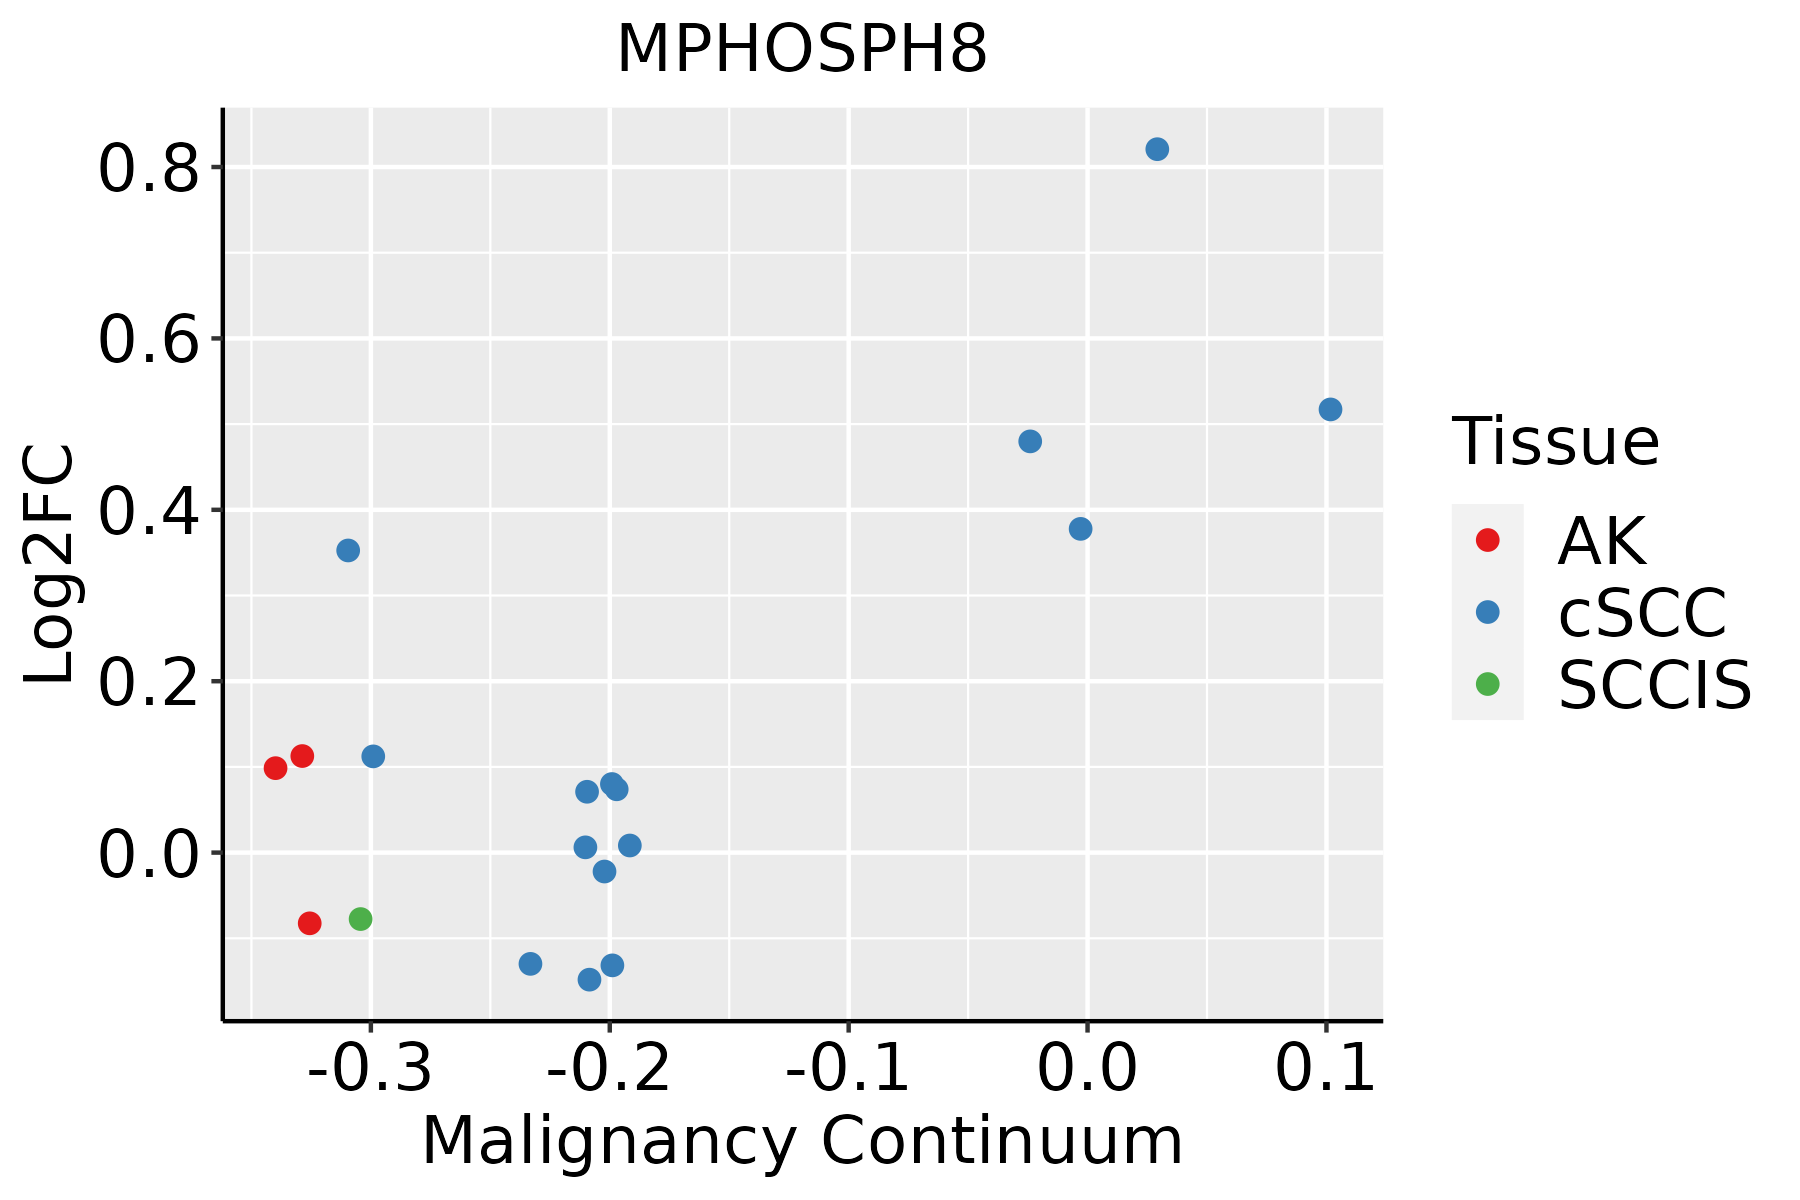 | AK: Actinic keratosis |
| cSCC: Cutaneous squamous cell carcinoma | ||
| SCCIS:squamous cell carcinoma in situ | ||
| Thyroid |  | ATC: Anaplastic thyroid cancer |
| HT: Hashimoto's thyroiditis | ||
| PTC: Papillary thyroid cancer |
| ∗log2FC in expression of this searched gene in stem-like cells from each diseased tissue sample relative to stem-like cells in normal samples in each tissue plotted against the malignancy continuum. Samples are colored based on if they are from different disease stage. |
Top |
Malignant transformation related pathway analysis |
| Find out the enriched GO biological processes and KEGG pathways involved in transition from healthy to precancer to cancer |
| Tissue | Disease Stage | Enriched GO biological Processes |
| Colorectum | AD |  |
| Colorectum | SER |  |
| Colorectum | MSS |  |
| Colorectum | MSI-H |  |
| Colorectum | FAP |  |
| ∗Top 15 enriched GO BP terms are showed in the bar plot of each disease state in each tissue. Each row represents a significant GO biological process which is colored according to the -log10(p.adjust). |
| Page: 1 2 3 4 5 6 7 8 9 |
| GO ID | Tissue | Disease Stage | Description | Gene Ratio | Bg Ratio | pvalue | p.adjust | Count |
| GO:001603210 | Cervix | CC | viral process | 109/2311 | 415/18723 | 5.40e-15 | 6.46e-12 | 109 |
| GO:001905810 | Cervix | CC | viral life cycle | 87/2311 | 317/18723 | 2.20e-13 | 1.20e-10 | 87 |
| GO:001907910 | Cervix | CC | viral genome replication | 35/2311 | 131/18723 | 6.11e-06 | 1.49e-04 | 35 |
| GO:00063257 | Cervix | CC | chromatin organization | 78/2311 | 409/18723 | 5.40e-05 | 8.02e-04 | 78 |
| GO:005079210 | Cervix | CC | regulation of viral process | 38/2311 | 164/18723 | 8.12e-05 | 1.10e-03 | 38 |
| GO:190390010 | Cervix | CC | regulation of viral life cycle | 33/2311 | 148/18723 | 4.86e-04 | 4.76e-03 | 33 |
| GO:00485256 | Cervix | CC | negative regulation of viral process | 23/2311 | 92/18723 | 6.39e-04 | 5.97e-03 | 23 |
| GO:00510528 | Cervix | CC | regulation of DNA metabolic process | 65/2311 | 359/18723 | 9.25e-04 | 7.84e-03 | 65 |
| GO:00450698 | Cervix | CC | regulation of viral genome replication | 21/2311 | 85/18723 | 1.27e-03 | 1.01e-02 | 21 |
| GO:00450714 | Cervix | CC | negative regulation of viral genome replication | 15/2311 | 56/18723 | 2.60e-03 | 1.80e-02 | 15 |
| GO:0016032 | Colorectum | AD | viral process | 168/3918 | 415/18723 | 4.67e-20 | 3.66e-17 | 168 |
| GO:0019058 | Colorectum | AD | viral life cycle | 119/3918 | 317/18723 | 6.18e-12 | 8.23e-10 | 119 |
| GO:0051052 | Colorectum | AD | regulation of DNA metabolic process | 116/3918 | 359/18723 | 2.47e-07 | 1.00e-05 | 116 |
| GO:0019079 | Colorectum | AD | viral genome replication | 51/3918 | 131/18723 | 1.83e-06 | 5.51e-05 | 51 |
| GO:0050792 | Colorectum | AD | regulation of viral process | 59/3918 | 164/18723 | 5.95e-06 | 1.52e-04 | 59 |
| GO:2001252 | Colorectum | AD | positive regulation of chromosome organization | 35/3918 | 82/18723 | 6.90e-06 | 1.72e-04 | 35 |
| GO:0006325 | Colorectum | AD | chromatin organization | 119/3918 | 409/18723 | 4.85e-05 | 8.33e-04 | 119 |
| GO:1903900 | Colorectum | AD | regulation of viral life cycle | 51/3918 | 148/18723 | 9.01e-05 | 1.38e-03 | 51 |
| GO:0033044 | Colorectum | AD | regulation of chromosome organization | 60/3918 | 187/18723 | 2.25e-04 | 2.94e-03 | 60 |
| GO:0045069 | Colorectum | AD | regulation of viral genome replication | 32/3918 | 85/18723 | 2.97e-04 | 3.60e-03 | 32 |
| Page: 1 2 3 4 5 6 7 8 9 10 11 12 13 14 15 16 |
| Pathway ID | Tissue | Disease Stage | Description | Gene Ratio | Bg Ratio | pvalue | p.adjust | qvalue | Count |
| Page: 1 |
Top |
Cell-cell communication analysis |
| Identification of potential cell-cell interactions between two cell types and their ligand-receptor pairs for different disease states |
| Ligand | Receptor | LRpair | Pathway | Tissue | Disease Stage |
| Page: 1 |
Top |
Single-cell gene regulatory network inference analysis |
| Find out the significant the regulons (TFs) and the target genes of each regulon across cell types for different disease states |
| TF | Cell Type | Tissue | Disease Stage | Target Gene | RSS | Regulon Activity |
| ∗The dot plots of a searched regulon are shown for all cell subpopulations in each disease state of each tissue based on the regulon specific score inferred using pySCENIC and by calculating the average expression. |
| Page: 1 |
Top |
Somatic mutation of malignant transformation related genes |
| Annotation of somatic variants for genes involved in malignant transformation |
| Hugo Symbol | Variant Class | Variant Classification | dbSNP RS | HGVSc | HGVSp | HGVSp Short | SWISSPROT | BIOTYPE | SIFT | PolyPhen | Tumor Sample Barcode | Tissue | Histology | Sex | Age | Stage | Therapy Types | Drugs | Outcome |
| MPHOSPH8 | SNV | Missense_Mutation | c.1802N>T | p.Gly601Val | p.G601V | Q99549 | protein_coding | deleterious(0) | probably_damaging(1) | TCGA-A2-A25A-01 | Breast | breast invasive carcinoma | Female | <65 | I/II | Unspecific | Cytoxan | SD | |
| MPHOSPH8 | SNV | Missense_Mutation | c.718N>T | p.Thr240Ser | p.T240S | Q99549 | protein_coding | tolerated_low_confidence(0.17) | benign(0.057) | TCGA-AN-A0FJ-01 | Breast | breast invasive carcinoma | Female | <65 | III/IV | Unknown | Unknown | SD | |
| MPHOSPH8 | SNV | Missense_Mutation | c.1691N>A | p.Ala564Glu | p.A564E | Q99549 | protein_coding | tolerated(0.44) | benign(0.015) | TCGA-BH-A0AW-01 | Breast | breast invasive carcinoma | Female | <65 | I/II | Chemotherapy | carboplatin | SD | |
| MPHOSPH8 | SNV | Missense_Mutation | novel | c.742N>A | p.Glu248Lys | p.E248K | Q99549 | protein_coding | deleterious_low_confidence(0) | benign(0.033) | TCGA-C8-A3M7-01 | Breast | breast invasive carcinoma | Female | <65 | III/IV | Unknown | Unknown | PD |
| MPHOSPH8 | SNV | Missense_Mutation | c.1973C>T | p.Ala658Val | p.A658V | Q99549 | protein_coding | deleterious(0.05) | probably_damaging(0.984) | TCGA-D8-A1JT-01 | Breast | breast invasive carcinoma | Female | >=65 | I/II | Hormone Therapy | arimidex | SD | |
| MPHOSPH8 | SNV | Missense_Mutation | rs745974518 | c.1567N>A | p.Glu523Lys | p.E523K | Q99549 | protein_coding | tolerated(0.13) | benign(0.046) | TCGA-EK-A3GK-01 | Cervix | cervical & endocervical cancer | Female | <65 | I/II | Unknown | Unknown | SD |
| MPHOSPH8 | SNV | Missense_Mutation | c.2062G>C | p.Glu688Gln | p.E688Q | Q99549 | protein_coding | deleterious(0.03) | probably_damaging(0.999) | TCGA-IR-A3LA-01 | Cervix | cervical & endocervical cancer | Female | <65 | I/II | Chemotherapy | cisplatin | CR | |
| MPHOSPH8 | SNV | Missense_Mutation | novel | c.625N>A | p.Glu209Lys | p.E209K | Q99549 | protein_coding | deleterious_low_confidence(0) | benign(0.03) | TCGA-VS-A950-01 | Cervix | cervical & endocervical cancer | Female | <65 | III/IV | Unknown | Unknown | SD |
| MPHOSPH8 | SNV | Missense_Mutation | novel | c.2281N>C | p.Asp761His | p.D761H | Q99549 | protein_coding | deleterious(0) | probably_damaging(0.999) | TCGA-VS-A953-01 | Cervix | cervical & endocervical cancer | Female | <65 | I/II | Unknown | Unknown | PD |
| MPHOSPH8 | SNV | Missense_Mutation | novel | c.1927G>C | p.Glu643Gln | p.E643Q | Q99549 | protein_coding | tolerated(0.06) | probably_damaging(0.994) | TCGA-VS-A9V3-01 | Cervix | cervical & endocervical cancer | Female | <65 | I/II | Chemotherapy | cisplatin | PD |
| Page: 1 2 3 4 5 6 7 8 |
Top |
Related drugs of malignant transformation related genes |
| Identification of chemicals and drugs interact with genes involved in malignant transfromation |
| (DGIdb 4.0) |
| Entrez ID | Symbol | Category | Interaction Types | Drug Claim Name | Drug Name | PMIDs |
| 54737 | MPHOSPH8 | NA | SB-224289 | SB-224289 | ||
| 54737 | MPHOSPH8 | NA | BAY-11-7085 | BAY-11-7085 | ||
| 54737 | MPHOSPH8 | NA | PROCHLORPERAZINE | PROCHLORPERAZINE | ||
| 54737 | MPHOSPH8 | NA | NORDIHYDROGUAIARETIC ACID | NORDIHYDROGUAIARETIC ACID | ||
| 54737 | MPHOSPH8 | NA | TYRPHOSTIN AG 879 | TYRPHOSTIN AG 879 | ||
| 54737 | MPHOSPH8 | NA | EBSELEN | EBSELEN | ||
| 54737 | MPHOSPH8 | NA | INDIRUBIN SULFATE | SU-9516 | ||
| 54737 | MPHOSPH8 | NA | BENSERAZIDE HYDROCHLORIDE | BENSERAZIDE HYDROCHLORIDE | ||
| 54737 | MPHOSPH8 | NA | TAMOXIFEN CITRATE | TAMOXIFEN CITRATE | ||
| 54737 | MPHOSPH8 | NA | PICEATANNOL | PICEATANNOL |
| Page: 1 2 3 4 5 6 7 8 9 10 11 12 |

Copyright 2023-Present -The University of Texas Health Science Center at Houston |