
|
|||||
|
 | |
| |
| |
| |
| |
| |
|
Gene: MORF4L1 |
Gene summary for MORF4L1 |
| Gene information | Species | Human | Gene symbol | MORF4L1 | Gene ID | 10933 |
| Gene name | mortality factor 4 like 1 | |
| Gene Alias | Eaf3 | |
| Cytomap | 15q25.1 | |
| Gene Type | protein-coding | GO ID | GO:0000724 | UniProtAcc | Q9UBU8 |
Top |
Malignant transformation analysis |
| Identification of the aberrant gene expression in precancerous and cancerous lesions by comparing the gene expression of stem-like cells in diseased tissues with normal stem cells |
| Entrez ID | Symbol | Replicates | Species | Organ | Tissue | Adj P-value | Log2FC | Malignancy |
| 10933 | MORF4L1 | LZE4T | Human | Esophagus | ESCC | 7.58e-24 | 1.24e+00 | 0.0811 |
| 10933 | MORF4L1 | LZE7T | Human | Esophagus | ESCC | 1.48e-08 | 1.38e+00 | 0.0667 |
| 10933 | MORF4L1 | LZE8T | Human | Esophagus | ESCC | 2.07e-16 | 1.08e+00 | 0.067 |
| 10933 | MORF4L1 | LZE20T | Human | Esophagus | ESCC | 7.90e-04 | 2.70e-01 | 0.0662 |
| 10933 | MORF4L1 | LZE22T | Human | Esophagus | ESCC | 2.32e-02 | 8.26e-01 | 0.068 |
| 10933 | MORF4L1 | LZE24T | Human | Esophagus | ESCC | 1.07e-18 | 1.01e+00 | 0.0596 |
| 10933 | MORF4L1 | LZE6T | Human | Esophagus | ESCC | 5.19e-13 | 1.23e+00 | 0.0845 |
| 10933 | MORF4L1 | P1T-E | Human | Esophagus | ESCC | 5.62e-17 | 1.50e+00 | 0.0875 |
| 10933 | MORF4L1 | P2T-E | Human | Esophagus | ESCC | 1.49e-51 | 1.34e+00 | 0.1177 |
| 10933 | MORF4L1 | P4T-E | Human | Esophagus | ESCC | 2.36e-54 | 1.81e+00 | 0.1323 |
| 10933 | MORF4L1 | P5T-E | Human | Esophagus | ESCC | 1.64e-13 | 6.90e-01 | 0.1327 |
| 10933 | MORF4L1 | P8T-E | Human | Esophagus | ESCC | 2.41e-72 | 1.96e+00 | 0.0889 |
| 10933 | MORF4L1 | P9T-E | Human | Esophagus | ESCC | 9.67e-30 | 1.24e+00 | 0.1131 |
| 10933 | MORF4L1 | P10T-E | Human | Esophagus | ESCC | 4.85e-77 | 1.86e+00 | 0.116 |
| 10933 | MORF4L1 | P11T-E | Human | Esophagus | ESCC | 2.89e-29 | 1.54e+00 | 0.1426 |
| 10933 | MORF4L1 | P12T-E | Human | Esophagus | ESCC | 1.59e-49 | 1.46e+00 | 0.1122 |
| 10933 | MORF4L1 | P15T-E | Human | Esophagus | ESCC | 3.42e-51 | 1.59e+00 | 0.1149 |
| 10933 | MORF4L1 | P16T-E | Human | Esophagus | ESCC | 6.02e-54 | 1.68e+00 | 0.1153 |
| 10933 | MORF4L1 | P17T-E | Human | Esophagus | ESCC | 1.68e-08 | 1.08e+00 | 0.1278 |
| 10933 | MORF4L1 | P19T-E | Human | Esophagus | ESCC | 1.82e-23 | 2.15e+00 | 0.1662 |
| Page: 1 2 3 4 5 6 7 8 9 10 11 12 |
| Tissue | Expression Dynamics | Abbreviation |
| Colorectum (GSE201348) | 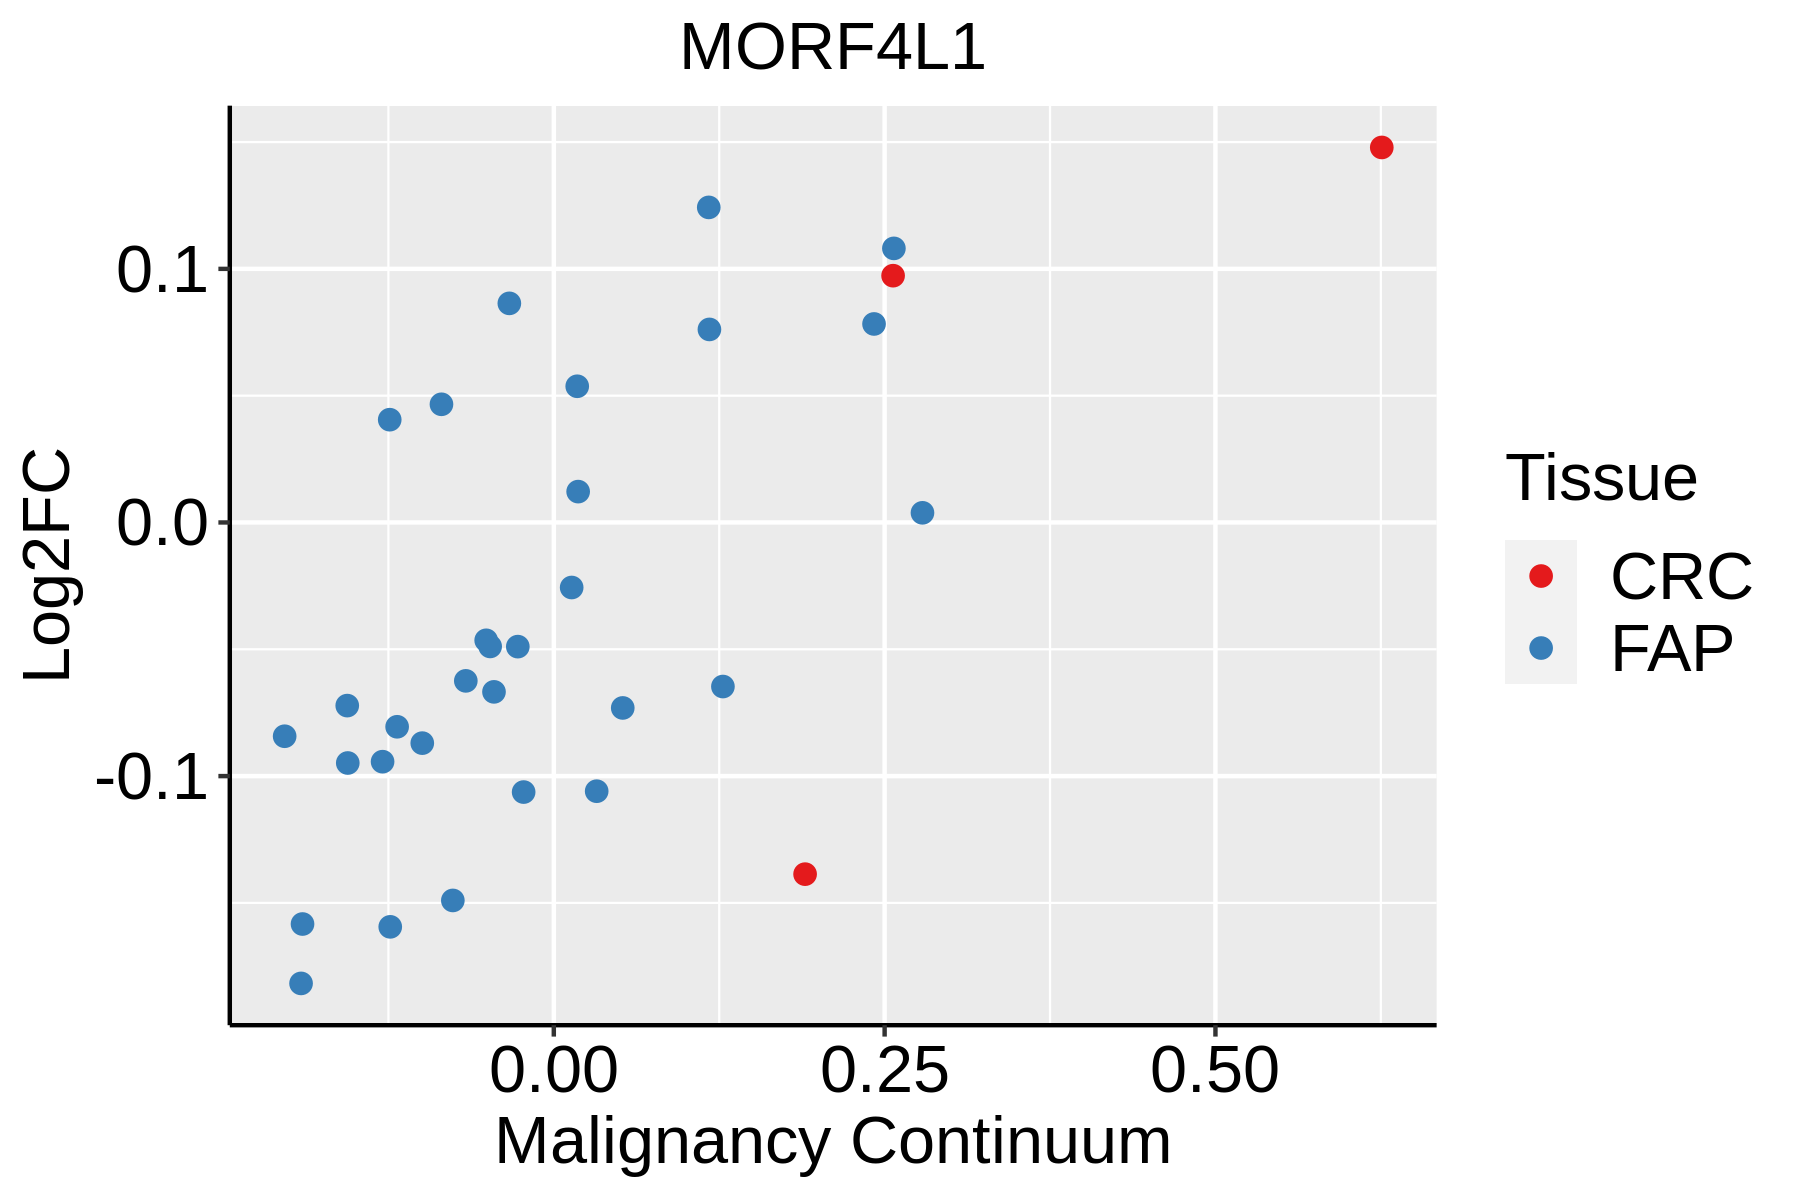 | FAP: Familial adenomatous polyposis |
| CRC: Colorectal cancer | ||
| Colorectum (HTA11) |  | AD: Adenomas |
| SER: Sessile serrated lesions | ||
| MSI-H: Microsatellite-high colorectal cancer | ||
| MSS: Microsatellite stable colorectal cancer | ||
| Endometrium | 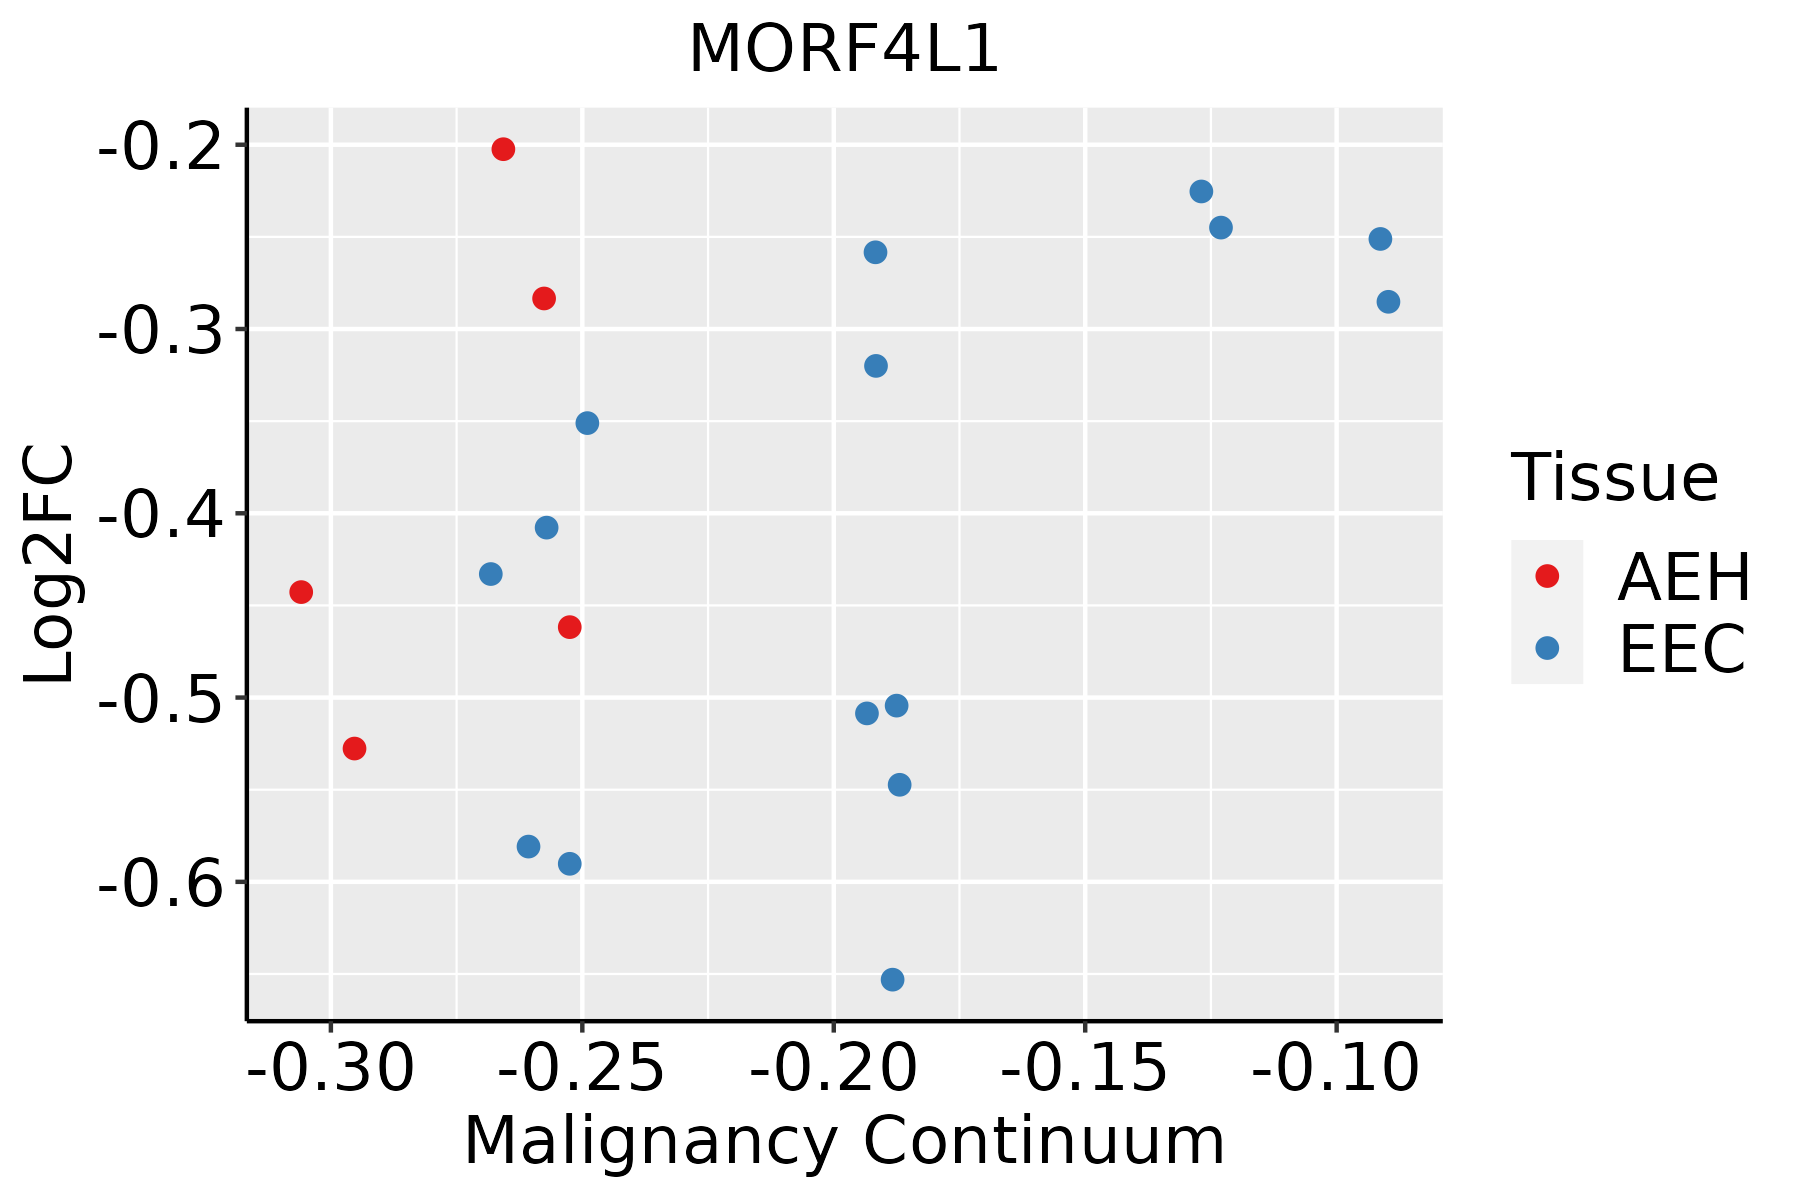 | AEH: Atypical endometrial hyperplasia |
| EEC: Endometrioid Cancer | ||
| Esophagus | 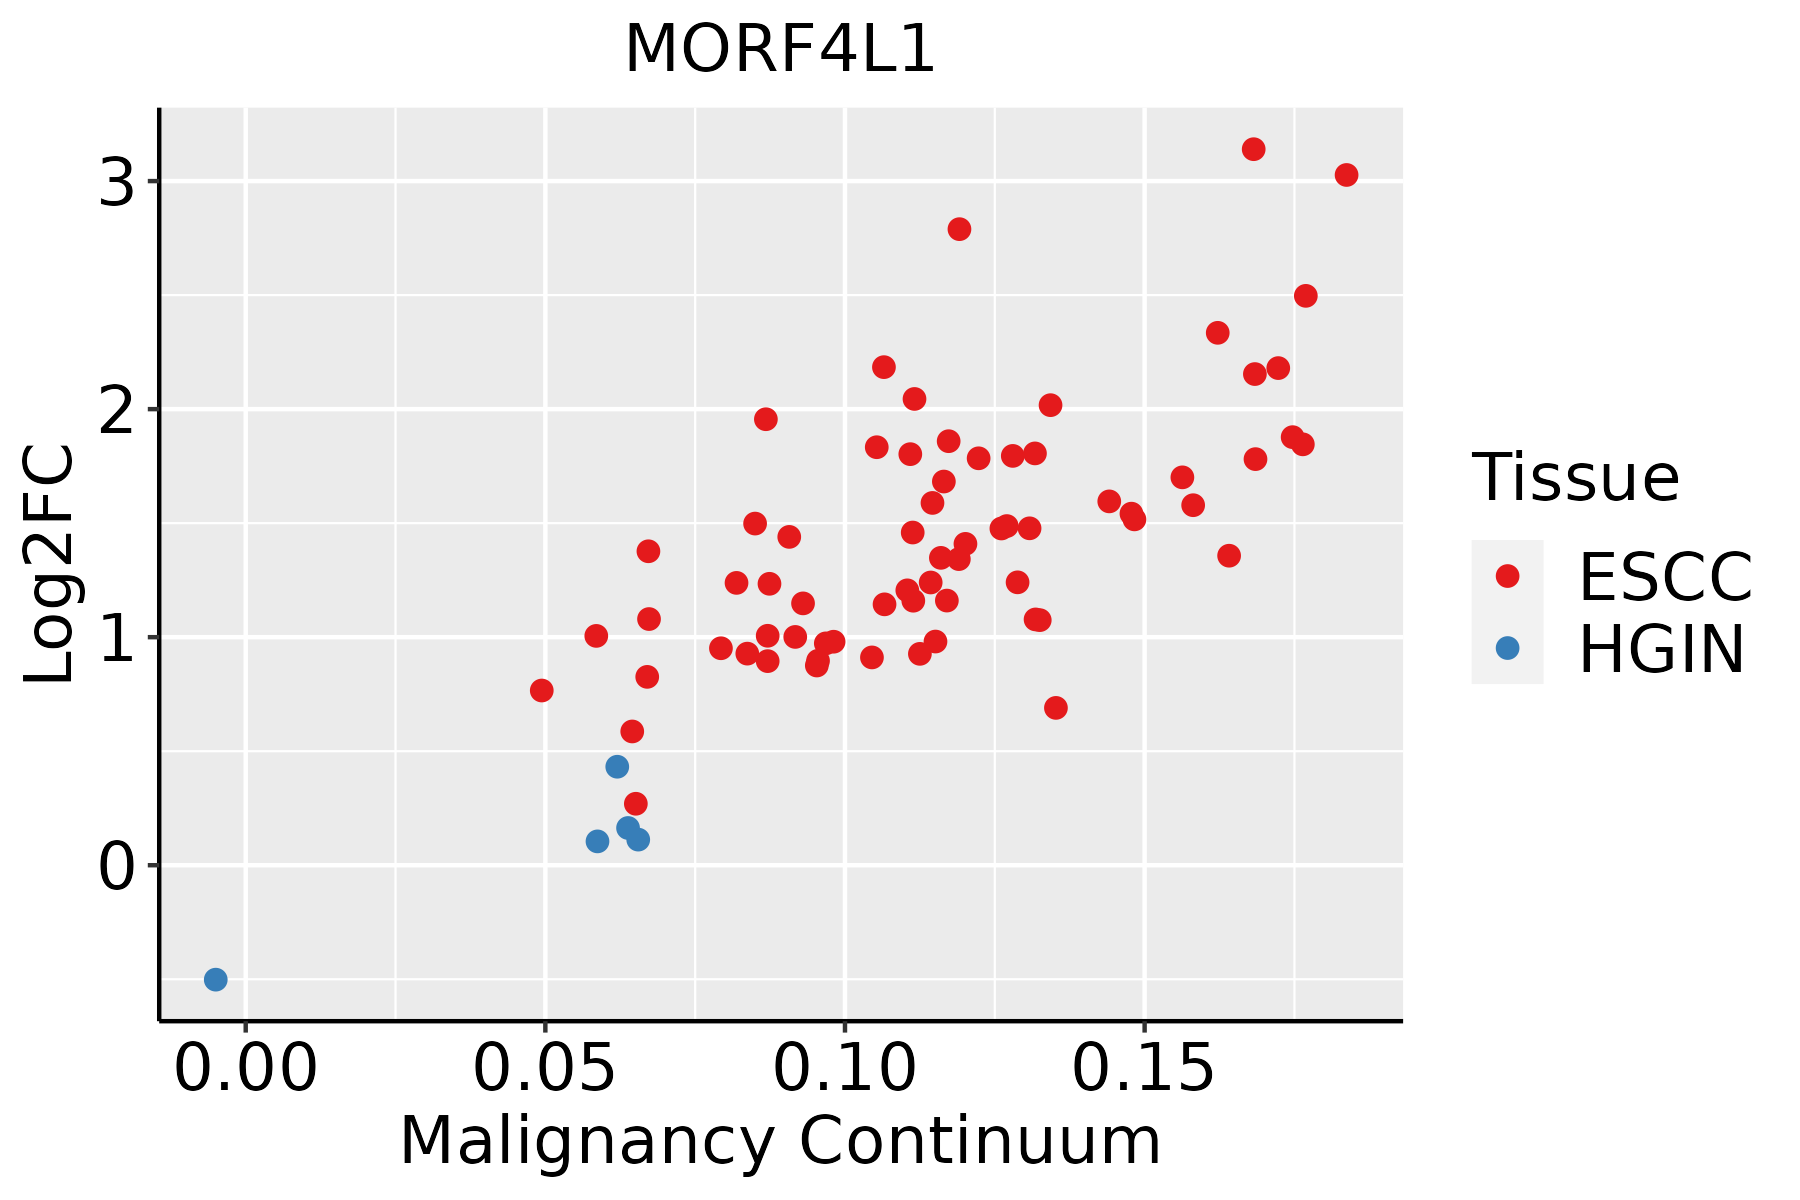 | ESCC: Esophageal squamous cell carcinoma |
| HGIN: High-grade intraepithelial neoplasias | ||
| LGIN: Low-grade intraepithelial neoplasias | ||
| Liver | 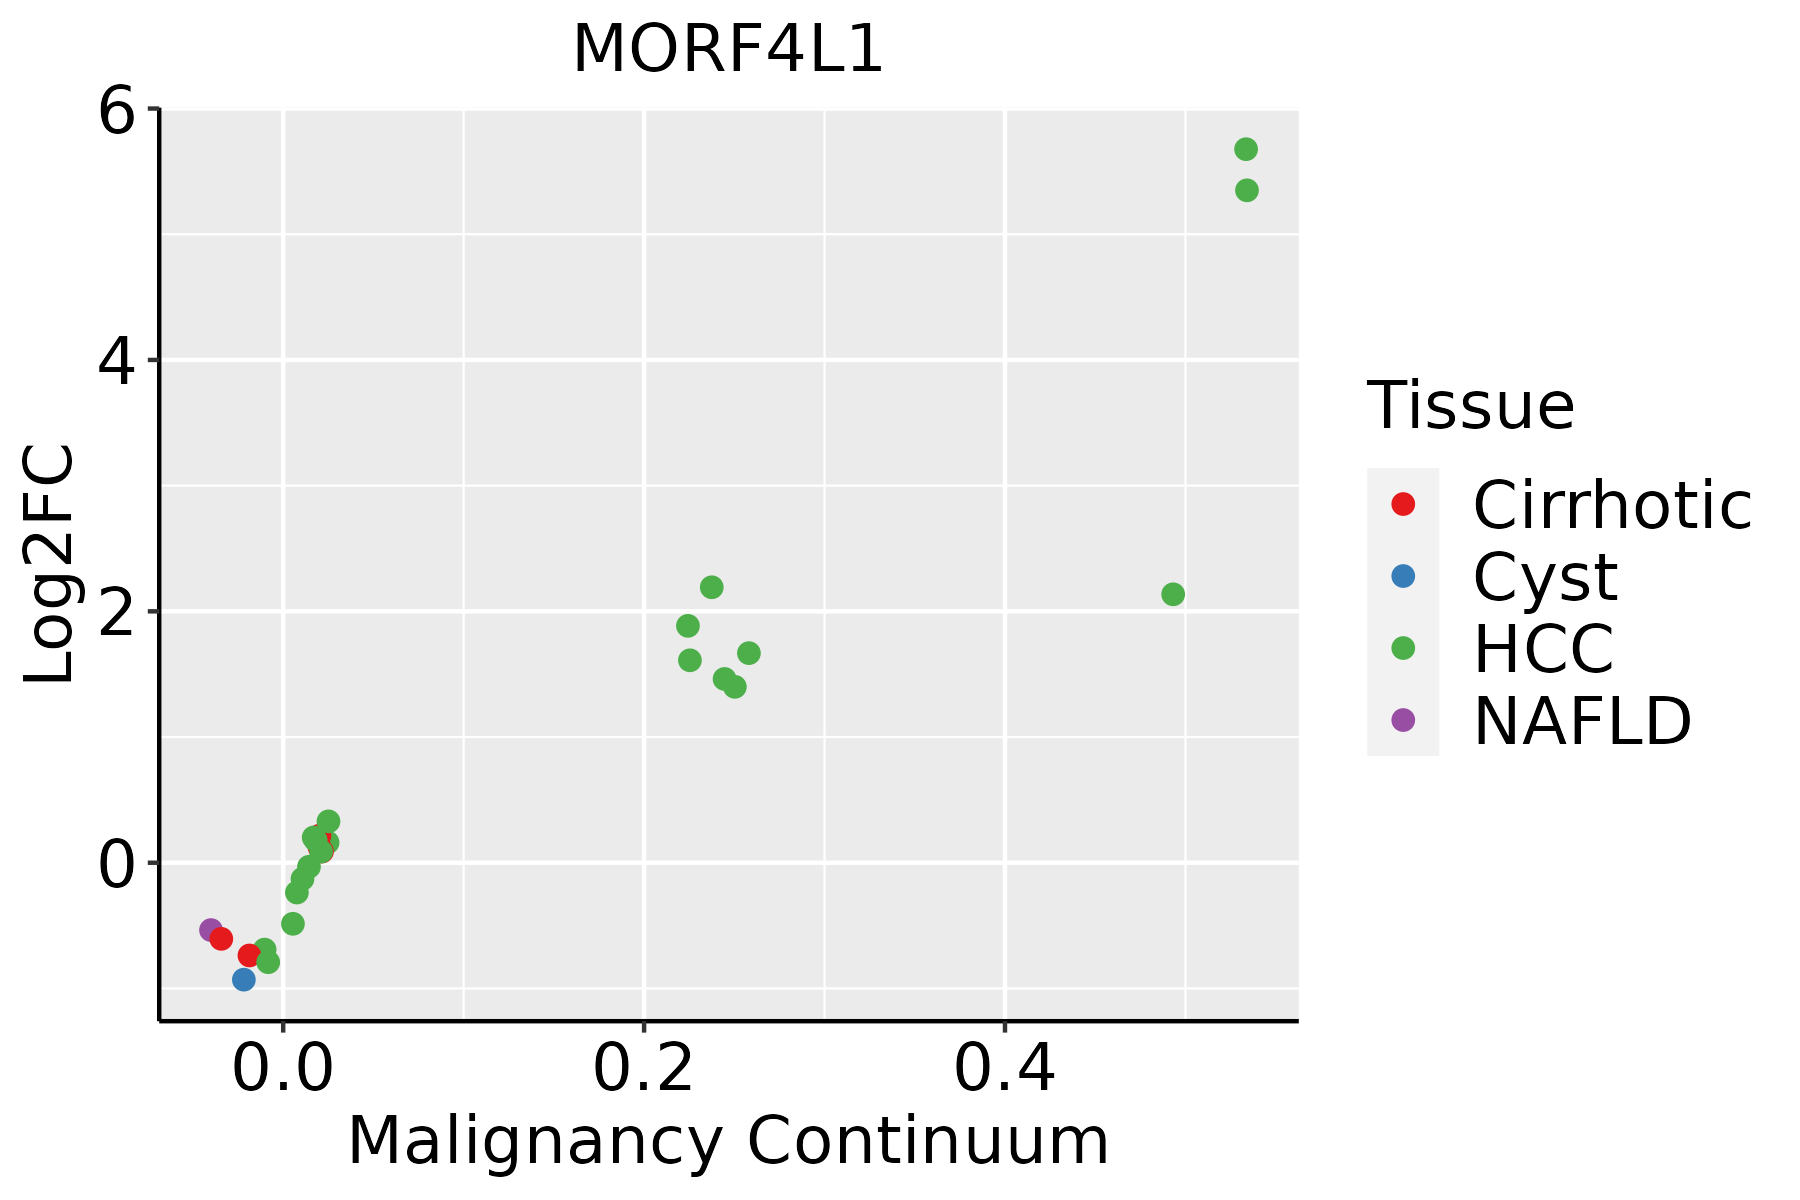 | HCC: Hepatocellular carcinoma |
| NAFLD: Non-alcoholic fatty liver disease | ||
| Oral Cavity |  | EOLP: Erosive Oral lichen planus |
| LP: leukoplakia | ||
| NEOLP: Non-erosive oral lichen planus | ||
| OSCC: Oral squamous cell carcinoma | ||
| Prostate | 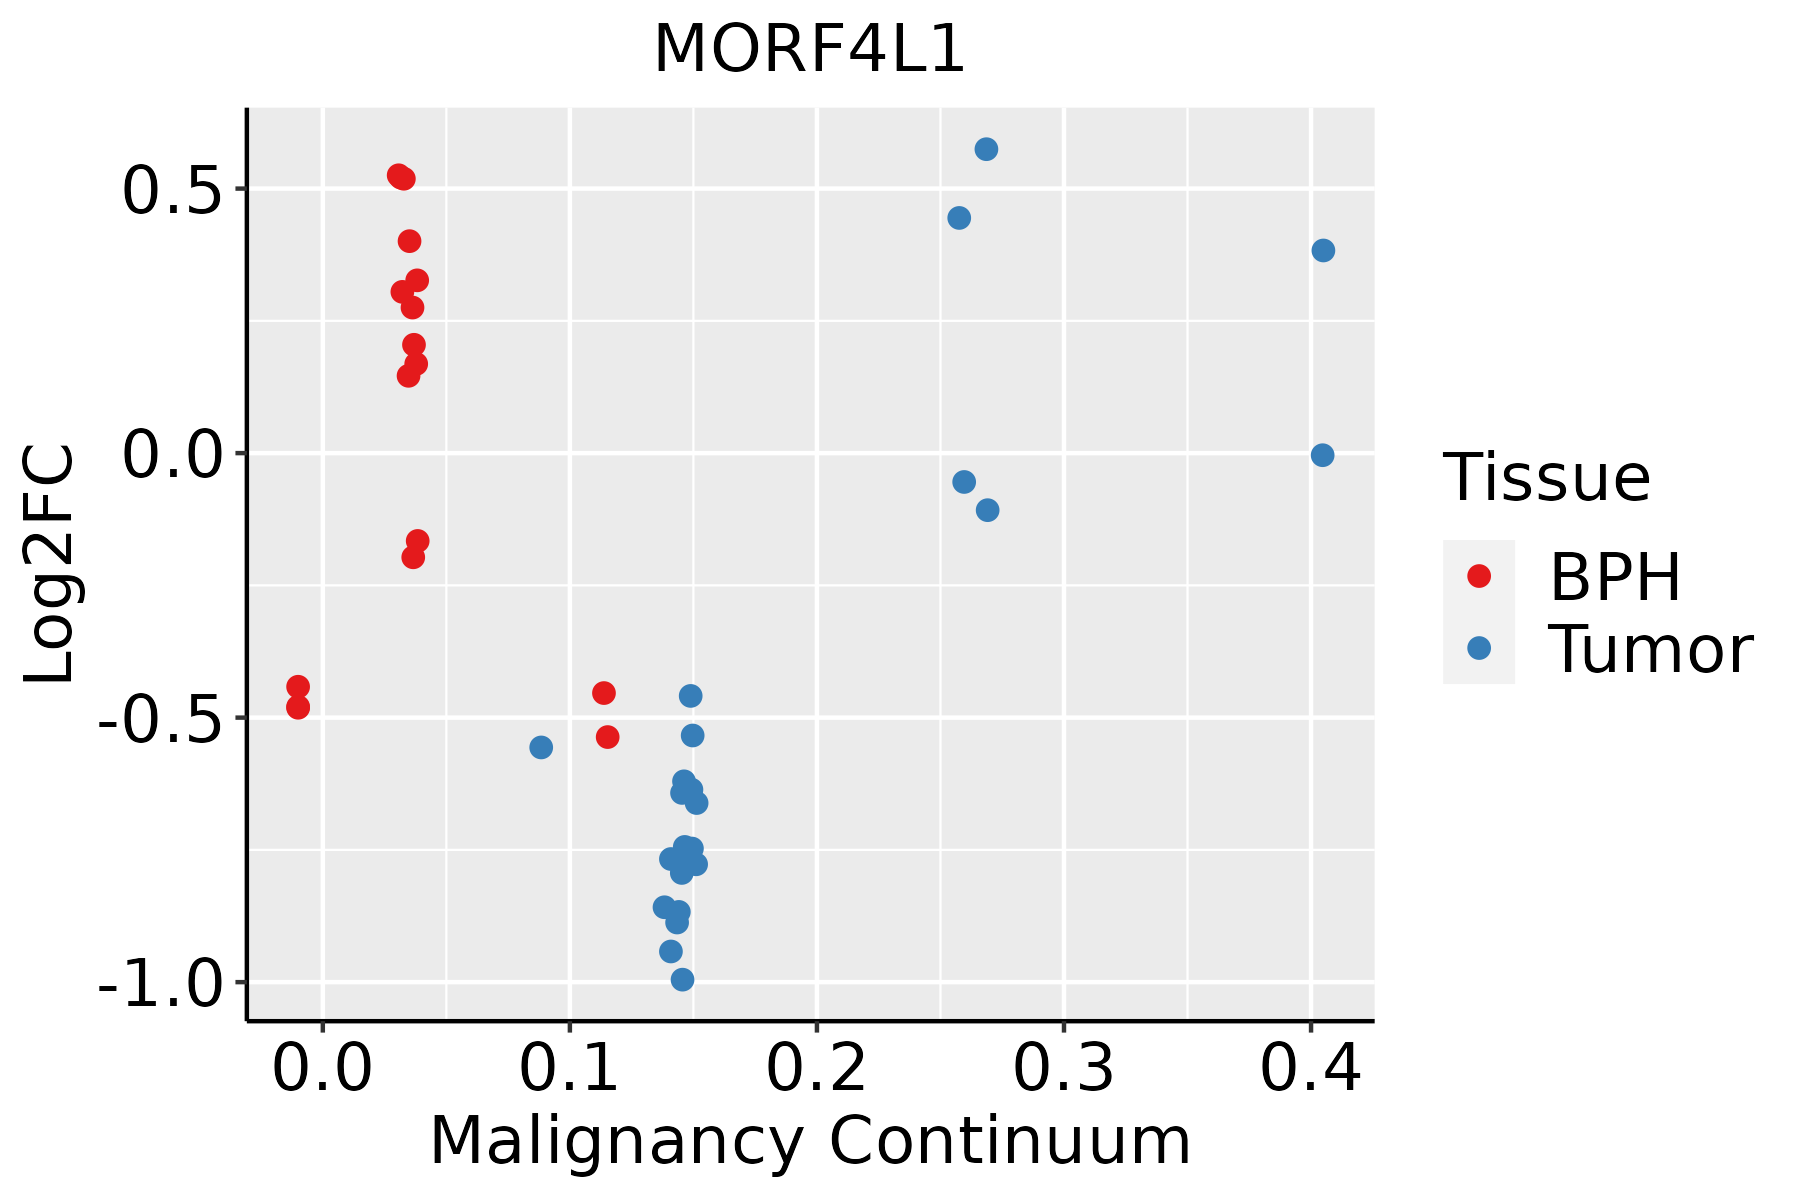 | BPH: Benign Prostatic Hyperplasia |
| Skin | 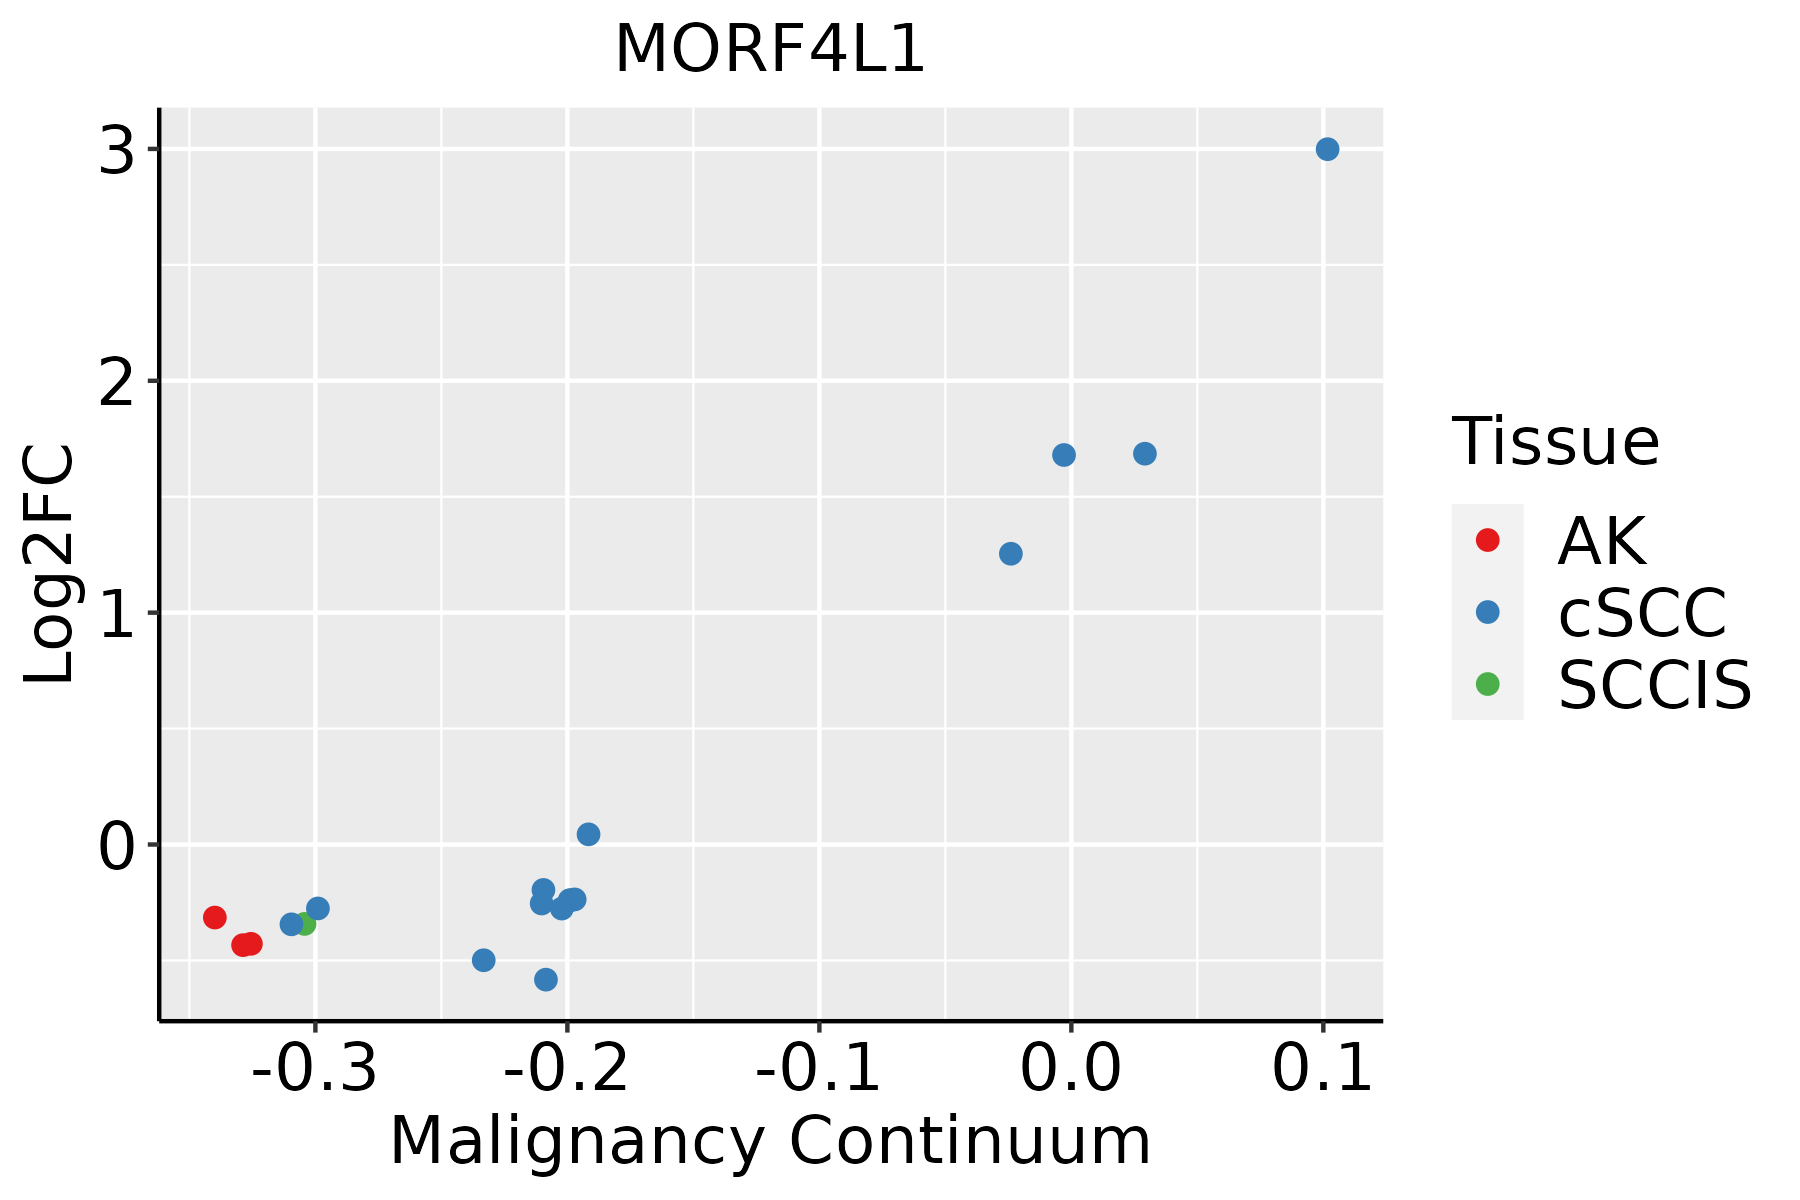 | AK: Actinic keratosis |
| cSCC: Cutaneous squamous cell carcinoma | ||
| SCCIS:squamous cell carcinoma in situ | ||
| Thyroid | 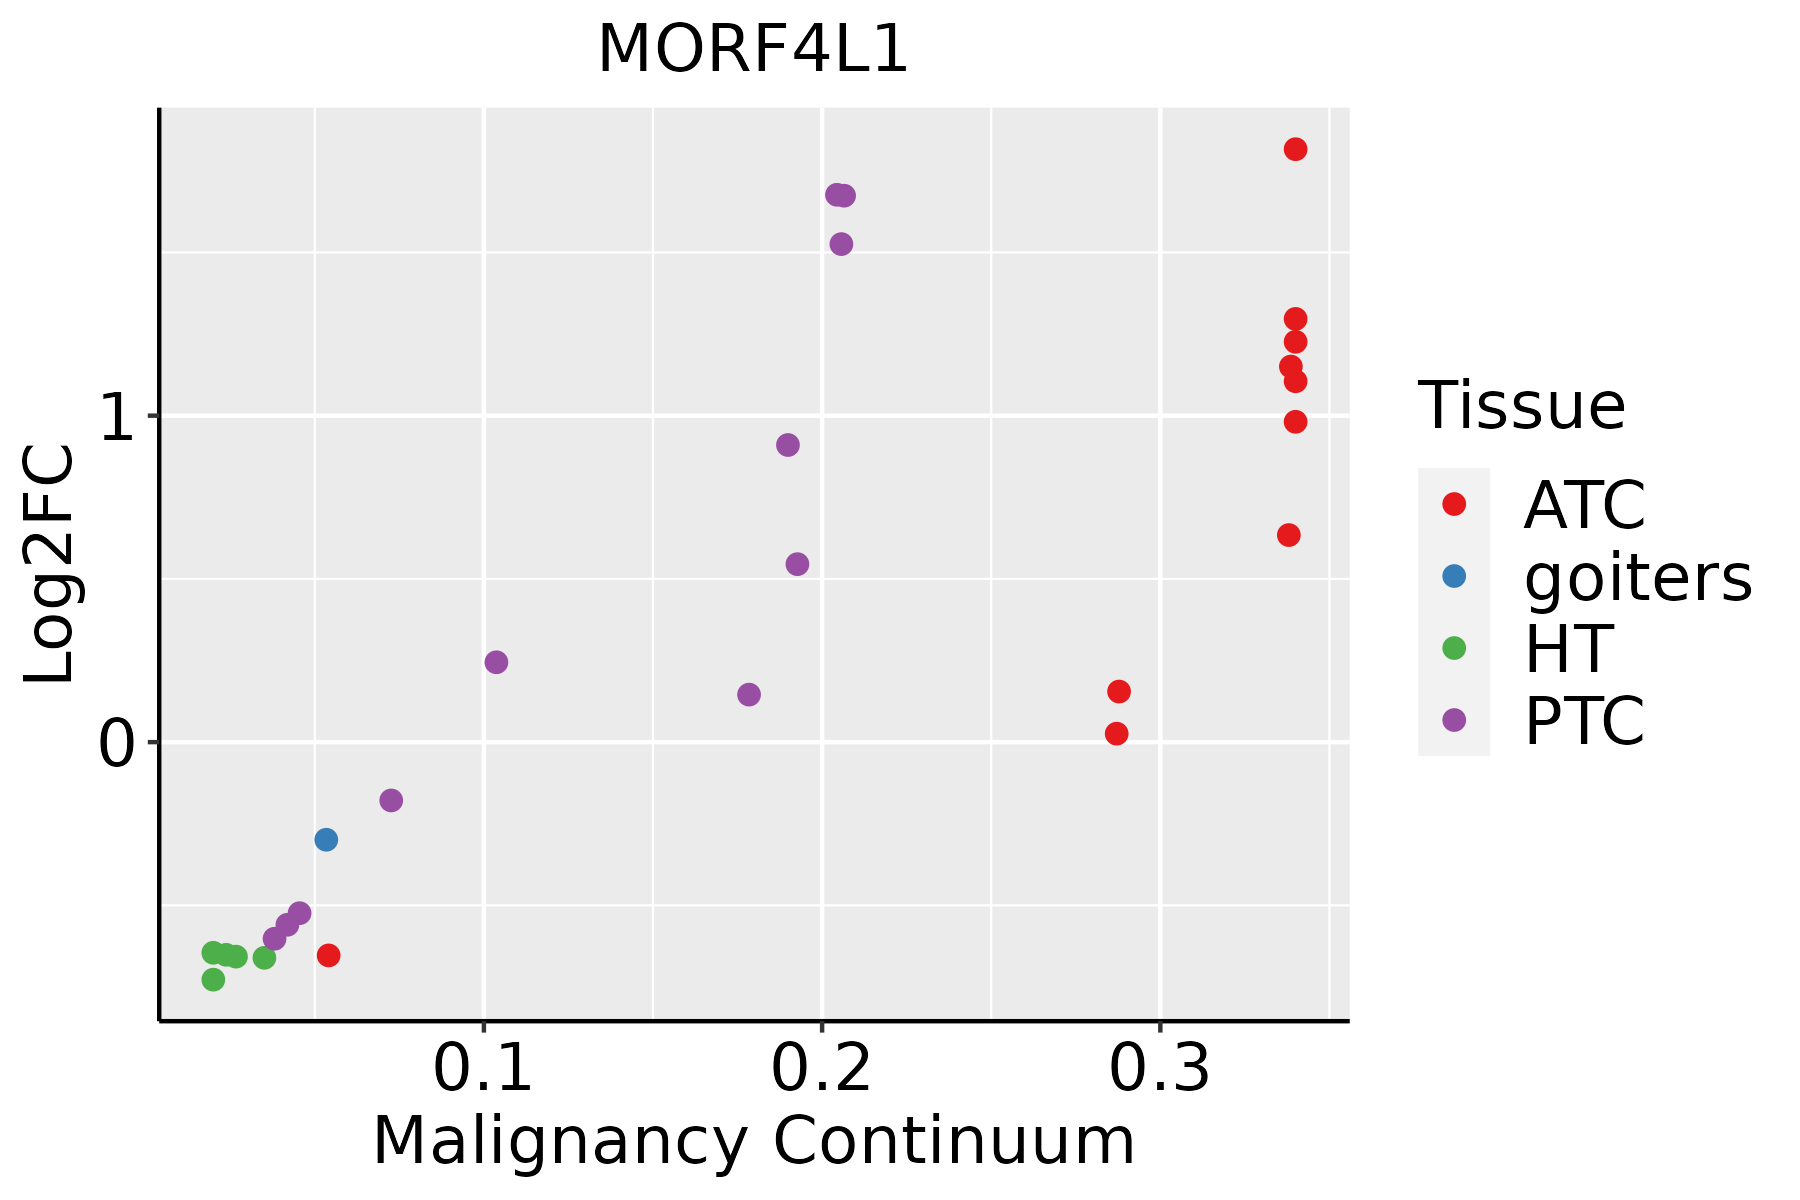 | ATC: Anaplastic thyroid cancer |
| HT: Hashimoto's thyroiditis | ||
| PTC: Papillary thyroid cancer |
| ∗log2FC in expression of this searched gene in stem-like cells from each diseased tissue sample relative to stem-like cells in normal samples in each tissue plotted against the malignancy continuum. Samples are colored based on if they are from different disease stage. |
Top |
Malignant transformation related pathway analysis |
| Find out the enriched GO biological processes and KEGG pathways involved in transition from healthy to precancer to cancer |
| Tissue | Disease Stage | Enriched GO biological Processes |
| Colorectum | AD |  |
| Colorectum | SER |  |
| Colorectum | MSS |  |
| Colorectum | MSI-H |  |
| Colorectum | FAP |  |
| ∗Top 15 enriched GO BP terms are showed in the bar plot of each disease state in each tissue. Each row represents a significant GO biological process which is colored according to the -log10(p.adjust). |
| Page: 1 2 3 4 5 6 7 8 9 |
| GO ID | Tissue | Disease Stage | Description | Gene Ratio | Bg Ratio | pvalue | p.adjust | Count |
| GO:0016570 | Colorectum | MSS | histone modification | 113/3467 | 463/18723 | 8.37e-04 | 8.68e-03 | 113 |
| GO:0006302 | Colorectum | MSS | double-strand break repair | 64/3467 | 251/18723 | 3.58e-03 | 2.65e-02 | 64 |
| GO:00165701 | Colorectum | FAP | histone modification | 94/2622 | 463/18723 | 1.06e-04 | 1.76e-03 | 94 |
| GO:001657015 | Esophagus | ESCC | histone modification | 323/8552 | 463/18723 | 2.61e-26 | 7.88e-24 | 323 |
| GO:001820514 | Esophagus | ESCC | peptidyl-lysine modification | 259/8552 | 376/18723 | 3.90e-20 | 5.26e-18 | 259 |
| GO:001839413 | Esophagus | ESCC | peptidyl-lysine acetylation | 123/8552 | 169/18723 | 6.58e-13 | 2.94e-11 | 123 |
| GO:004354313 | Esophagus | ESCC | protein acylation | 165/8552 | 243/18723 | 1.69e-12 | 7.14e-11 | 165 |
| GO:000647313 | Esophagus | ESCC | protein acetylation | 140/8552 | 201/18723 | 4.37e-12 | 1.69e-10 | 140 |
| GO:001839313 | Esophagus | ESCC | internal peptidyl-lysine acetylation | 114/8552 | 158/18723 | 1.16e-11 | 4.24e-10 | 114 |
| GO:000647513 | Esophagus | ESCC | internal protein amino acid acetylation | 115/8552 | 160/18723 | 1.43e-11 | 5.08e-10 | 115 |
| GO:00165735 | Esophagus | ESCC | histone acetylation | 110/8552 | 152/18723 | 1.95e-11 | 6.81e-10 | 110 |
| GO:004396712 | Esophagus | ESCC | histone H4 acetylation | 53/8552 | 67/18723 | 2.11e-08 | 4.03e-07 | 53 |
| GO:00356015 | Esophagus | ESCC | protein deacylation | 79/8552 | 112/18723 | 8.30e-08 | 1.42e-06 | 79 |
| GO:00987325 | Esophagus | ESCC | macromolecule deacylation | 80/8552 | 116/18723 | 3.19e-07 | 4.50e-06 | 80 |
| GO:00165754 | Esophagus | ESCC | histone deacetylation | 60/8552 | 82/18723 | 3.85e-07 | 5.32e-06 | 60 |
| GO:00064765 | Esophagus | ESCC | protein deacetylation | 70/8552 | 101/18723 | 1.29e-06 | 1.58e-05 | 70 |
| GO:00063024 | Esophagus | ESCC | double-strand break repair | 152/8552 | 251/18723 | 1.33e-06 | 1.62e-05 | 152 |
| GO:00439682 | Esophagus | ESCC | histone H2A acetylation | 15/8552 | 17/18723 | 3.48e-04 | 2.03e-03 | 15 |
| GO:00063101 | Esophagus | ESCC | DNA recombination | 168/8552 | 305/18723 | 5.58e-04 | 3.05e-03 | 168 |
| GO:00007241 | Esophagus | ESCC | double-strand break repair via homologous recombination | 79/8552 | 138/18723 | 4.05e-03 | 1.62e-02 | 79 |
| Page: 1 2 3 4 5 6 7 8 9 |
| Pathway ID | Tissue | Disease Stage | Description | Gene Ratio | Bg Ratio | pvalue | p.adjust | qvalue | Count |
| Page: 1 |
Top |
Cell-cell communication analysis |
| Identification of potential cell-cell interactions between two cell types and their ligand-receptor pairs for different disease states |
| Ligand | Receptor | LRpair | Pathway | Tissue | Disease Stage |
| Page: 1 |
Top |
Single-cell gene regulatory network inference analysis |
| Find out the significant the regulons (TFs) and the target genes of each regulon across cell types for different disease states |
| TF | Cell Type | Tissue | Disease Stage | Target Gene | RSS | Regulon Activity |
| ∗The dot plots of a searched regulon are shown for all cell subpopulations in each disease state of each tissue based on the regulon specific score inferred using pySCENIC and by calculating the average expression. |
| Page: 1 |
Top |
Somatic mutation of malignant transformation related genes |
| Annotation of somatic variants for genes involved in malignant transformation |
| Hugo Symbol | Variant Class | Variant Classification | dbSNP RS | HGVSc | HGVSp | HGVSp Short | SWISSPROT | BIOTYPE | SIFT | PolyPhen | Tumor Sample Barcode | Tissue | Histology | Sex | Age | Stage | Therapy Types | Drugs | Outcome |
| MORF4L1 | SNV | Missense_Mutation | c.550G>A | p.Glu184Lys | p.E184K | Q9UBU8 | protein_coding | deleterious(0.01) | possibly_damaging(0.869) | TCGA-AC-A23H-01 | Breast | breast invasive carcinoma | Female | >=65 | I/II | Unknown | Unknown | PD | |
| MORF4L1 | SNV | Missense_Mutation | c.413C>G | p.Ser138Cys | p.S138C | Q9UBU8 | protein_coding | deleterious(0.01) | benign(0.289) | TCGA-BH-A1F8-01 | Breast | breast invasive carcinoma | Female | >=65 | III/IV | Unknown | Unknown | PD | |
| MORF4L1 | SNV | Missense_Mutation | c.353N>G | p.Ala118Gly | p.A118G | Q9UBU8 | protein_coding | deleterious(0) | possibly_damaging(0.802) | TCGA-C8-A27B-01 | Breast | breast invasive carcinoma | Female | <65 | I/II | Chemotherapy | 5-fluorouracil | CR | |
| MORF4L1 | SNV | Missense_Mutation | c.923N>A | p.Arg308Gln | p.R308Q | Q9UBU8 | protein_coding | tolerated(0.06) | benign(0.039) | TCGA-JW-A5VL-01 | Cervix | cervical & endocervical cancer | Female | <65 | I/II | Unknown | Unknown | SD | |
| MORF4L1 | deletion | Frame_Shift_Del | novel | c.1003_1004delAA | p.Lys335ValfsTer16 | p.K335Vfs*16 | Q9UBU8 | protein_coding | TCGA-HM-A3JJ-01 | Cervix | cervical & endocervical cancer | Female | <65 | I/II | Chemotherapy | cisplatin | PD | ||
| MORF4L1 | SNV | Missense_Mutation | c.614C>T | p.Pro205Leu | p.P205L | Q9UBU8 | protein_coding | tolerated(0.1) | benign(0.221) | TCGA-AA-3821-01 | Colorectum | colon adenocarcinoma | Female | >=65 | I/II | Unknown | Unknown | SD | |
| MORF4L1 | SNV | Missense_Mutation | c.453G>T | p.Lys151Asn | p.K151N | Q9UBU8 | protein_coding | deleterious(0.03) | benign(0.04) | TCGA-AA-3977-01 | Colorectum | colon adenocarcinoma | Male | >=65 | I/II | Unknown | Unknown | SD | |
| MORF4L1 | SNV | Missense_Mutation | novel | c.643N>G | p.Thr215Ala | p.T215A | Q9UBU8 | protein_coding | deleterious(0.01) | benign(0.323) | TCGA-CA-6717-01 | Colorectum | colon adenocarcinoma | Male | <65 | I/II | Chemotherapy | oxaliplatin | CR |
| MORF4L1 | SNV | Missense_Mutation | novel | c.697N>A | p.Leu233Ile | p.L233I | Q9UBU8 | protein_coding | tolerated(0.08) | possibly_damaging(0.712) | TCGA-CA-6717-01 | Colorectum | colon adenocarcinoma | Male | <65 | I/II | Chemotherapy | oxaliplatin | CR |
| MORF4L1 | SNV | Missense_Mutation | novel | c.761N>C | p.Asn254Thr | p.N254T | Q9UBU8 | protein_coding | tolerated(0.6) | benign(0.042) | TCGA-CA-6717-01 | Colorectum | colon adenocarcinoma | Male | <65 | I/II | Chemotherapy | oxaliplatin | CR |
| Page: 1 2 3 4 |
Top |
Related drugs of malignant transformation related genes |
| Identification of chemicals and drugs interact with genes involved in malignant transfromation |
| (DGIdb 4.0) |
| Entrez ID | Symbol | Category | Interaction Types | Drug Claim Name | Drug Name | PMIDs |
| Page: 1 |

Copyright 2023-Present -The University of Texas Health Science Center at Houston |