
|
|||||
|
 | |
| |
| |
| |
| |
| |
|
Gene: MOB3C |
Gene summary for MOB3C |
| Gene information | Species | Human | Gene symbol | MOB3C | Gene ID | 148932 |
| Gene name | MOB kinase activator 3C | |
| Gene Alias | MOB1E | |
| Cytomap | 1p33 | |
| Gene Type | protein-coding | GO ID | GO:0001932 | UniProtAcc | X6R3L3 |
Top |
Malignant transformation analysis |
| Identification of the aberrant gene expression in precancerous and cancerous lesions by comparing the gene expression of stem-like cells in diseased tissues with normal stem cells |
| Entrez ID | Symbol | Replicates | Species | Organ | Tissue | Adj P-value | Log2FC | Malignancy |
| 148932 | MOB3C | P76T-E | Human | Esophagus | ESCC | 2.88e-06 | 3.20e-02 | 0.1207 |
| 148932 | MOB3C | P79T-E | Human | Esophagus | ESCC | 2.26e-03 | 5.92e-02 | 0.1154 |
| 148932 | MOB3C | P80T-E | Human | Esophagus | ESCC | 4.15e-11 | 3.98e-01 | 0.155 |
| 148932 | MOB3C | P82T-E | Human | Esophagus | ESCC | 2.14e-04 | 1.51e-01 | 0.1072 |
| 148932 | MOB3C | P83T-E | Human | Esophagus | ESCC | 5.51e-07 | 1.59e-01 | 0.1738 |
| 148932 | MOB3C | P84T-E | Human | Esophagus | ESCC | 2.28e-02 | 2.15e-01 | 0.0933 |
| 148932 | MOB3C | P89T-E | Human | Esophagus | ESCC | 6.85e-05 | 2.94e-01 | 0.1752 |
| 148932 | MOB3C | P91T-E | Human | Esophagus | ESCC | 9.01e-04 | 5.44e-01 | 0.1828 |
| 148932 | MOB3C | P107T-E | Human | Esophagus | ESCC | 5.40e-15 | 3.50e-01 | 0.171 |
| 148932 | MOB3C | P126T-E | Human | Esophagus | ESCC | 4.50e-02 | 1.69e-01 | 0.1125 |
| 148932 | MOB3C | P127T-E | Human | Esophagus | ESCC | 7.61e-08 | 9.40e-02 | 0.0826 |
| 148932 | MOB3C | P128T-E | Human | Esophagus | ESCC | 1.78e-05 | 2.78e-01 | 0.1241 |
| 148932 | MOB3C | P130T-E | Human | Esophagus | ESCC | 7.17e-17 | 2.20e-01 | 0.1676 |
| Page: 1 2 3 |
| Tissue | Expression Dynamics | Abbreviation |
| Esophagus | 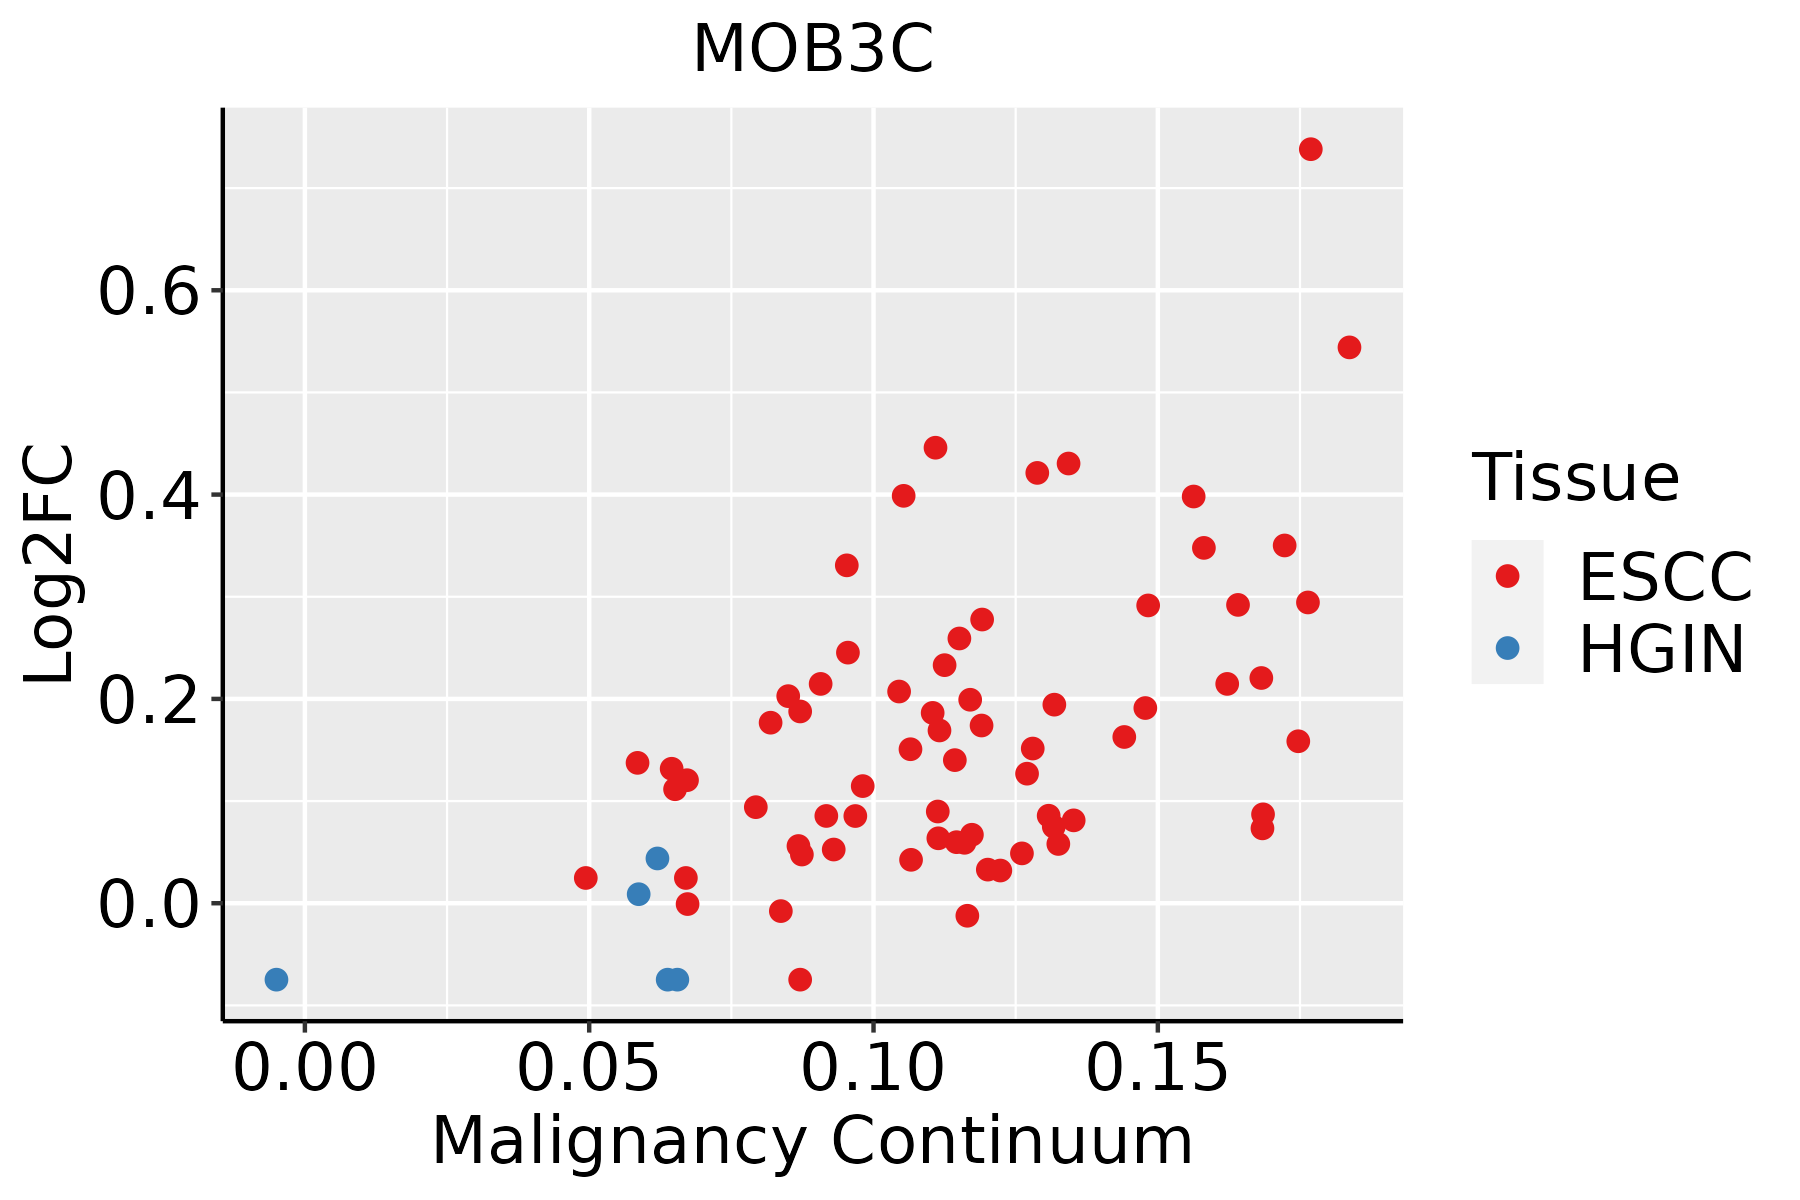 | ESCC: Esophageal squamous cell carcinoma |
| HGIN: High-grade intraepithelial neoplasias | ||
| LGIN: Low-grade intraepithelial neoplasias |
| ∗log2FC in expression of this searched gene in stem-like cells from each diseased tissue sample relative to stem-like cells in normal samples in each tissue plotted against the malignancy continuum. Samples are colored based on if they are from different disease stage. |
Top |
Malignant transformation related pathway analysis |
| Find out the enriched GO biological processes and KEGG pathways involved in transition from healthy to precancer to cancer |
| Tissue | Disease Stage | Enriched GO biological Processes |
| Colorectum | AD |  |
| Colorectum | SER |  |
| Colorectum | MSS |  |
| Colorectum | MSI-H |  |
| Colorectum | FAP |  |
| ∗Top 15 enriched GO BP terms are showed in the bar plot of each disease state in each tissue. Each row represents a significant GO biological process which is colored according to the -log10(p.adjust). |
| Page: 1 2 3 4 5 6 7 8 9 |
| GO ID | Tissue | Disease Stage | Description | Gene Ratio | Bg Ratio | pvalue | p.adjust | Count |
| Page: 1 |
| Pathway ID | Tissue | Disease Stage | Description | Gene Ratio | Bg Ratio | pvalue | p.adjust | qvalue | Count |
| Page: 1 |
Top |
Cell-cell communication analysis |
| Identification of potential cell-cell interactions between two cell types and their ligand-receptor pairs for different disease states |
| Ligand | Receptor | LRpair | Pathway | Tissue | Disease Stage |
| Page: 1 |
Top |
Single-cell gene regulatory network inference analysis |
| Find out the significant the regulons (TFs) and the target genes of each regulon across cell types for different disease states |
| TF | Cell Type | Tissue | Disease Stage | Target Gene | RSS | Regulon Activity |
| ∗The dot plots of a searched regulon are shown for all cell subpopulations in each disease state of each tissue based on the regulon specific score inferred using pySCENIC and by calculating the average expression. |
| Page: 1 |
Top |
Somatic mutation of malignant transformation related genes |
| Annotation of somatic variants for genes involved in malignant transformation |
| Hugo Symbol | Variant Class | Variant Classification | dbSNP RS | HGVSc | HGVSp | HGVSp Short | SWISSPROT | BIOTYPE | SIFT | PolyPhen | Tumor Sample Barcode | Tissue | Histology | Sex | Age | Stage | Therapy Types | Drugs | Outcome |
| MOB3C | SNV | Missense_Mutation | c.466N>T | p.Arg156Cys | p.R156C | protein_coding | deleterious(0.05) | possibly_damaging(0.707) | TCGA-A7-A4SD-01 | Breast | breast invasive carcinoma | Female | <65 | I/II | Chemotherapy | taxotere | CR | ||
| MOB3C | SNV | Missense_Mutation | novel | c.602A>T | p.Gln201Leu | p.Q201L | protein_coding | tolerated(0.09) | possibly_damaging(0.596) | TCGA-AN-A0AJ-01 | Breast | breast invasive carcinoma | Female | >=65 | I/II | Unknown | Unknown | SD | |
| MOB3C | insertion | Frame_Shift_Ins | novel | c.603_604insCTCTTCT | p.Val202LeufsTer25 | p.V202Lfs*25 | protein_coding | TCGA-AN-A0AJ-01 | Breast | breast invasive carcinoma | Female | >=65 | I/II | Unknown | Unknown | SD | |||
| MOB3C | SNV | Missense_Mutation | c.394N>A | p.Glu132Lys | p.E132K | protein_coding | deleterious(0) | possibly_damaging(0.727) | TCGA-IR-A3LH-01 | Cervix | cervical & endocervical cancer | Female | <65 | I/II | Chemotherapy | cisplatin | CR | ||
| MOB3C | SNV | Missense_Mutation | c.394N>C | p.Glu132Gln | p.E132Q | protein_coding | deleterious(0.03) | possibly_damaging(0.846) | TCGA-JW-A5VJ-01 | Cervix | cervical & endocervical cancer | Female | <65 | I/II | Unknown | Unknown | PD | ||
| MOB3C | SNV | Missense_Mutation | c.65N>A | p.Arg22Lys | p.R22K | protein_coding | deleterious_low_confidence(0) | benign(0.025) | TCGA-LP-A7HU-01 | Cervix | cervical & endocervical cancer | Female | <65 | I/II | Unknown | Unknown | SD | ||
| MOB3C | SNV | Missense_Mutation | novel | c.615G>T | p.Lys205Asn | p.K205N | protein_coding | tolerated(0.22) | probably_damaging(0.948) | TCGA-VS-A958-01 | Cervix | cervical & endocervical cancer | Female | <65 | I/II | Chemotherapy | cisplatin | CR | |
| MOB3C | SNV | Missense_Mutation | c.398G>A | p.Arg133His | p.R133H | protein_coding | tolerated(0.1) | benign(0) | TCGA-A6-2686-01 | Colorectum | colon adenocarcinoma | Female | >=65 | I/II | Unknown | Unknown | SD | ||
| MOB3C | SNV | Missense_Mutation | c.398N>A | p.Arg133His | p.R133H | protein_coding | tolerated(0.1) | benign(0) | TCGA-AA-3663-01 | Colorectum | colon adenocarcinoma | Male | <65 | I/II | Unknown | Unknown | SD | ||
| MOB3C | SNV | Missense_Mutation | c.289C>T | p.Arg97Cys | p.R97C | protein_coding | deleterious(0) | probably_damaging(0.942) | TCGA-AA-3710-01 | Colorectum | colon adenocarcinoma | Female | >=65 | I/II | Unknown | Unknown | SD |
| Page: 1 2 3 4 |
Top |
Related drugs of malignant transformation related genes |
| Identification of chemicals and drugs interact with genes involved in malignant transfromation |
| (DGIdb 4.0) |
| Entrez ID | Symbol | Category | Interaction Types | Drug Claim Name | Drug Name | PMIDs |
| Page: 1 |

Copyright 2023-Present -The University of Texas Health Science Center at Houston |