
|
|||||
|
 | |
| |
| |
| |
| |
| |
|
Gene: MED31 |
Gene summary for MED31 |
| Gene information | Species | Human | Gene symbol | MED31 | Gene ID | 51003 |
| Gene name | mediator complex subunit 31 | |
| Gene Alias | 3110004H13Rik | |
| Cytomap | 17p13.1 | |
| Gene Type | protein-coding | GO ID | GO:0006139 | UniProtAcc | Q9Y3C7 |
Top |
Malignant transformation analysis |
| Identification of the aberrant gene expression in precancerous and cancerous lesions by comparing the gene expression of stem-like cells in diseased tissues with normal stem cells |
| Entrez ID | Symbol | Replicates | Species | Organ | Tissue | Adj P-value | Log2FC | Malignancy |
| 51003 | MED31 | P49T-E | Human | Esophagus | ESCC | 1.93e-07 | 8.89e-01 | 0.1768 |
| 51003 | MED31 | P52T-E | Human | Esophagus | ESCC | 5.29e-21 | 4.15e-01 | 0.1555 |
| 51003 | MED31 | P54T-E | Human | Esophagus | ESCC | 1.36e-15 | 4.04e-01 | 0.0975 |
| 51003 | MED31 | P56T-E | Human | Esophagus | ESCC | 1.84e-07 | 7.49e-01 | 0.1613 |
| 51003 | MED31 | P57T-E | Human | Esophagus | ESCC | 6.06e-11 | 1.70e-01 | 0.0926 |
| 51003 | MED31 | P61T-E | Human | Esophagus | ESCC | 8.21e-18 | 2.01e-01 | 0.099 |
| 51003 | MED31 | P62T-E | Human | Esophagus | ESCC | 2.57e-34 | 6.51e-01 | 0.1302 |
| 51003 | MED31 | P65T-E | Human | Esophagus | ESCC | 3.04e-13 | 2.66e-01 | 0.0978 |
| 51003 | MED31 | P74T-E | Human | Esophagus | ESCC | 1.54e-35 | 1.06e+00 | 0.1479 |
| 51003 | MED31 | P75T-E | Human | Esophagus | ESCC | 2.04e-26 | 6.25e-01 | 0.1125 |
| 51003 | MED31 | P76T-E | Human | Esophagus | ESCC | 1.93e-11 | 2.99e-01 | 0.1207 |
| 51003 | MED31 | P79T-E | Human | Esophagus | ESCC | 5.83e-17 | 3.78e-01 | 0.1154 |
| 51003 | MED31 | P80T-E | Human | Esophagus | ESCC | 7.48e-10 | 2.88e-01 | 0.155 |
| 51003 | MED31 | P82T-E | Human | Esophagus | ESCC | 1.27e-12 | 5.81e-01 | 0.1072 |
| 51003 | MED31 | P83T-E | Human | Esophagus | ESCC | 6.17e-20 | 6.10e-01 | 0.1738 |
| 51003 | MED31 | P84T-E | Human | Esophagus | ESCC | 1.32e-03 | 4.38e-01 | 0.0933 |
| 51003 | MED31 | P89T-E | Human | Esophagus | ESCC | 1.35e-08 | 5.52e-01 | 0.1752 |
| 51003 | MED31 | P91T-E | Human | Esophagus | ESCC | 8.08e-13 | 1.25e+00 | 0.1828 |
| 51003 | MED31 | P107T-E | Human | Esophagus | ESCC | 1.28e-35 | 8.03e-01 | 0.171 |
| 51003 | MED31 | P126T-E | Human | Esophagus | ESCC | 1.55e-02 | 4.22e-01 | 0.1125 |
| Page: 1 2 3 4 5 |
| Tissue | Expression Dynamics | Abbreviation |
| Esophagus | 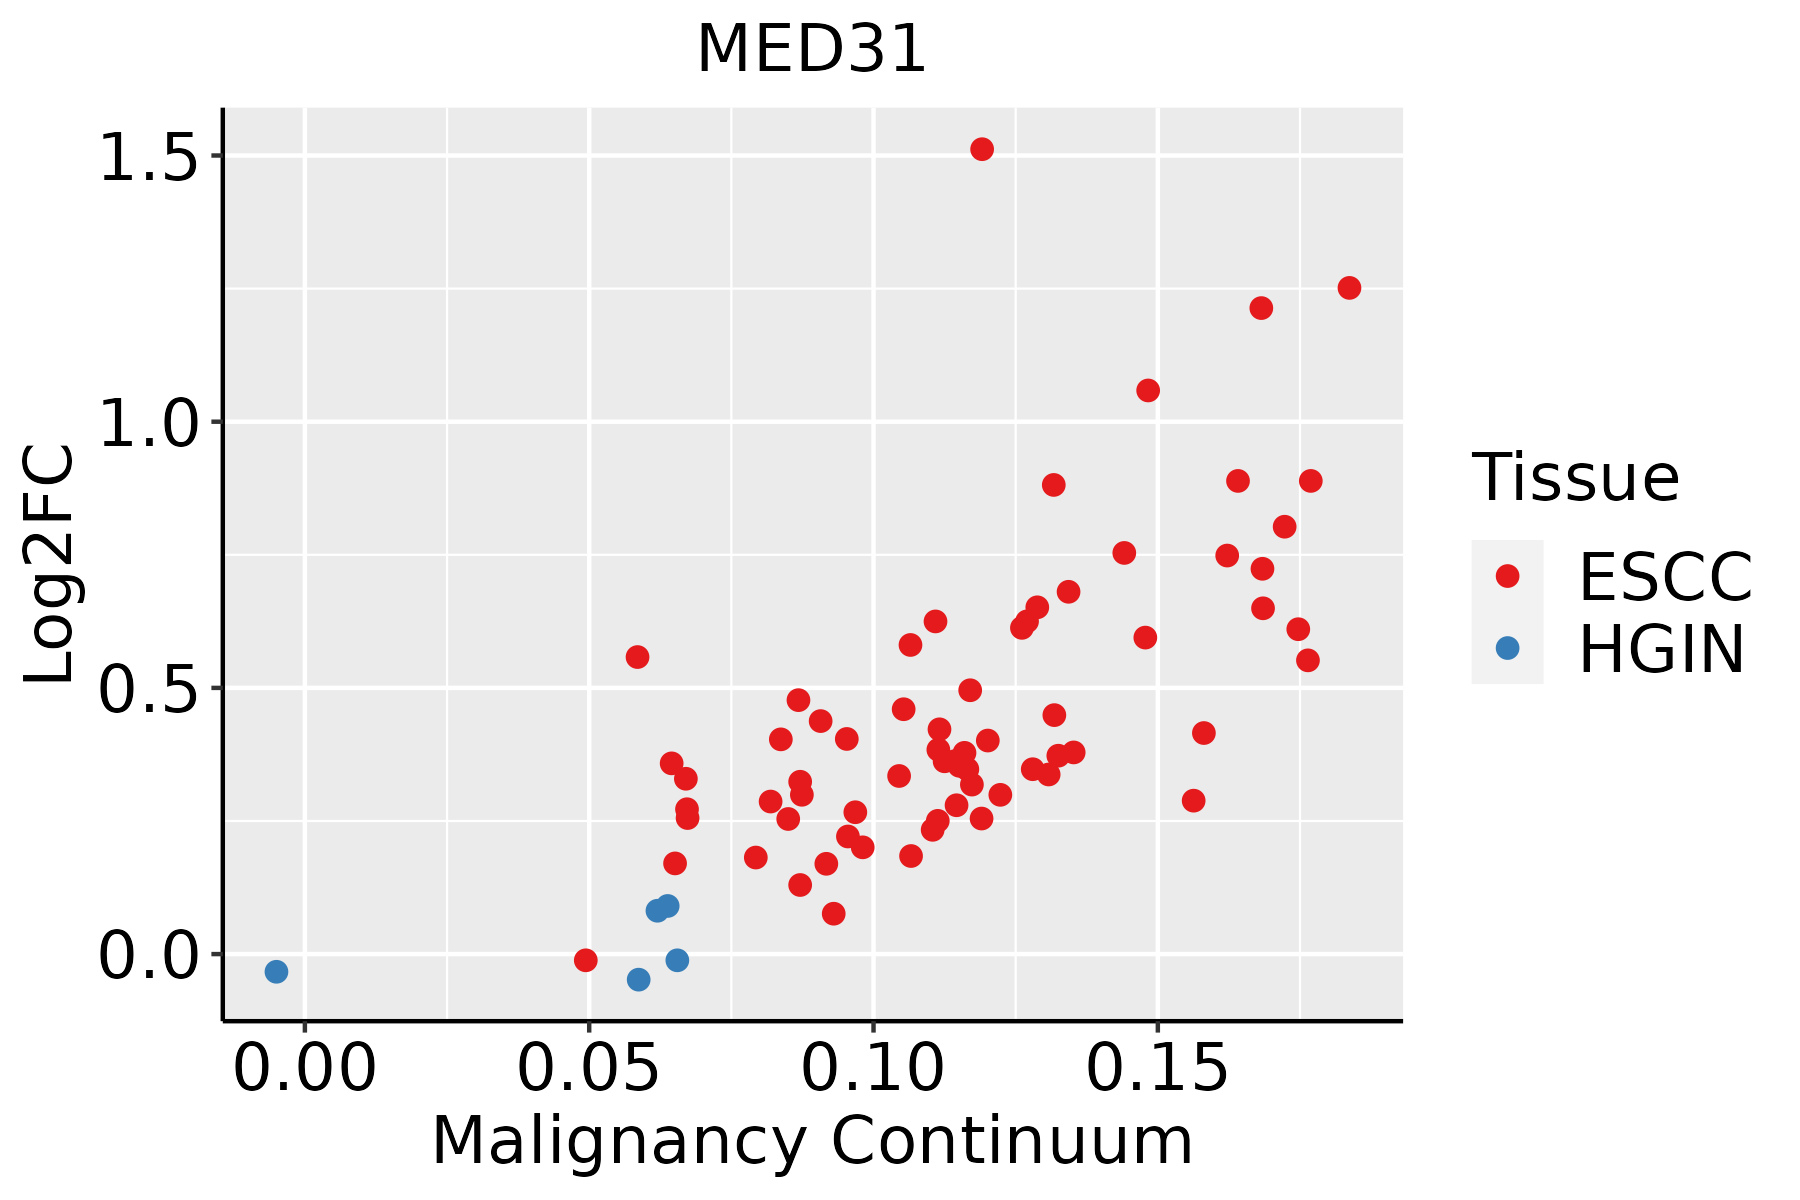 | ESCC: Esophageal squamous cell carcinoma |
| HGIN: High-grade intraepithelial neoplasias | ||
| LGIN: Low-grade intraepithelial neoplasias | ||
| Oral Cavity | 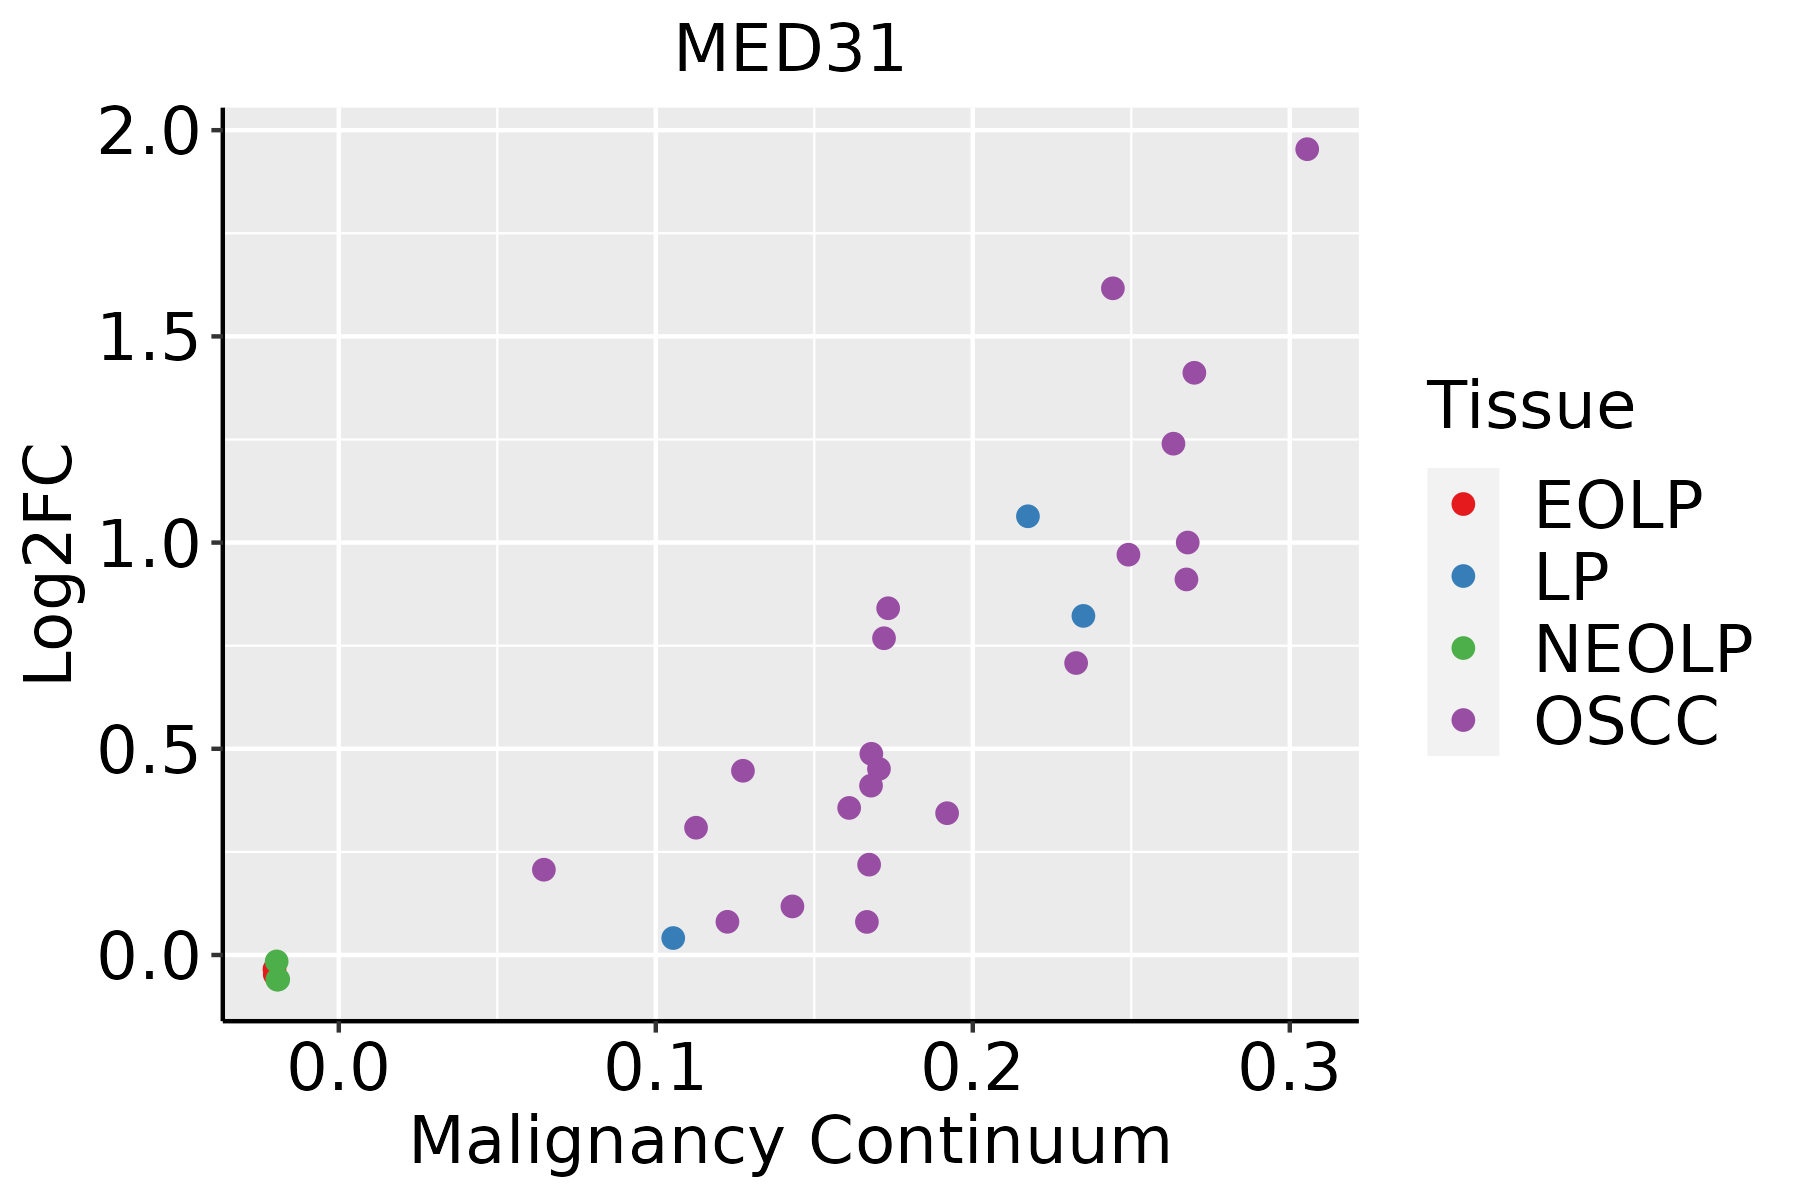 | EOLP: Erosive Oral lichen planus |
| LP: leukoplakia | ||
| NEOLP: Non-erosive oral lichen planus | ||
| OSCC: Oral squamous cell carcinoma | ||
| Skin |  | AK: Actinic keratosis |
| cSCC: Cutaneous squamous cell carcinoma | ||
| SCCIS:squamous cell carcinoma in situ |
| ∗log2FC in expression of this searched gene in stem-like cells from each diseased tissue sample relative to stem-like cells in normal samples in each tissue plotted against the malignancy continuum. Samples are colored based on if they are from different disease stage. |
Top |
Malignant transformation related pathway analysis |
| Find out the enriched GO biological processes and KEGG pathways involved in transition from healthy to precancer to cancer |
| Tissue | Disease Stage | Enriched GO biological Processes |
| Colorectum | AD |  |
| Colorectum | SER |  |
| Colorectum | MSS |  |
| Colorectum | MSI-H |  |
| Colorectum | FAP |  |
| ∗Top 15 enriched GO BP terms are showed in the bar plot of each disease state in each tissue. Each row represents a significant GO biological process which is colored according to the -log10(p.adjust). |
| Page: 1 2 3 4 5 6 7 8 9 |
| GO ID | Tissue | Disease Stage | Description | Gene Ratio | Bg Ratio | pvalue | p.adjust | Count |
| GO:004814414 | Esophagus | ESCC | fibroblast proliferation | 57/8552 | 81/18723 | 5.83e-06 | 6.03e-05 | 57 |
| GO:004814514 | Esophagus | ESCC | regulation of fibroblast proliferation | 56/8552 | 80/18723 | 9.08e-06 | 8.71e-05 | 56 |
| GO:00487367 | Esophagus | ESCC | appendage development | 98/8552 | 172/18723 | 1.83e-03 | 8.37e-03 | 98 |
| GO:00601737 | Esophagus | ESCC | limb development | 98/8552 | 172/18723 | 1.83e-03 | 8.37e-03 | 98 |
| GO:00481471 | Esophagus | ESCC | negative regulation of fibroblast proliferation | 22/8552 | 30/18723 | 1.98e-03 | 8.90e-03 | 22 |
| GO:00481446 | Oral cavity | OSCC | fibroblast proliferation | 49/7305 | 81/18723 | 7.27e-05 | 5.72e-04 | 49 |
| GO:00481457 | Oral cavity | OSCC | regulation of fibroblast proliferation | 48/7305 | 80/18723 | 1.14e-04 | 8.35e-04 | 48 |
| GO:004814413 | Oral cavity | LP | fibroblast proliferation | 32/4623 | 81/18723 | 2.24e-03 | 1.62e-02 | 32 |
| GO:004814513 | Oral cavity | LP | regulation of fibroblast proliferation | 31/4623 | 80/18723 | 3.69e-03 | 2.44e-02 | 31 |
| GO:004814422 | Skin | cSCC | fibroblast proliferation | 38/4864 | 81/18723 | 3.88e-05 | 4.17e-04 | 38 |
| GO:004814522 | Skin | cSCC | regulation of fibroblast proliferation | 37/4864 | 80/18723 | 7.15e-05 | 6.87e-04 | 37 |
| GO:004814721 | Skin | cSCC | negative regulation of fibroblast proliferation | 15/4864 | 30/18723 | 4.07e-03 | 2.16e-02 | 15 |
| Page: 1 |
| Pathway ID | Tissue | Disease Stage | Description | Gene Ratio | Bg Ratio | pvalue | p.adjust | qvalue | Count |
| Page: 1 |
Top |
Cell-cell communication analysis |
| Identification of potential cell-cell interactions between two cell types and their ligand-receptor pairs for different disease states |
| Ligand | Receptor | LRpair | Pathway | Tissue | Disease Stage |
| Page: 1 |
Top |
Single-cell gene regulatory network inference analysis |
| Find out the significant the regulons (TFs) and the target genes of each regulon across cell types for different disease states |
| TF | Cell Type | Tissue | Disease Stage | Target Gene | RSS | Regulon Activity |
| ∗The dot plots of a searched regulon are shown for all cell subpopulations in each disease state of each tissue based on the regulon specific score inferred using pySCENIC and by calculating the average expression. |
| Page: 1 |
Top |
Somatic mutation of malignant transformation related genes |
| Annotation of somatic variants for genes involved in malignant transformation |
| Hugo Symbol | Variant Class | Variant Classification | dbSNP RS | HGVSc | HGVSp | HGVSp Short | SWISSPROT | BIOTYPE | SIFT | PolyPhen | Tumor Sample Barcode | Tissue | Histology | Sex | Age | Stage | Therapy Types | Drugs | Outcome |
| MED31 | SNV | Missense_Mutation | c.355T>A | p.Leu119Met | p.L119M | Q9Y3C7 | protein_coding | tolerated(0.29) | probably_damaging(0.969) | TCGA-AA-3867-01 | Colorectum | colon adenocarcinoma | Male | >=65 | III/IV | Unknown | Unknown | PD | |
| MED31 | SNV | Missense_Mutation | c.143N>C | p.Phe48Ser | p.F48S | Q9Y3C7 | protein_coding | deleterious(0) | probably_damaging(0.997) | TCGA-CA-6717-01 | Colorectum | colon adenocarcinoma | Male | <65 | I/II | Chemotherapy | oxaliplatin | CR | |
| MED31 | SNV | Missense_Mutation | rs778765933 | c.133N>T | p.Asp45Tyr | p.D45Y | Q9Y3C7 | protein_coding | deleterious(0) | probably_damaging(0.914) | TCGA-F5-6814-01 | Colorectum | rectum adenocarcinoma | Male | <65 | I/II | Unknown | Unknown | SD |
| MED31 | SNV | Missense_Mutation | novel | c.281N>T | p.Ala94Val | p.A94V | Q9Y3C7 | protein_coding | tolerated(0.13) | benign(0.184) | TCGA-A5-A0G1-01 | Endometrium | uterine corpus endometrioid carcinoma | Female | >=65 | I/II | Unknown | Unknown | SD |
| MED31 | SNV | Missense_Mutation | novel | c.335N>A | p.Arg112Gln | p.R112Q | Q9Y3C7 | protein_coding | deleterious(0) | probably_damaging(0.991) | TCGA-A5-A0G2-01 | Endometrium | uterine corpus endometrioid carcinoma | Female | <65 | III/IV | Unknown | Unknown | SD |
| MED31 | SNV | Missense_Mutation | novel | c.281N>T | p.Ala94Val | p.A94V | Q9Y3C7 | protein_coding | tolerated(0.13) | benign(0.184) | TCGA-A5-A0GG-01 | Endometrium | uterine corpus endometrioid carcinoma | Female | >=65 | I/II | Unknown | Unknown | SD |
| MED31 | SNV | Missense_Mutation | novel | c.157A>G | p.Lys53Glu | p.K53E | Q9Y3C7 | protein_coding | deleterious(0.03) | benign(0.271) | TCGA-B5-A3FA-01 | Endometrium | uterine corpus endometrioid carcinoma | Female | >=65 | I/II | Unknown | Unknown | SD |
| MED31 | SNV | Missense_Mutation | novel | c.341G>A | p.Arg114His | p.R114H | Q9Y3C7 | protein_coding | deleterious(0) | probably_damaging(0.94) | TCGA-EY-A1G8-01 | Endometrium | uterine corpus endometrioid carcinoma | Female | >=65 | I/II | Unknown | Unknown | SD |
| MED31 | SNV | Missense_Mutation | novel | c.254N>A | p.Arg85Gln | p.R85Q | Q9Y3C7 | protein_coding | deleterious(0) | probably_damaging(0.936) | TCGA-EY-A1GI-01 | Endometrium | uterine corpus endometrioid carcinoma | Female | <65 | I/II | Unknown | Unknown | SD |
| MED31 | SNV | Missense_Mutation | novel | c.10N>A | p.Ala4Thr | p.A4T | Q9Y3C7 | protein_coding | tolerated(0.4) | benign(0.018) | TCGA-85-A4JB-01 | Lung | lung squamous cell carcinoma | Male | >=65 | I/II | Chemotherapy | unknown | CR |
| Page: 1 2 |
Top |
Related drugs of malignant transformation related genes |
| Identification of chemicals and drugs interact with genes involved in malignant transfromation |
| (DGIdb 4.0) |
| Entrez ID | Symbol | Category | Interaction Types | Drug Claim Name | Drug Name | PMIDs |
| Page: 1 |

Copyright 2023-Present -The University of Texas Health Science Center at Houston |