
|
|||||
|
 | |
| |
| |
| |
| |
| |
|
Gene: MED27 |
Gene summary for MED27 |
| Gene information | Species | Human | Gene symbol | MED27 | Gene ID | 9442 |
| Gene name | mediator complex subunit 27 | |
| Gene Alias | CRAP34 | |
| Cytomap | 9q34.13 | |
| Gene Type | protein-coding | GO ID | GO:0006139 | UniProtAcc | Q6P2C8 |
Top |
Malignant transformation analysis |
| Identification of the aberrant gene expression in precancerous and cancerous lesions by comparing the gene expression of stem-like cells in diseased tissues with normal stem cells |
| Entrez ID | Symbol | Replicates | Species | Organ | Tissue | Adj P-value | Log2FC | Malignancy |
| 9442 | MED27 | P44T-E | Human | Esophagus | ESCC | 7.40e-10 | 2.60e-01 | 0.1096 |
| 9442 | MED27 | P47T-E | Human | Esophagus | ESCC | 3.43e-16 | 2.94e-01 | 0.1067 |
| 9442 | MED27 | P48T-E | Human | Esophagus | ESCC | 9.20e-13 | 2.59e-01 | 0.0959 |
| 9442 | MED27 | P49T-E | Human | Esophagus | ESCC | 1.27e-12 | 7.00e-01 | 0.1768 |
| 9442 | MED27 | P52T-E | Human | Esophagus | ESCC | 1.37e-28 | 6.58e-01 | 0.1555 |
| 9442 | MED27 | P54T-E | Human | Esophagus | ESCC | 4.51e-19 | 2.91e-01 | 0.0975 |
| 9442 | MED27 | P56T-E | Human | Esophagus | ESCC | 3.51e-04 | 5.23e-01 | 0.1613 |
| 9442 | MED27 | P57T-E | Human | Esophagus | ESCC | 1.85e-09 | 2.30e-01 | 0.0926 |
| 9442 | MED27 | P61T-E | Human | Esophagus | ESCC | 1.87e-09 | 2.78e-01 | 0.099 |
| 9442 | MED27 | P62T-E | Human | Esophagus | ESCC | 4.57e-41 | 6.31e-01 | 0.1302 |
| 9442 | MED27 | P65T-E | Human | Esophagus | ESCC | 1.81e-11 | 2.73e-01 | 0.0978 |
| 9442 | MED27 | P74T-E | Human | Esophagus | ESCC | 4.13e-36 | 1.00e+00 | 0.1479 |
| 9442 | MED27 | P75T-E | Human | Esophagus | ESCC | 9.69e-43 | 7.54e-01 | 0.1125 |
| 9442 | MED27 | P76T-E | Human | Esophagus | ESCC | 1.36e-28 | 5.48e-01 | 0.1207 |
| 9442 | MED27 | P79T-E | Human | Esophagus | ESCC | 3.97e-26 | 5.07e-01 | 0.1154 |
| 9442 | MED27 | P80T-E | Human | Esophagus | ESCC | 3.50e-30 | 8.86e-01 | 0.155 |
| 9442 | MED27 | P82T-E | Human | Esophagus | ESCC | 1.66e-10 | 5.48e-01 | 0.1072 |
| 9442 | MED27 | P83T-E | Human | Esophagus | ESCC | 5.59e-35 | 8.41e-01 | 0.1738 |
| 9442 | MED27 | P84T-E | Human | Esophagus | ESCC | 1.36e-11 | 3.30e-01 | 0.0933 |
| 9442 | MED27 | P89T-E | Human | Esophagus | ESCC | 3.62e-15 | 8.94e-01 | 0.1752 |
| Page: 1 2 3 4 5 |
| Tissue | Expression Dynamics | Abbreviation |
| Cervix | 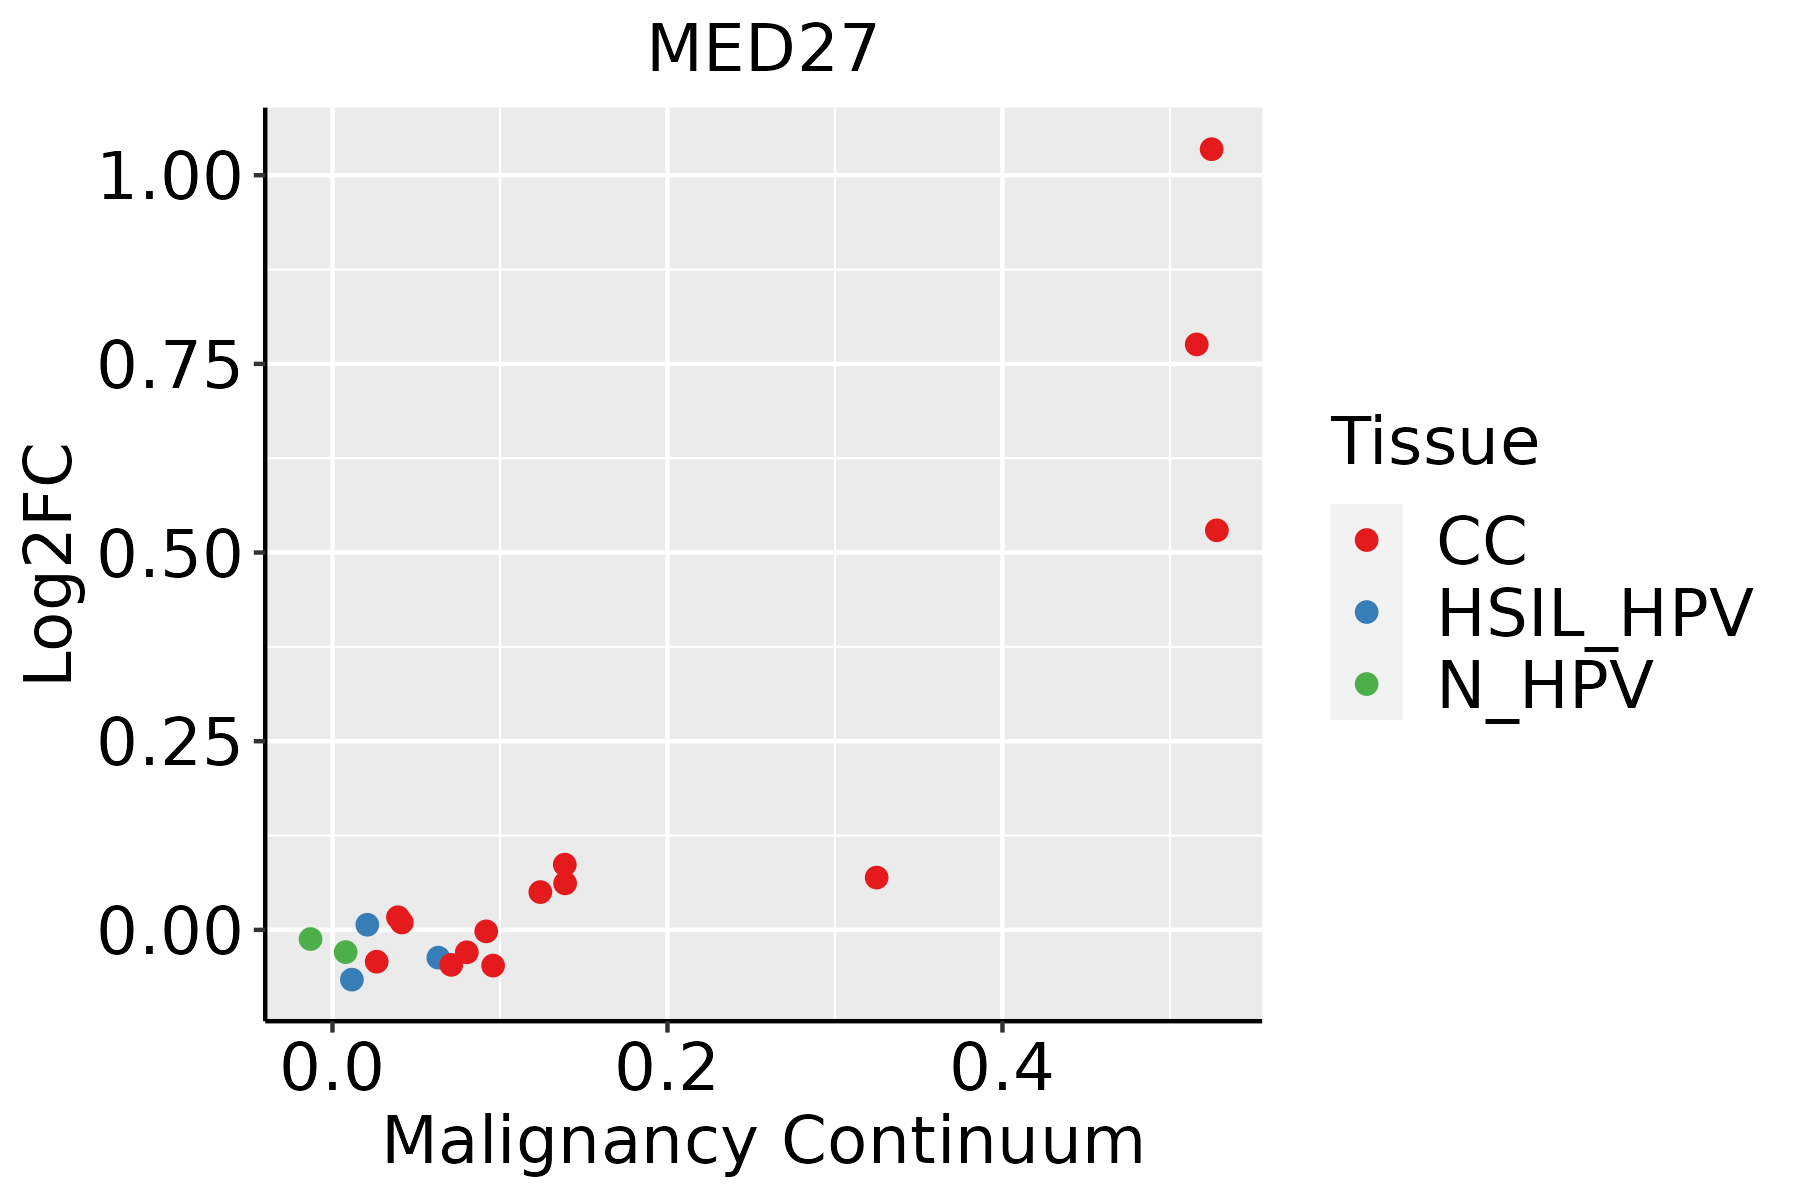 | CC: Cervix cancer |
| HSIL_HPV: HPV-infected high-grade squamous intraepithelial lesions | ||
| N_HPV: HPV-infected normal cervix | ||
| Esophagus | 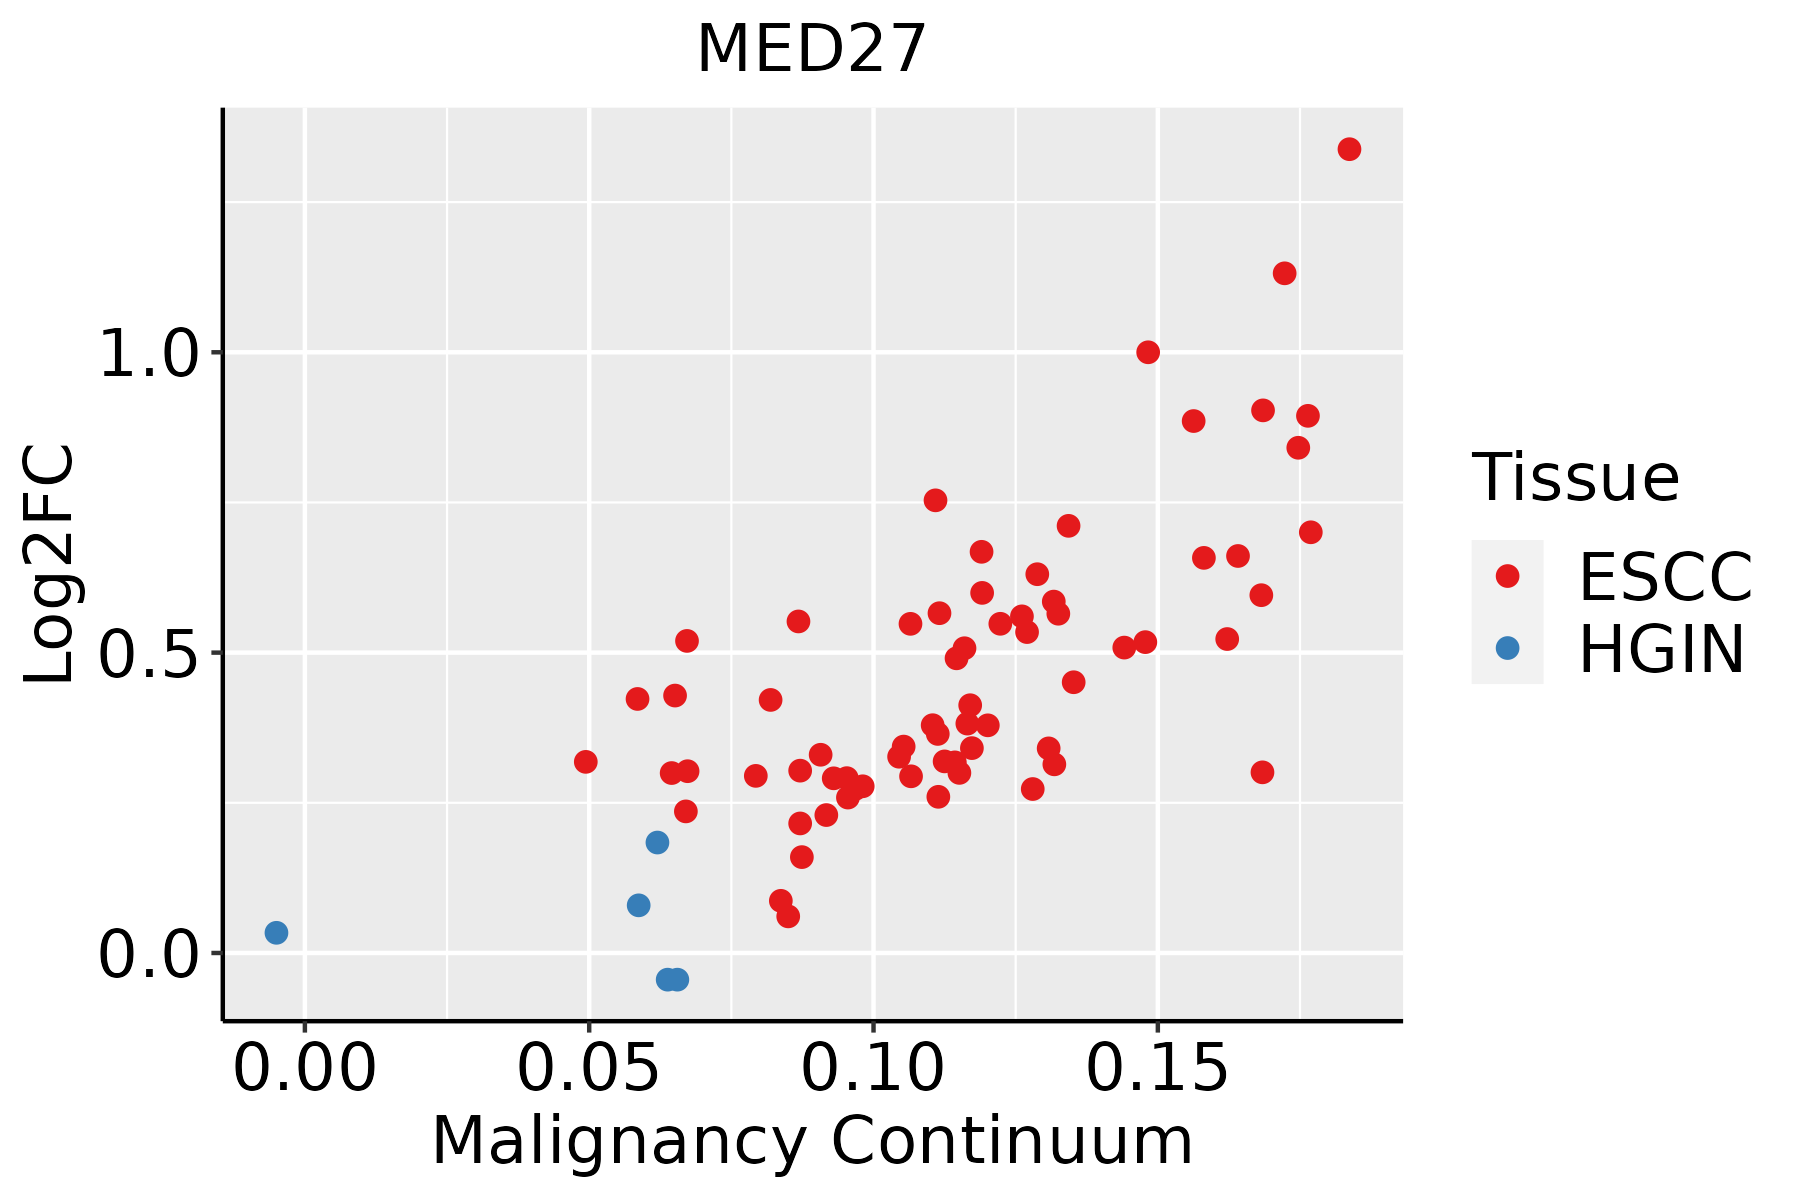 | ESCC: Esophageal squamous cell carcinoma |
| HGIN: High-grade intraepithelial neoplasias | ||
| LGIN: Low-grade intraepithelial neoplasias | ||
| Oral Cavity | 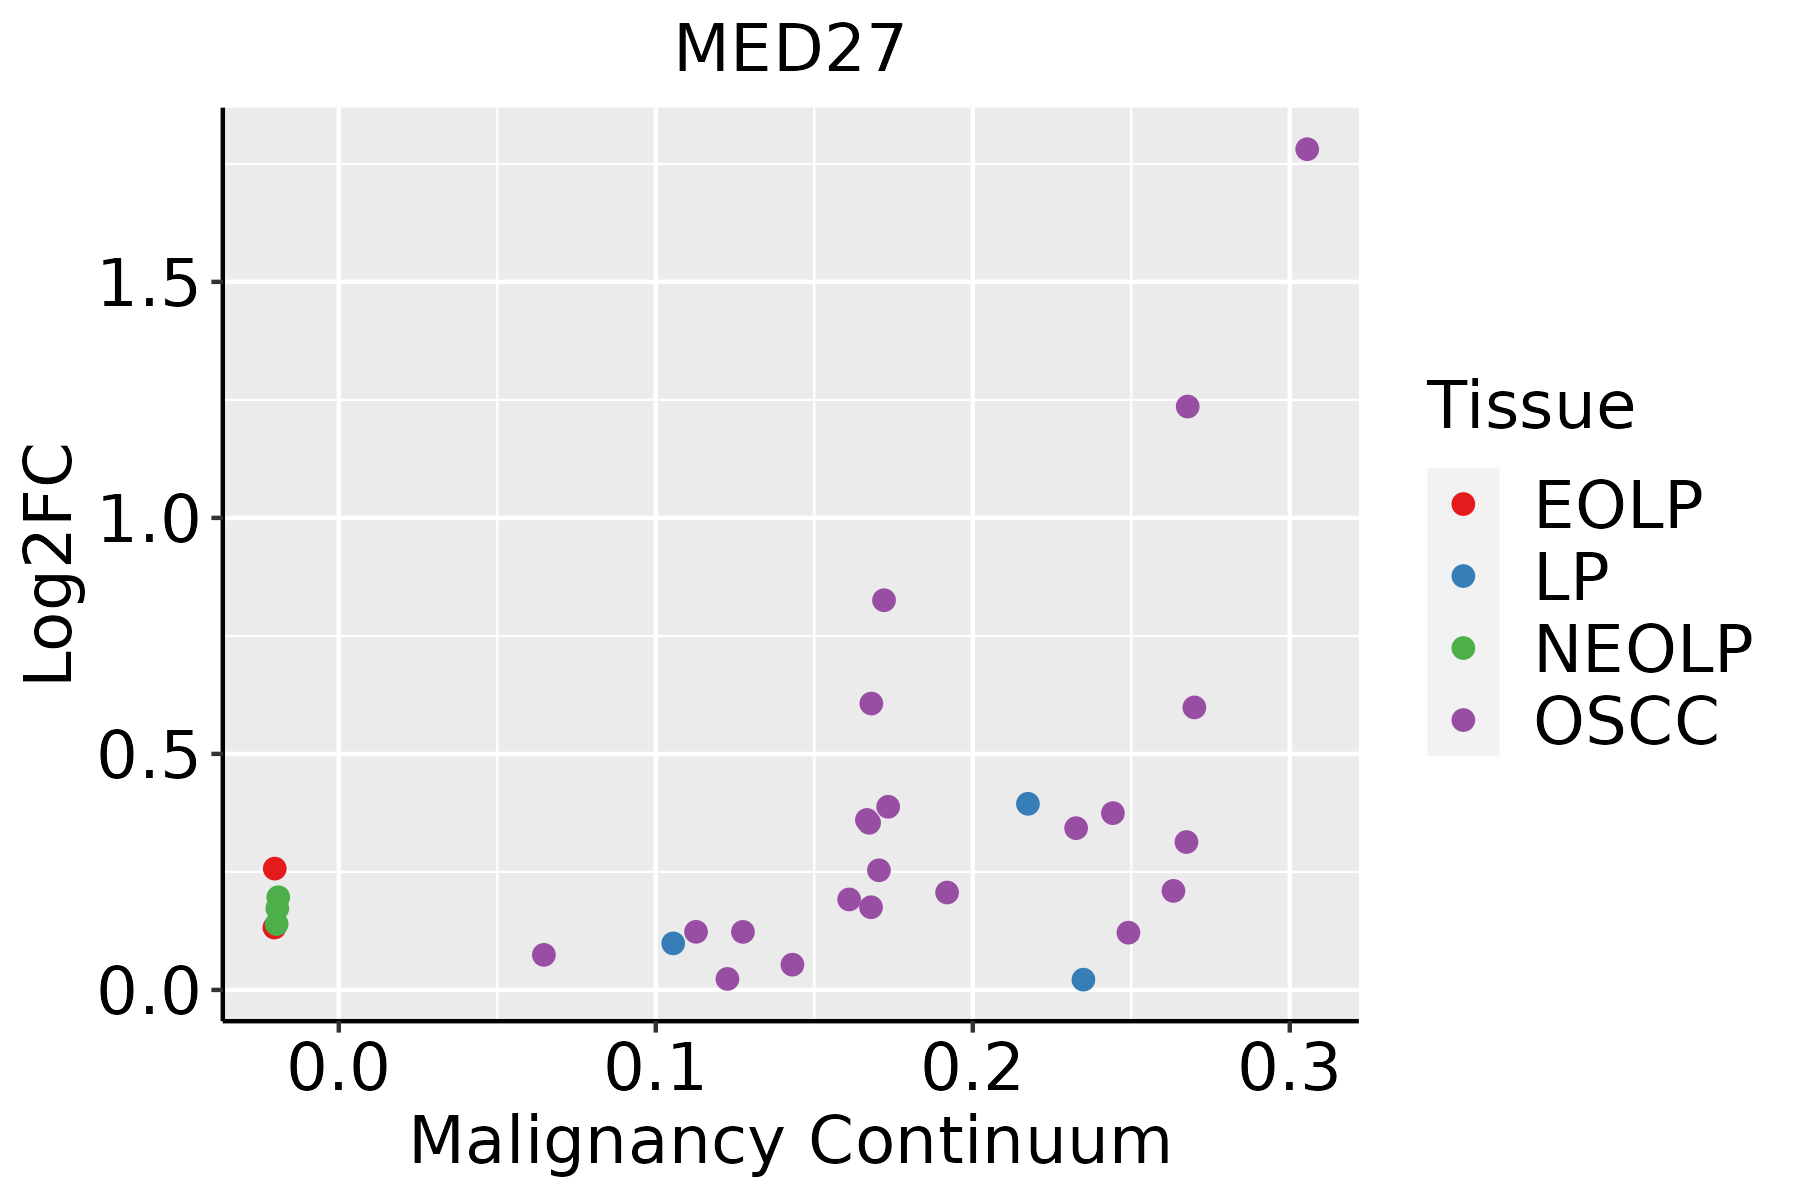 | EOLP: Erosive Oral lichen planus |
| LP: leukoplakia | ||
| NEOLP: Non-erosive oral lichen planus | ||
| OSCC: Oral squamous cell carcinoma | ||
| Skin | 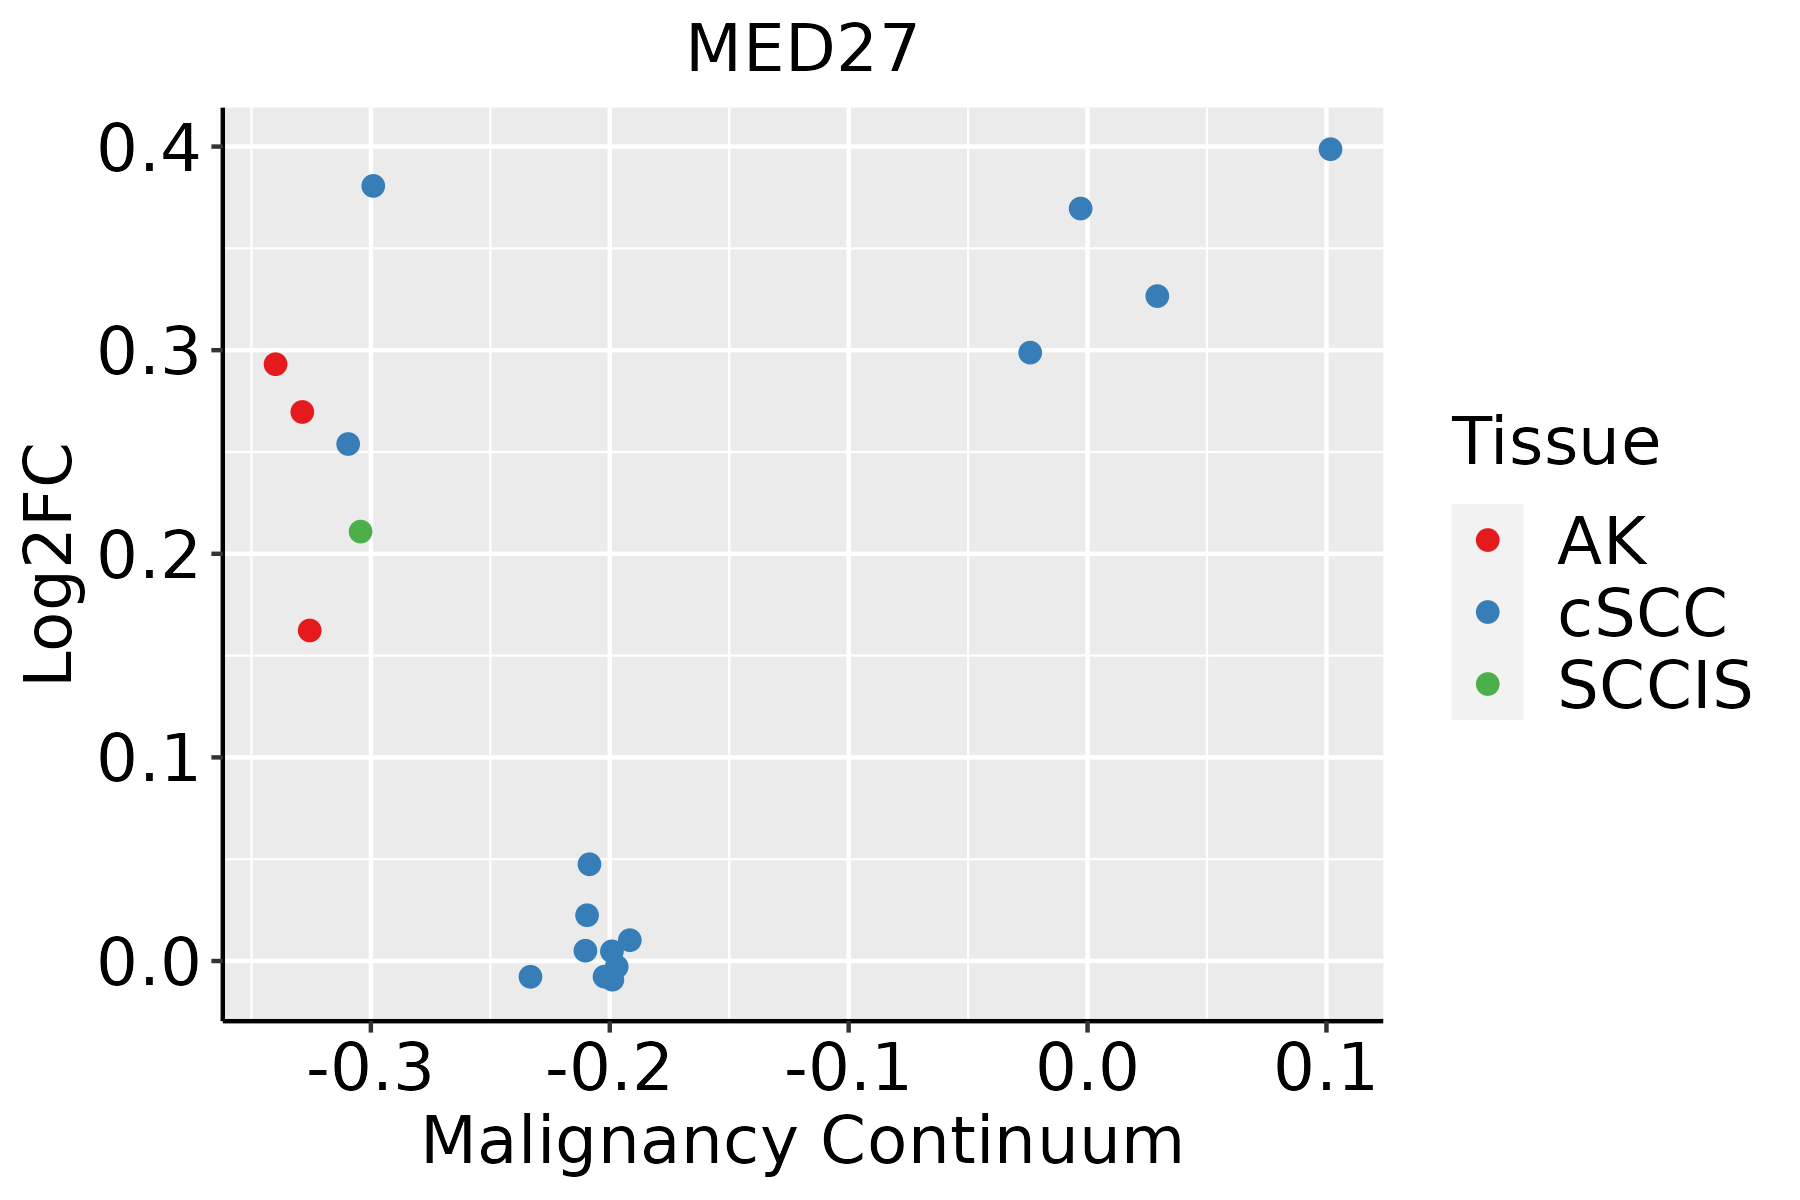 | AK: Actinic keratosis |
| cSCC: Cutaneous squamous cell carcinoma | ||
| SCCIS:squamous cell carcinoma in situ |
| ∗log2FC in expression of this searched gene in stem-like cells from each diseased tissue sample relative to stem-like cells in normal samples in each tissue plotted against the malignancy continuum. Samples are colored based on if they are from different disease stage. |
Top |
Malignant transformation related pathway analysis |
| Find out the enriched GO biological processes and KEGG pathways involved in transition from healthy to precancer to cancer |
| Tissue | Disease Stage | Enriched GO biological Processes |
| Colorectum | AD |  |
| Colorectum | SER |  |
| Colorectum | MSS |  |
| Colorectum | MSI-H |  |
| Colorectum | FAP |  |
| ∗Top 15 enriched GO BP terms are showed in the bar plot of each disease state in each tissue. Each row represents a significant GO biological process which is colored according to the -log10(p.adjust). |
| Page: 1 2 3 4 5 6 7 8 9 |
| GO ID | Tissue | Disease Stage | Description | Gene Ratio | Bg Ratio | pvalue | p.adjust | Count |
| GO:00987275 | Cervix | CC | maintenance of cell number | 30/2311 | 134/18723 | 7.98e-04 | 7.00e-03 | 30 |
| GO:00198274 | Cervix | CC | stem cell population maintenance | 29/2311 | 131/18723 | 1.17e-03 | 9.47e-03 | 29 |
| GO:009872714 | Esophagus | ESCC | maintenance of cell number | 90/8552 | 134/18723 | 3.94e-07 | 5.43e-06 | 90 |
| GO:001982714 | Esophagus | ESCC | stem cell population maintenance | 88/8552 | 131/18723 | 5.23e-07 | 6.97e-06 | 88 |
| GO:00063673 | Esophagus | ESCC | transcription initiation from RNA polymerase II promoter | 56/8552 | 77/18723 | 1.30e-06 | 1.59e-05 | 56 |
| GO:000635211 | Esophagus | ESCC | DNA-templated transcription, initiation | 86/8552 | 130/18723 | 1.88e-06 | 2.19e-05 | 86 |
| GO:00987277 | Oral cavity | OSCC | maintenance of cell number | 81/7305 | 134/18723 | 3.96e-07 | 5.90e-06 | 81 |
| GO:00198276 | Oral cavity | OSCC | stem cell population maintenance | 79/7305 | 131/18723 | 6.28e-07 | 8.96e-06 | 79 |
| GO:00063522 | Oral cavity | OSCC | DNA-templated transcription, initiation | 74/7305 | 130/18723 | 2.56e-05 | 2.39e-04 | 74 |
| GO:00063672 | Oral cavity | OSCC | transcription initiation from RNA polymerase II promoter | 46/7305 | 77/18723 | 1.82e-04 | 1.24e-03 | 46 |
| GO:001982713 | Oral cavity | EOLP | stem cell population maintenance | 38/2218 | 131/18723 | 9.10e-08 | 3.15e-06 | 38 |
| GO:009872713 | Oral cavity | EOLP | maintenance of cell number | 38/2218 | 134/18723 | 1.74e-07 | 5.61e-06 | 38 |
| GO:001982721 | Oral cavity | NEOLP | stem cell population maintenance | 34/2005 | 131/18723 | 6.89e-07 | 1.93e-05 | 34 |
| GO:009872721 | Oral cavity | NEOLP | maintenance of cell number | 34/2005 | 134/18723 | 1.21e-06 | 3.13e-05 | 34 |
| GO:00198278 | Skin | AK | stem cell population maintenance | 37/1910 | 131/18723 | 5.65e-09 | 4.03e-07 | 37 |
| GO:00987279 | Skin | AK | maintenance of cell number | 37/1910 | 134/18723 | 1.10e-08 | 7.11e-07 | 37 |
| GO:00063524 | Skin | AK | DNA-templated transcription, initiation | 23/1910 | 130/18723 | 6.10e-03 | 3.29e-02 | 23 |
| GO:001982715 | Skin | cSCC | stem cell population maintenance | 58/4864 | 131/18723 | 4.20e-06 | 6.24e-05 | 58 |
| GO:000635212 | Skin | cSCC | DNA-templated transcription, initiation | 57/4864 | 130/18723 | 7.28e-06 | 1.01e-04 | 57 |
| GO:009872715 | Skin | cSCC | maintenance of cell number | 58/4864 | 134/18723 | 9.83e-06 | 1.29e-04 | 58 |
| Page: 1 2 |
| Pathway ID | Tissue | Disease Stage | Description | Gene Ratio | Bg Ratio | pvalue | p.adjust | qvalue | Count |
| hsa0491918 | Cervix | CC | Thyroid hormone signaling pathway | 33/1267 | 121/8465 | 3.11e-04 | 1.65e-03 | 9.78e-04 | 33 |
| hsa0491919 | Cervix | CC | Thyroid hormone signaling pathway | 33/1267 | 121/8465 | 3.11e-04 | 1.65e-03 | 9.78e-04 | 33 |
| hsa0491928 | Esophagus | ESCC | Thyroid hormone signaling pathway | 78/4205 | 121/8465 | 6.79e-04 | 2.23e-03 | 1.14e-03 | 78 |
| hsa04919113 | Esophagus | ESCC | Thyroid hormone signaling pathway | 78/4205 | 121/8465 | 6.79e-04 | 2.23e-03 | 1.14e-03 | 78 |
| hsa0491926 | Oral cavity | OSCC | Thyroid hormone signaling pathway | 73/3704 | 121/8465 | 1.63e-04 | 5.52e-04 | 2.81e-04 | 73 |
| hsa04919112 | Oral cavity | OSCC | Thyroid hormone signaling pathway | 73/3704 | 121/8465 | 1.63e-04 | 5.52e-04 | 2.81e-04 | 73 |
| hsa0491927 | Oral cavity | EOLP | Thyroid hormone signaling pathway | 32/1218 | 121/8465 | 3.38e-04 | 1.42e-03 | 8.35e-04 | 32 |
| hsa0491935 | Oral cavity | EOLP | Thyroid hormone signaling pathway | 32/1218 | 121/8465 | 3.38e-04 | 1.42e-03 | 8.35e-04 | 32 |
| hsa0491942 | Oral cavity | NEOLP | Thyroid hormone signaling pathway | 28/1112 | 121/8465 | 1.70e-03 | 7.62e-03 | 4.80e-03 | 28 |
| hsa0491952 | Oral cavity | NEOLP | Thyroid hormone signaling pathway | 28/1112 | 121/8465 | 1.70e-03 | 7.62e-03 | 4.80e-03 | 28 |
| Page: 1 |
Top |
Cell-cell communication analysis |
| Identification of potential cell-cell interactions between two cell types and their ligand-receptor pairs for different disease states |
| Ligand | Receptor | LRpair | Pathway | Tissue | Disease Stage |
| Page: 1 |
Top |
Single-cell gene regulatory network inference analysis |
| Find out the significant the regulons (TFs) and the target genes of each regulon across cell types for different disease states |
| TF | Cell Type | Tissue | Disease Stage | Target Gene | RSS | Regulon Activity |
| ∗The dot plots of a searched regulon are shown for all cell subpopulations in each disease state of each tissue based on the regulon specific score inferred using pySCENIC and by calculating the average expression. |
| Page: 1 |
Top |
Somatic mutation of malignant transformation related genes |
| Annotation of somatic variants for genes involved in malignant transformation |
| Hugo Symbol | Variant Class | Variant Classification | dbSNP RS | HGVSc | HGVSp | HGVSp Short | SWISSPROT | BIOTYPE | SIFT | PolyPhen | Tumor Sample Barcode | Tissue | Histology | Sex | Age | Stage | Therapy Types | Drugs | Outcome |
| MED27 | SNV | Missense_Mutation | rs756704402 | c.163N>T | p.His55Tyr | p.H55Y | Q6P2C8 | protein_coding | deleterious(0) | benign(0.007) | TCGA-AC-A62Y-01 | Breast | breast invasive carcinoma | Female | >=65 | I/II | Unknown | Unknown | SD |
| MED27 | SNV | Missense_Mutation | c.709C>G | p.Gln237Glu | p.Q237E | Q6P2C8 | protein_coding | tolerated(0.52) | benign(0.048) | TCGA-AR-A24T-01 | Breast | breast invasive carcinoma | Female | <65 | III/IV | Chemotherapy | cytoxan | SD | |
| MED27 | SNV | Missense_Mutation | c.812N>T | p.Arg271Ile | p.R271I | Q6P2C8 | protein_coding | tolerated(0.05) | possibly_damaging(0.828) | TCGA-D8-A1J9-01 | Breast | breast invasive carcinoma | Female | <65 | I/II | Unknown | Unknown | SD | |
| MED27 | insertion | Frame_Shift_Ins | novel | c.6_7insATCA | p.Asp3IlefsTer18 | p.D3Ifs*18 | Q6P2C8 | protein_coding | TCGA-A8-A08L-01 | Breast | breast invasive carcinoma | Female | >=65 | III/IV | Unknown | Unknown | SD | ||
| MED27 | deletion | Frame_Shift_Del | novel | c.898delC | p.Arg300GlufsTer64 | p.R300Efs*64 | Q6P2C8 | protein_coding | TCGA-EW-A2FV-01 | Breast | breast invasive carcinoma | Female | <65 | III/IV | Chemotherapy | docetaxel | SD | ||
| MED27 | SNV | Missense_Mutation | c.47N>G | p.Gln16Arg | p.Q16R | Q6P2C8 | protein_coding | tolerated(0.58) | benign(0.011) | TCGA-F4-6703-01 | Colorectum | colon adenocarcinoma | Male | <65 | I/II | Unknown | Unknown | SD | |
| MED27 | SNV | Missense_Mutation | rs145767071 | c.604G>A | p.Val202Ile | p.V202I | Q6P2C8 | protein_coding | tolerated(0.72) | benign(0.096) | TCGA-WS-AB45-01 | Colorectum | colon adenocarcinoma | Female | <65 | I/II | Unknown | Unknown | SD |
| MED27 | SNV | Missense_Mutation | c.893N>G | p.Asp298Gly | p.D298G | Q6P2C8 | protein_coding | tolerated(0.11) | probably_damaging(0.979) | TCGA-AG-3726-01 | Colorectum | rectum adenocarcinoma | Female | <65 | I/II | Unknown | Unknown | SD | |
| MED27 | SNV | Missense_Mutation | novel | c.722N>T | p.Lys241Met | p.K241M | Q6P2C8 | protein_coding | deleterious(0) | probably_damaging(0.999) | TCGA-AG-3726-01 | Colorectum | rectum adenocarcinoma | Female | <65 | I/II | Unknown | Unknown | SD |
| MED27 | SNV | Missense_Mutation | c.136N>A | p.Glu46Lys | p.E46K | Q6P2C8 | protein_coding | deleterious(0.03) | possibly_damaging(0.665) | TCGA-AG-A002-01 | Colorectum | rectum adenocarcinoma | Male | <65 | I/II | Unknown | Unknown | SD |
| Page: 1 2 3 |
Top |
Related drugs of malignant transformation related genes |
| Identification of chemicals and drugs interact with genes involved in malignant transfromation |
| (DGIdb 4.0) |
| Entrez ID | Symbol | Category | Interaction Types | Drug Claim Name | Drug Name | PMIDs |
| Page: 1 |

Copyright 2023-Present -The University of Texas Health Science Center at Houston |