Schematic overview of the cellular and molecular mechanisms involved in the cancer progression, including the proposed cellular and molecular mechanisms in cancer cells trajectory. AT1: alveolar type 1 cells; AT2: alveolar type 2 cells; AAH: atypical adenomatous hyperplasia; AIS: adenocarcinoma in situ; MIA: minimally invasive adenocarcinoma; IA: invasive adenocarcinoma; EMT: epithelial-mesenchymal transition

Home

Download

Statistics

Help

Contact

Center for Computational Systems Medicine
leaf

Gene summary

leaf

Malignant transformation analysis

leaf

Malignant transformation related pathway analysis

leaf

Cell-cell communication analysis

leaf

Single-cell gene regulatory network inference analysis

leaf

Somatic mutation of malignant transformation related genes

leaf

Related drugs of malignant transformation related genes

Gene: MDFI

Gene summary for MDFI

check button Gene summary.

Gene informationSpeciesHuman
Gene symbol

MDFI

Gene ID

4188

Gene nameMyoD family inhibitor
Gene AliasI-MF
Cytomap6p21.1
Gene Typeprotein-coding
GO ID

GO:0000003

UniProtAcc

A0A024RCY2


Top

Malignant transformation analysis

check button Identification of the aberrant gene expression in precancerous and cancerous lesions by comparing the gene expression of stem-like cells in diseased tissues with normal stem cells
check button Malignant transformation involving gene list.
Entrez IDSymbolReplicatesSpeciesOrganTissueAdj P-valueLog2FCMalignancy
4188MDFIP42T-EHumanEsophagusESCC3.48e-235.78e-010.1175
4188MDFIP44T-EHumanEsophagusESCC2.00e-143.09e-010.1096
4188MDFIP47T-EHumanEsophagusESCC3.36e-195.08e-010.1067
4188MDFIP48T-EHumanEsophagusESCC1.15e-182.69e-010.0959
4188MDFIP49T-EHumanEsophagusESCC5.70e-161.58e+000.1768
4188MDFIP52T-EHumanEsophagusESCC2.10e-411.03e+000.1555
4188MDFIP54T-EHumanEsophagusESCC2.32e-081.73e-010.0975
4188MDFIP57T-EHumanEsophagusESCC1.37e-142.00e-010.0926
4188MDFIP61T-EHumanEsophagusESCC1.22e-122.41e-010.099
4188MDFIP62T-EHumanEsophagusESCC8.35e-438.46e-010.1302
4188MDFIP65T-EHumanEsophagusESCC3.23e-205.09e-010.0978
4188MDFIP74T-EHumanEsophagusESCC1.06e-319.81e-010.1479
4188MDFIP75T-EHumanEsophagusESCC1.42e-621.28e+000.1125
4188MDFIP76T-EHumanEsophagusESCC1.90e-611.36e+000.1207
4188MDFIP79T-EHumanEsophagusESCC3.62e-031.33e-010.1154
4188MDFIP80T-EHumanEsophagusESCC1.62e-461.22e+000.155
4188MDFIP82T-EHumanEsophagusESCC1.84e-138.88e-010.1072
4188MDFIP83T-EHumanEsophagusESCC3.75e-391.20e+000.1738
4188MDFIP84T-EHumanEsophagusESCC1.82e-031.88e-010.0933
4188MDFIP89T-EHumanEsophagusESCC8.31e-272.13e+000.1752
Page: 1 2 3 4 5 6 

check button Transcriptomic changes along malignancy continuum.
TissueExpression DynamicsAbbreviation
BreastThe image shows the transcriptomic changes along malignancy continuum.log2FC in expression of this searched gene in stem-like cells from each diseased tissue sample relative to stem-like cells in normal samples in each tissue plotted against the malignancy continuum. Samples are colored based on if they are from different disease stage.
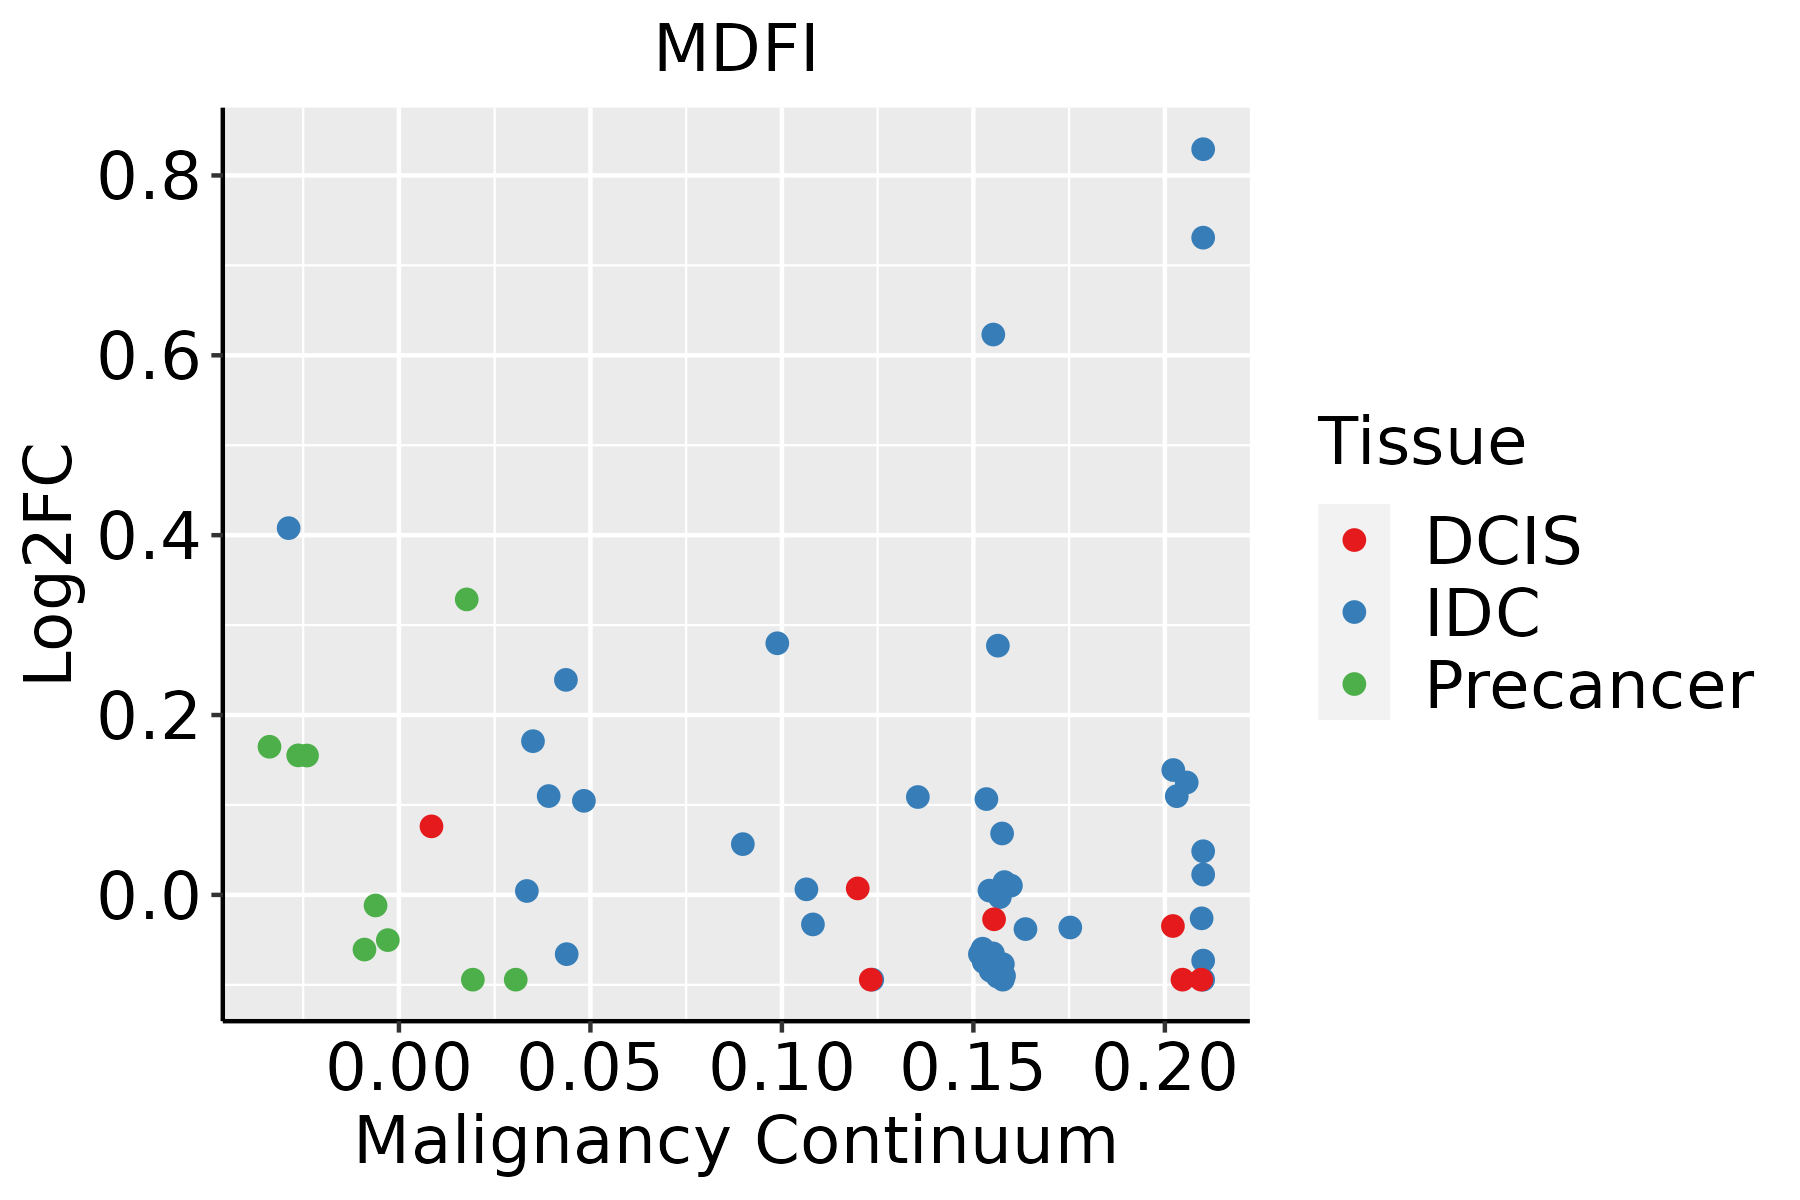
IDC: Invasive ductal carcinoma
DCIS: Ductal carcinoma in situ
Precancer(BRCA1-mut): Precancerous lesion from BRCA1 mutation carriers
EsophagusThe image shows the transcriptomic changes along malignancy continuum.log2FC in expression of this searched gene in stem-like cells from each diseased tissue sample relative to stem-like cells in normal samples in each tissue plotted against the malignancy continuum. Samples are colored based on if they are from different disease stage.
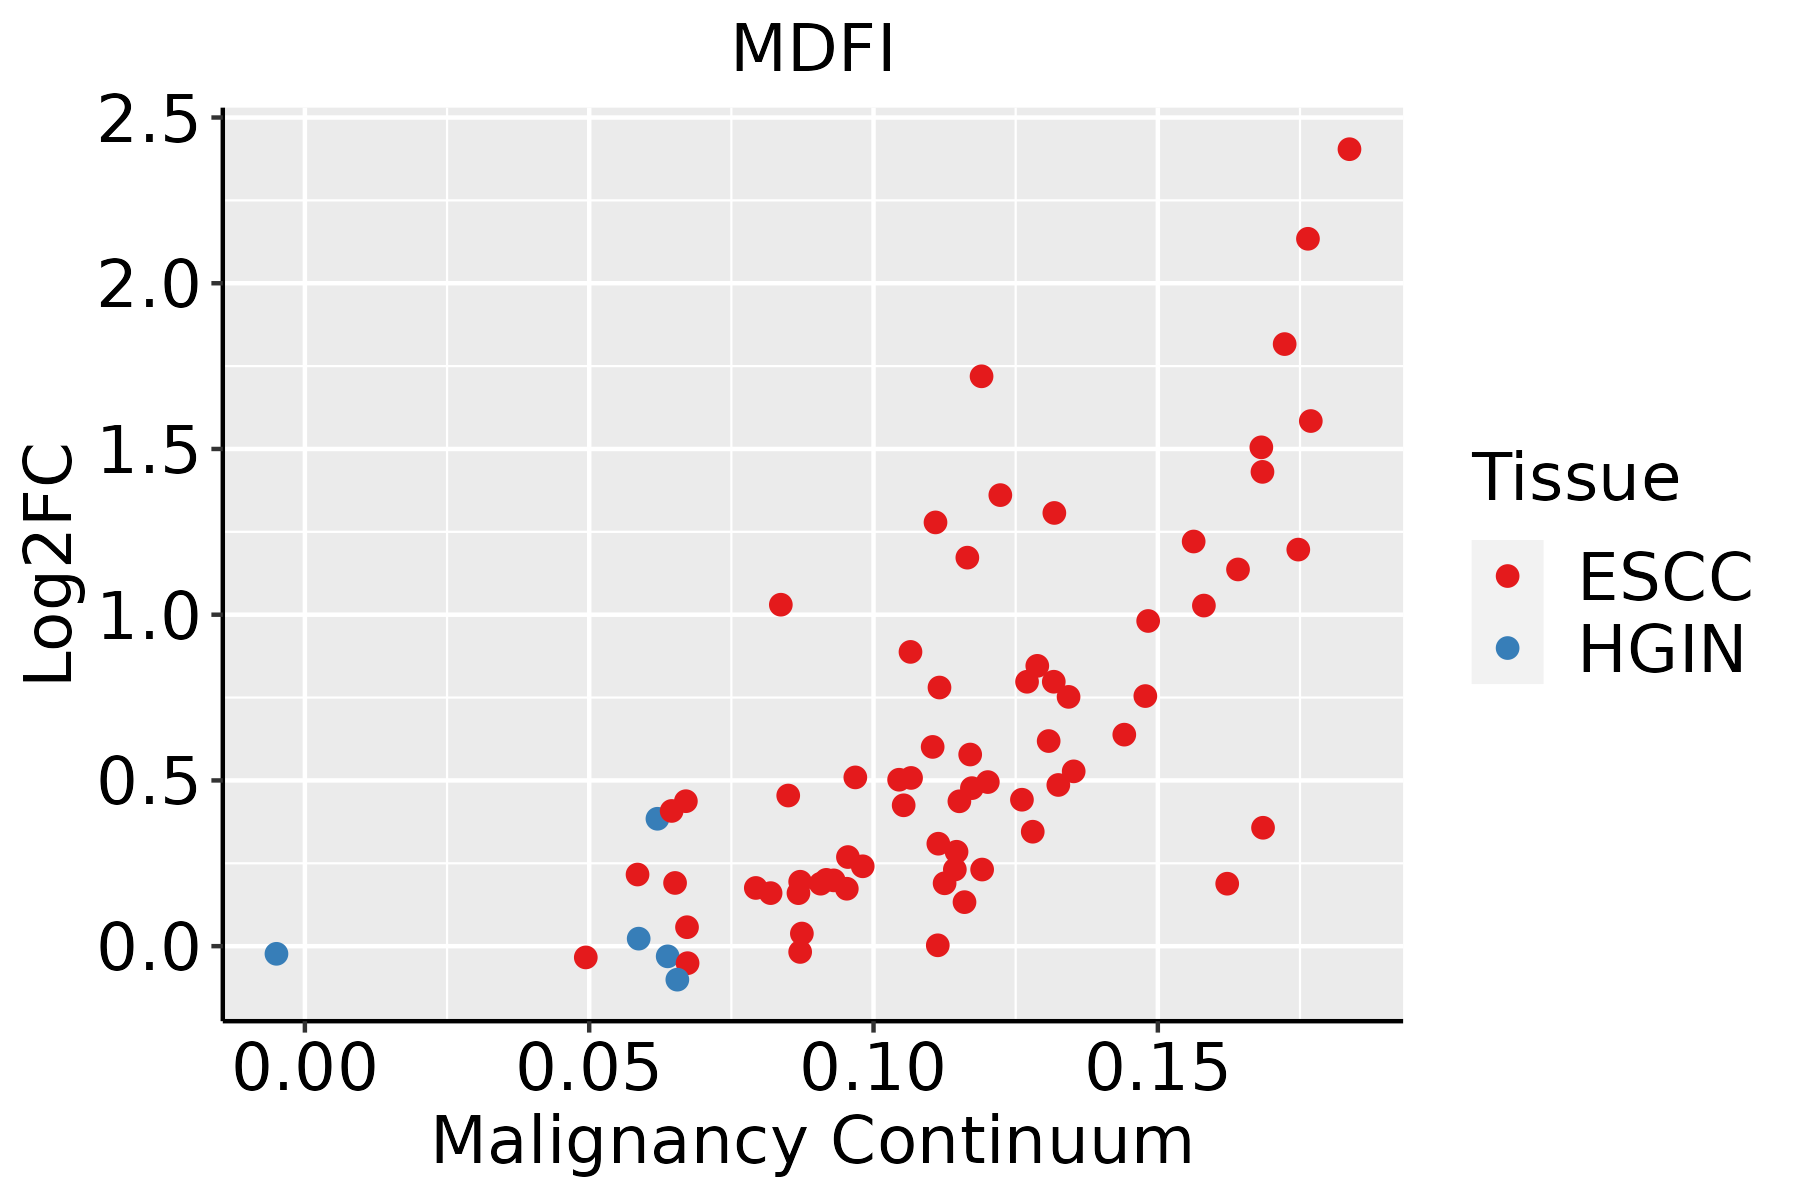
ESCC: Esophageal squamous cell carcinoma
HGIN: High-grade intraepithelial neoplasias
LGIN: Low-grade intraepithelial neoplasias
LiverThe image shows the transcriptomic changes along malignancy continuum.log2FC in expression of this searched gene in stem-like cells from each diseased tissue sample relative to stem-like cells in normal samples in each tissue plotted against the malignancy continuum. Samples are colored based on if they are from different disease stage.HCC: Hepatocellular carcinoma
NAFLD: Non-alcoholic fatty liver disease
Oral CavityThe image shows the transcriptomic changes along malignancy continuum.log2FC in expression of this searched gene in stem-like cells from each diseased tissue sample relative to stem-like cells in normal samples in each tissue plotted against the malignancy continuum. Samples are colored based on if they are from different disease stage.EOLP: Erosive Oral lichen planus
LP: leukoplakia
NEOLP: Non-erosive oral lichen planus
OSCC: Oral squamous cell carcinoma
SkinThe image shows the transcriptomic changes along malignancy continuum.log2FC in expression of this searched gene in stem-like cells from each diseased tissue sample relative to stem-like cells in normal samples in each tissue plotted against the malignancy continuum. Samples are colored based on if they are from different disease stage.
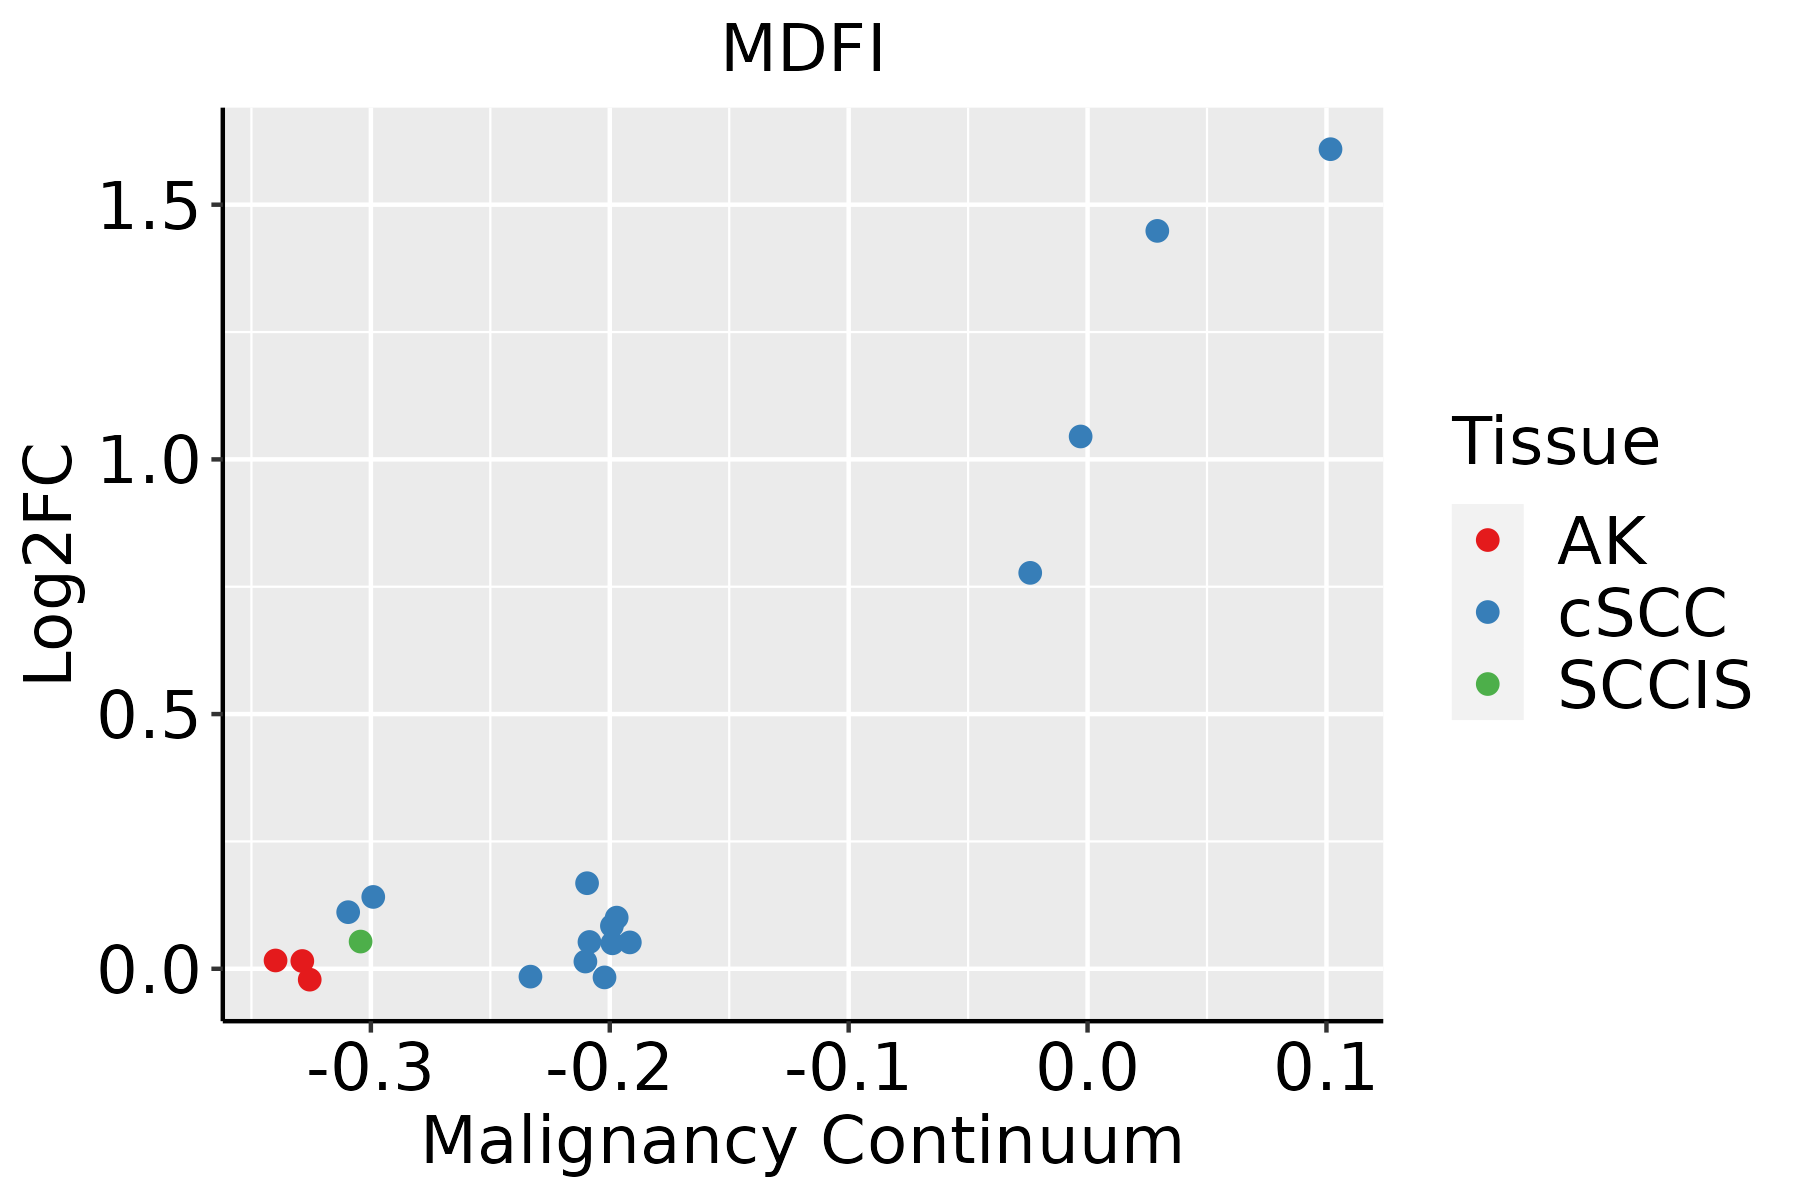
AK: Actinic keratosis
cSCC: Cutaneous squamous cell carcinoma
SCCIS:squamous cell carcinoma in situ
ThyroidThe image shows the transcriptomic changes along malignancy continuum.log2FC in expression of this searched gene in stem-like cells from each diseased tissue sample relative to stem-like cells in normal samples in each tissue plotted against the malignancy continuum. Samples are colored based on if they are from different disease stage.
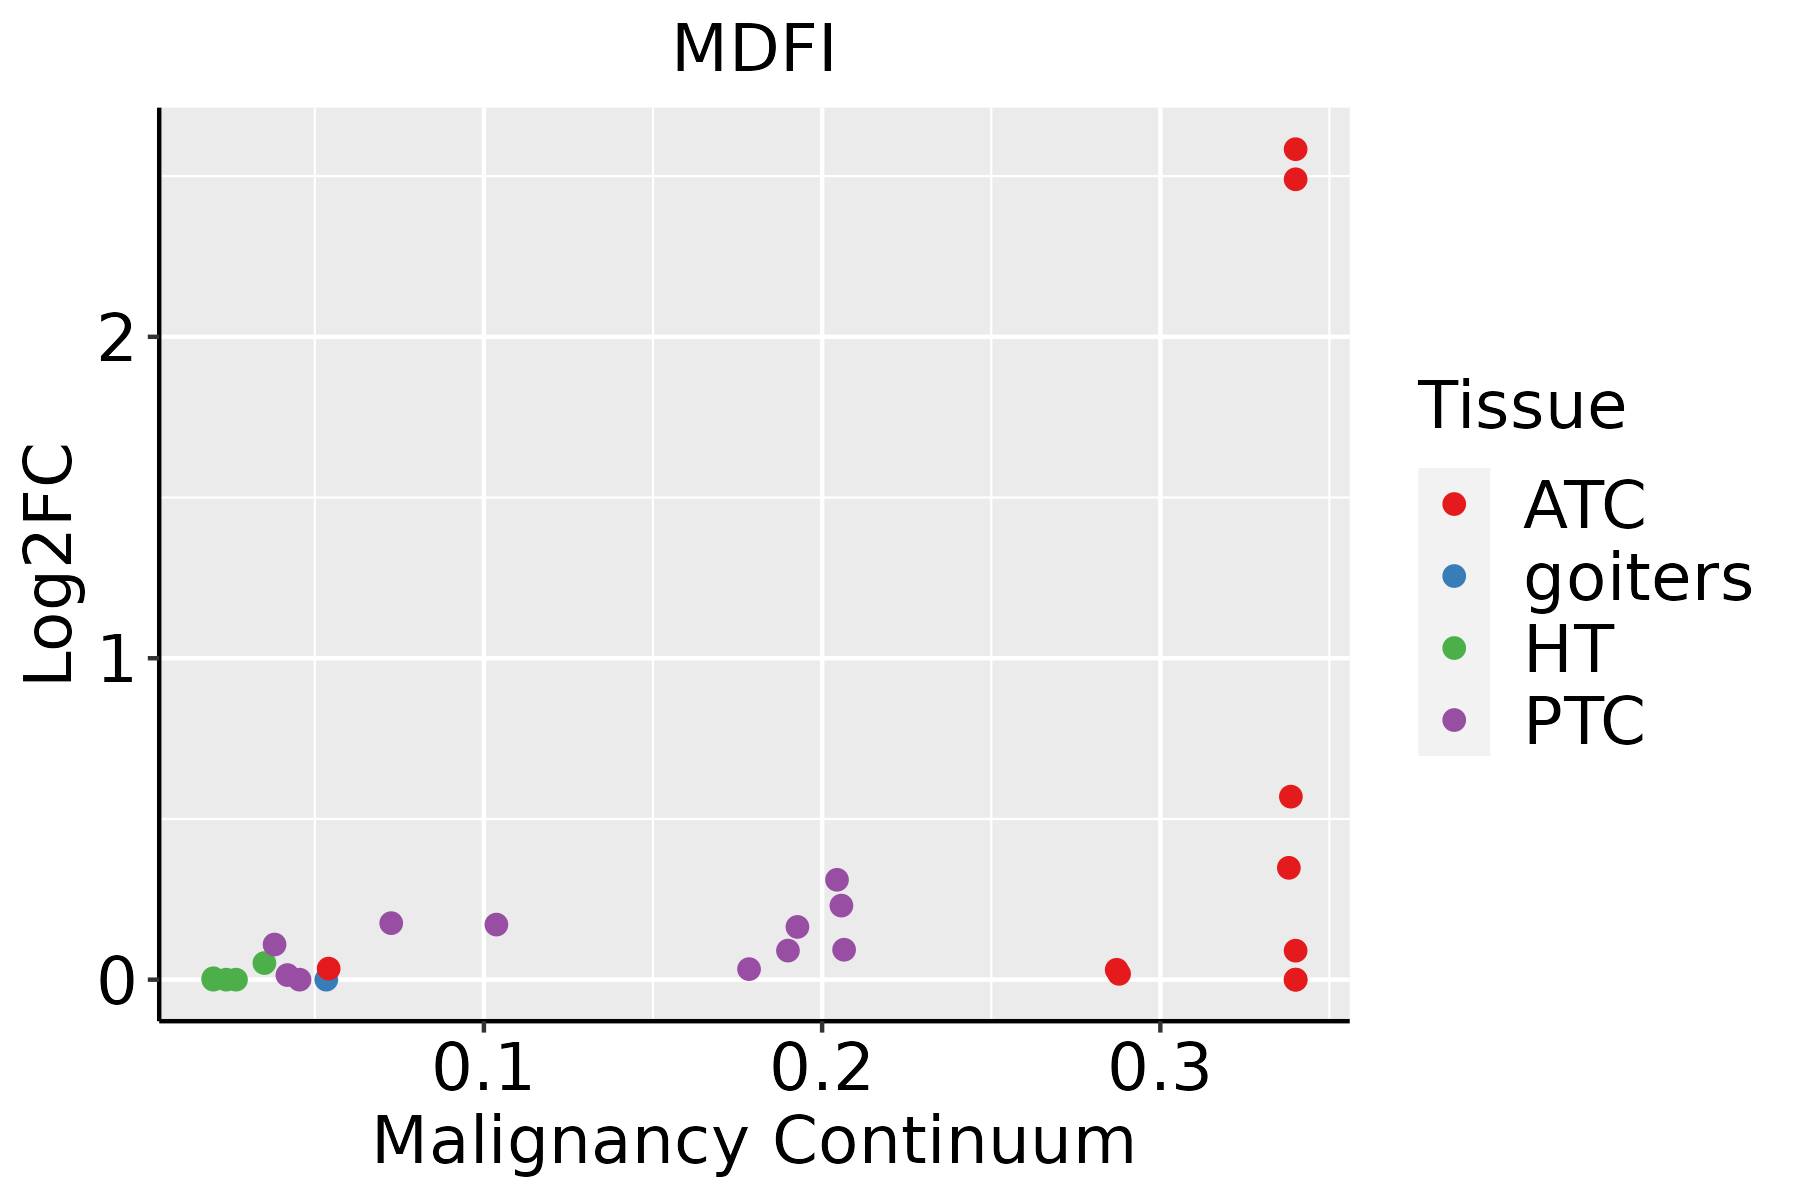
ATC: Anaplastic thyroid cancer
HT: Hashimoto's thyroiditis
PTC: Papillary thyroid cancer
∗log2FC in expression of this searched gene in stem-like cells from each diseased tissue sample relative to stem-like cells in normal samples in each tissue plotted against the malignancy continuum. Samples are colored based on if they are from different disease stage.

Top

Malignant transformation related pathway analysis

check buttonFind out the enriched GO biological processes and KEGG pathways involved in transition from healthy to precancer to cancer
check button Figure of enriched GO biological processes.
TissueDisease StageEnriched GO biological Processes
ColorectumADGO analysis - Figure of enriched GO biological processes: Top 15 enriched GO BP terms are showed in the bar plot of each disease state in each tissue. Each row represents a significant GO biological process which is colored according to the -log10(p.adjust).
ColorectumSERGO analysis - Figure of enriched GO biological processes: Top 15 enriched GO BP terms are showed in the bar plot of each disease state in each tissue. Each row represents a significant GO biological process which is colored according to the -log10(p.adjust).
ColorectumMSSGO analysis - Figure of enriched GO biological processes: Top 15 enriched GO BP terms are showed in the bar plot of each disease state in each tissue. Each row represents a significant GO biological process which is colored according to the -log10(p.adjust).
ColorectumMSI-HGO analysis - Figure of enriched GO biological processes: Top 15 enriched GO BP terms are showed in the bar plot of each disease state in each tissue. Each row represents a significant GO biological process which is colored according to the -log10(p.adjust).
ColorectumFAPGO analysis - Figure of enriched GO biological processes: Top 15 enriched GO BP terms are showed in the bar plot of each disease state in each tissue. Each row represents a significant GO biological process which is colored according to the -log10(p.adjust).
∗Top 15 enriched GO BP terms are showed in the bar plot of each disease state in each tissue. Each row represents a significant GO biological process which is colored according to the -log10(p.adjust).
Page: 1 2 3 4 5 6 7 8 9 

check button Enriched GO biological processes.
GO IDTissueDisease StageDescriptionGene RatioBg Ratiopvaluep.adjustCount
GO:00511019BreastPrecancerregulation of DNA binding22/1080118/187239.28e-073.71e-0522
GO:00451859BreastPrecancermaintenance of protein location19/108094/187231.43e-065.35e-0519
GO:00510989BreastPrecancerregulation of binding44/1080363/187232.59e-068.65e-0544
GO:00512358BreastPrecancermaintenance of location40/1080327/187235.85e-061.71e-0440
GO:00018927BreastPrecancerembryonic placenta development14/108082/187232.30e-043.48e-0314
GO:00486087BreastPrecancerreproductive structure development43/1080424/187232.36e-043.56e-0343
GO:00614587BreastPrecancerreproductive system development43/1080427/187232.75e-044.00e-0343
GO:00018907BreastPrecancerplacenta development19/1080144/187236.26e-047.78e-0319
GO:00017017BreastPrecancerin utero embryonic development35/1080367/187232.47e-032.27e-0235
GO:0060706BreastPrecancercell differentiation involved in embryonic placenta development6/108025/187232.49e-032.28e-026
GO:00511008BreastPrecancernegative regulation of binding19/1080162/187232.56e-032.32e-0219
GO:00512203BreastPrecancercytoplasmic sequestering of protein5/108022/187237.32e-034.88e-025
GO:005109814BreastIDCregulation of binding57/1434363/187231.59e-078.76e-0657
GO:005110114BreastIDCregulation of DNA binding26/1434118/187237.42e-073.40e-0526
GO:004860812BreastIDCreproductive structure development60/1434424/187232.71e-061.03e-0460
GO:006145813BreastIDCreproductive system development60/1434427/187233.41e-061.24e-0460
GO:004518514BreastIDCmaintenance of protein location21/143494/187236.69e-062.05e-0421
GO:005123513BreastIDCmaintenance of location48/1434327/187239.90e-062.77e-0448
GO:000189013BreastIDCplacenta development25/1434144/187239.19e-051.78e-0325
GO:000189213BreastIDCembryonic placenta development16/143482/187234.28e-045.84e-0316
Page: 1 2 3 4 5 6 7 8 9 10 11 12 13 14 15 

check button Enriched KEGG pathways.
Pathway IDTissueDisease StageDescriptionGene RatioBg Ratiopvaluep.adjustqvalueCount
Page: 1 

Top

Cell-cell communication analysis

check buttonIdentification of potential cell-cell interactions between two cell types and their ligand-receptor pairs for different disease states
LigandReceptorLRpairPathwayTissueDisease Stage
Page: 1 

Top

Single-cell gene regulatory network inference analysis

check buttonFind out the significant the regulons (TFs) and the target genes of each regulon across cell types for different disease states
TFCell TypeTissueDisease StageTarget GeneRSSRegulon Activity
∗The dot plots of a searched regulon are shown for all cell subpopulations in each disease state of each tissue based on the regulon specific score inferred using pySCENIC and by calculating the average expression.
Page: 1 

Top

Somatic mutation of malignant transformation related genes

check buttonAnnotation of somatic variants for genes involved in malignant transformation
Hugo SymbolVariant ClassVariant ClassificationdbSNP RSHGVScHGVSpHGVSp ShortSWISSPROTBIOTYPESIFTPolyPhenTumor Sample BarcodeTissueHistologySexAgeStageTherapy TypesDrugsOutcome
MDFISNVMissense_Mutationc.522C>Gp.Cys174Trpp.C174WQ99750protein_codingdeleterious(0)probably_damaging(0.999)TCGA-AO-A0J6-01Breastbreast invasive carcinomaFemale<65I/IIChemotherapydoxorubicinSD
MDFIinsertionNonsense_Mutationnovelc.637_638insTGGGATTACAGGCATGAGCCACTGGGCCCGGCCGACTTCTCTTAp.Asp213ValfsTer6p.D213Vfs*6Q99750protein_codingTCGA-A2-A0CU-01Breastbreast invasive carcinomaFemale>=65I/IIHormone TherapytamoxiphenSD
MDFISNVMissense_Mutationc.500N>Ap.Cys167Tyrp.C167YQ99750protein_codingdeleterious(0)probably_damaging(0.988)TCGA-CK-4951-01Colorectumcolon adenocarcinomaFemale>=65I/IIUnknownUnknownPD
MDFISNVMissense_Mutationc.500N>Ap.Cys167Tyrp.C167YQ99750protein_codingdeleterious(0)probably_damaging(0.988)TCGA-AG-3909-01Colorectumrectum adenocarcinomaFemale>=65III/IVChemotherapyfolinicCR
MDFISNVMissense_Mutationrs770572756c.343N>Tp.Arg115Trpp.R115WQ99750protein_codingdeleterious(0.03)possibly_damaging(0.528)TCGA-AJ-A3BG-01Endometriumuterine corpus endometrioid carcinomaFemale>=65I/IIChemotherapycarboplatinPD
MDFISNVMissense_Mutationnovelc.446N>Gp.Lys149Argp.K149RQ99750protein_codingtolerated(0.17)benign(0.01)TCGA-AX-A3G9-01Endometriumuterine corpus endometrioid carcinomaFemale<65III/IVChemotherapycarboplatinSD
MDFISNVMissense_Mutationrs768704952c.382N>Tp.Arg128Trpp.R128WQ99750protein_codingdeleterious(0)probably_damaging(0.992)TCGA-B5-A11H-01Endometriumuterine corpus endometrioid carcinomaFemale>=65III/IVHormone TherapymegaceSD
MDFISNVMissense_Mutationrs753464609c.170N>Tp.Ala57Valp.A57VQ99750protein_codingtolerated(0.88)benign(0.003)TCGA-B5-A3FC-01Endometriumuterine corpus endometrioid carcinomaFemale<65I/IIUnknownUnknownSD
MDFISNVMissense_Mutationrs767995449c.409N>Ap.Ala137Thrp.A137TQ99750protein_codingtolerated(0.68)benign(0.009)TCGA-D1-A167-01Endometriumuterine corpus endometrioid carcinomaFemale>=65I/IIUnknownUnknownSD
MDFISNVMissense_Mutationnovelc.371N>Tp.Pro124Leup.P124LQ99750protein_codingdeleterious(0)benign(0.036)TCGA-EY-A215-01Endometriumuterine corpus endometrioid carcinomaFemale<65I/IIUnknownUnknownSD
Page: 1 2 

Top

Related drugs of malignant transformation related genes

check buttonIdentification of chemicals and drugs interact with genes involved in malignant transfromation
(DGIdb 4.0)
Entrez IDSymbolCategoryInteraction TypesDrug Claim NameDrug NamePMIDs
Page: 1