
|
|||||
|
 | |
| |
| |
| |
| |
| |
|
Gene: MAPRE2 |
Gene summary for MAPRE2 |
| Gene information | Species | Human | Gene symbol | MAPRE2 | Gene ID | 10982 |
| Gene name | microtubule associated protein RP/EB family member 2 | |
| Gene Alias | CSCSC2 | |
| Cytomap | 18q12.1-q12.2 | |
| Gene Type | protein-coding | GO ID | GO:0000226 | UniProtAcc | Q15555 |
Top |
Malignant transformation analysis |
| Identification of the aberrant gene expression in precancerous and cancerous lesions by comparing the gene expression of stem-like cells in diseased tissues with normal stem cells |
| Entrez ID | Symbol | Replicates | Species | Organ | Tissue | Adj P-value | Log2FC | Malignancy |
| 10982 | MAPRE2 | P76T-E | Human | Esophagus | ESCC | 1.37e-08 | 2.38e-01 | 0.1207 |
| 10982 | MAPRE2 | P79T-E | Human | Esophagus | ESCC | 1.81e-09 | 1.94e-01 | 0.1154 |
| 10982 | MAPRE2 | P80T-E | Human | Esophagus | ESCC | 5.25e-11 | 3.52e-01 | 0.155 |
| 10982 | MAPRE2 | P82T-E | Human | Esophagus | ESCC | 9.83e-05 | 5.09e-01 | 0.1072 |
| 10982 | MAPRE2 | P83T-E | Human | Esophagus | ESCC | 2.29e-08 | 2.64e-01 | 0.1738 |
| 10982 | MAPRE2 | P84T-E | Human | Esophagus | ESCC | 1.91e-02 | 1.55e-01 | 0.0933 |
| 10982 | MAPRE2 | P89T-E | Human | Esophagus | ESCC | 1.73e-08 | 3.90e-01 | 0.1752 |
| 10982 | MAPRE2 | P91T-E | Human | Esophagus | ESCC | 5.15e-12 | 8.36e-01 | 0.1828 |
| 10982 | MAPRE2 | P104T-E | Human | Esophagus | ESCC | 5.25e-04 | 3.57e-01 | 0.0931 |
| 10982 | MAPRE2 | P107T-E | Human | Esophagus | ESCC | 5.27e-35 | 8.64e-01 | 0.171 |
| 10982 | MAPRE2 | P127T-E | Human | Esophagus | ESCC | 4.06e-05 | 3.95e-02 | 0.0826 |
| 10982 | MAPRE2 | P128T-E | Human | Esophagus | ESCC | 3.67e-13 | 4.03e-01 | 0.1241 |
| 10982 | MAPRE2 | S43 | Human | Liver | Cirrhotic | 1.53e-02 | -7.09e-02 | -0.0187 |
| 10982 | MAPRE2 | HCC1_Meng | Human | Liver | HCC | 2.91e-52 | 2.77e-02 | 0.0246 |
| 10982 | MAPRE2 | HCC2_Meng | Human | Liver | HCC | 2.20e-14 | -2.87e-03 | 0.0107 |
| 10982 | MAPRE2 | Pt13.b | Human | Liver | HCC | 5.16e-03 | 3.51e-02 | 0.0251 |
| 10982 | MAPRE2 | S014 | Human | Liver | HCC | 8.49e-11 | 6.30e-01 | 0.2254 |
| 10982 | MAPRE2 | S015 | Human | Liver | HCC | 5.54e-15 | 8.02e-01 | 0.2375 |
| 10982 | MAPRE2 | S016 | Human | Liver | HCC | 1.05e-15 | 6.92e-01 | 0.2243 |
| 10982 | MAPRE2 | S028 | Human | Liver | HCC | 4.98e-08 | 5.35e-01 | 0.2503 |
| Page: 1 2 3 4 |
| Tissue | Expression Dynamics | Abbreviation |
| Esophagus |  | ESCC: Esophageal squamous cell carcinoma |
| HGIN: High-grade intraepithelial neoplasias | ||
| LGIN: Low-grade intraepithelial neoplasias | ||
| Liver | 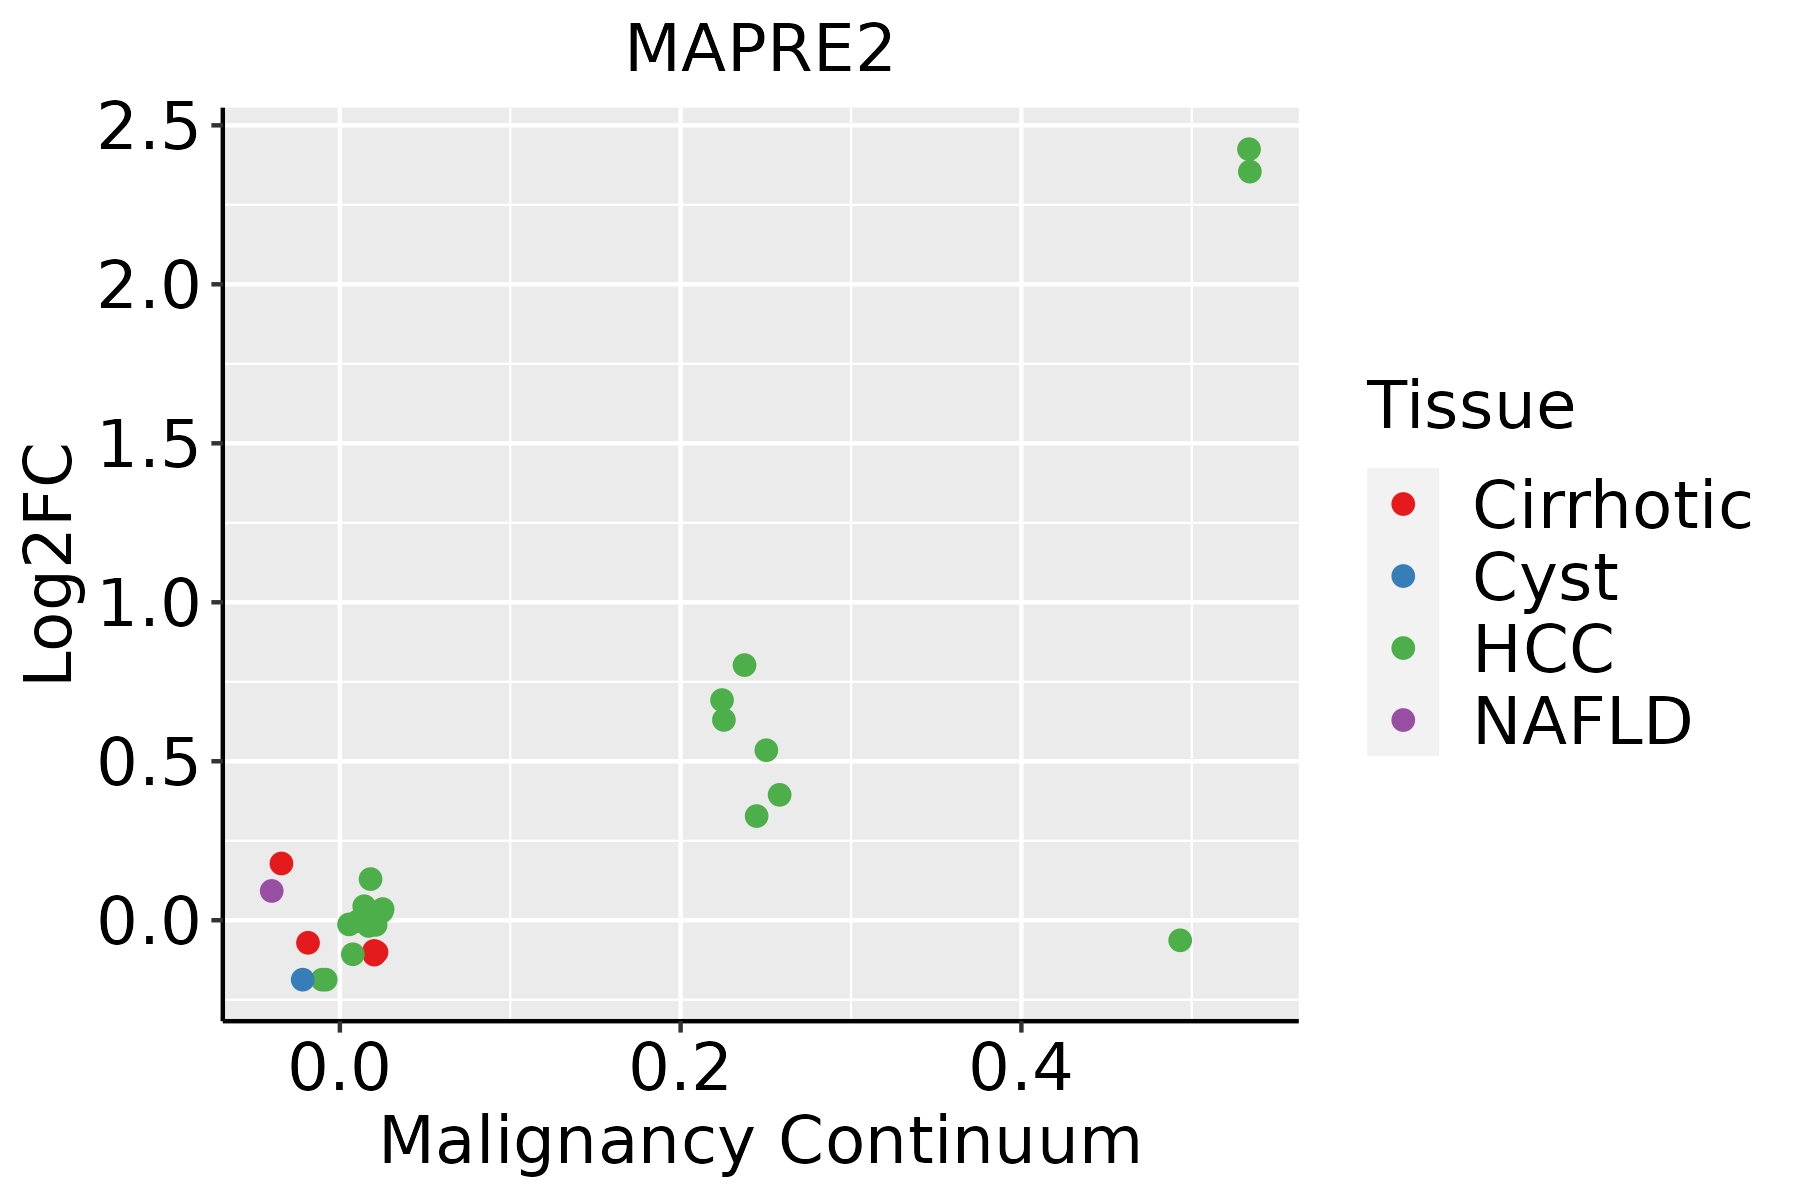 | HCC: Hepatocellular carcinoma |
| NAFLD: Non-alcoholic fatty liver disease |
| ∗log2FC in expression of this searched gene in stem-like cells from each diseased tissue sample relative to stem-like cells in normal samples in each tissue plotted against the malignancy continuum. Samples are colored based on if they are from different disease stage. |
Top |
Malignant transformation related pathway analysis |
| Find out the enriched GO biological processes and KEGG pathways involved in transition from healthy to precancer to cancer |
| Tissue | Disease Stage | Enriched GO biological Processes |
| Colorectum | AD |  |
| Colorectum | SER |  |
| Colorectum | MSS |  |
| Colorectum | MSI-H |  |
| Colorectum | FAP |  |
| ∗Top 15 enriched GO BP terms are showed in the bar plot of each disease state in each tissue. Each row represents a significant GO biological process which is colored according to the -log10(p.adjust). |
| Page: 1 2 3 4 5 6 7 8 9 |
| GO ID | Tissue | Disease Stage | Description | Gene Ratio | Bg Ratio | pvalue | p.adjust | Count |
| GO:0022411111 | Esophagus | ESCC | cellular component disassembly | 305/8552 | 443/18723 | 1.94e-23 | 4.57e-21 | 305 |
| GO:000705114 | Esophagus | ESCC | spindle organization | 134/8552 | 184/18723 | 5.70e-14 | 2.87e-12 | 134 |
| GO:0150115110 | Esophagus | ESCC | cell-substrate junction organization | 77/8552 | 101/18723 | 3.46e-10 | 9.57e-09 | 77 |
| GO:00512256 | Esophagus | ESCC | spindle assembly | 85/8552 | 117/18723 | 2.72e-09 | 5.98e-08 | 85 |
| GO:00705078 | Esophagus | ESCC | regulation of microtubule cytoskeleton organization | 99/8552 | 148/18723 | 1.43e-07 | 2.29e-06 | 99 |
| GO:000726510 | Esophagus | ESCC | Ras protein signal transduction | 201/8552 | 337/18723 | 1.44e-07 | 2.30e-06 | 201 |
| GO:00726985 | Esophagus | ESCC | protein localization to microtubule cytoskeleton | 43/8552 | 54/18723 | 3.28e-07 | 4.61e-06 | 43 |
| GO:00443804 | Esophagus | ESCC | protein localization to cytoskeleton | 45/8552 | 58/18723 | 6.89e-07 | 8.99e-06 | 45 |
| GO:015011619 | Esophagus | ESCC | regulation of cell-substrate junction organization | 51/8552 | 71/18723 | 6.99e-06 | 7.04e-05 | 51 |
| GO:00311094 | Esophagus | ESCC | microtubule polymerization or depolymerization | 77/8552 | 122/18723 | 7.60e-05 | 5.68e-04 | 77 |
| GO:00311104 | Esophagus | ESCC | regulation of microtubule polymerization or depolymerization | 57/8552 | 88/18723 | 2.32e-04 | 1.44e-03 | 57 |
| GO:00328864 | Esophagus | ESCC | regulation of microtubule-based process | 134/8552 | 240/18723 | 9.44e-04 | 4.80e-03 | 134 |
| GO:0035372 | Esophagus | ESCC | protein localization to microtubule | 15/8552 | 18/18723 | 1.20e-03 | 5.88e-03 | 15 |
| GO:000166720 | Esophagus | ESCC | ameboidal-type cell migration | 250/8552 | 475/18723 | 1.22e-03 | 5.97e-03 | 250 |
| GO:00465789 | Esophagus | ESCC | regulation of Ras protein signal transduction | 106/8552 | 189/18723 | 2.49e-03 | 1.08e-02 | 106 |
| GO:01501178 | Esophagus | ESCC | positive regulation of cell-substrate junction organization | 23/8552 | 33/18723 | 4.57e-03 | 1.78e-02 | 23 |
| GO:004308715 | Esophagus | ESCC | regulation of GTPase activity | 183/8552 | 348/18723 | 5.34e-03 | 2.00e-02 | 183 |
| GO:001063120 | Esophagus | ESCC | epithelial cell migration | 187/8552 | 357/18723 | 6.05e-03 | 2.23e-02 | 187 |
| GO:009013220 | Esophagus | ESCC | epithelium migration | 188/8552 | 360/18723 | 6.96e-03 | 2.54e-02 | 188 |
| GO:009013020 | Esophagus | ESCC | tissue migration | 190/8552 | 365/18723 | 7.91e-03 | 2.82e-02 | 190 |
| Page: 1 2 3 |
| Pathway ID | Tissue | Disease Stage | Description | Gene Ratio | Bg Ratio | pvalue | p.adjust | qvalue | Count |
| Page: 1 |
Top |
Cell-cell communication analysis |
| Identification of potential cell-cell interactions between two cell types and their ligand-receptor pairs for different disease states |
| Ligand | Receptor | LRpair | Pathway | Tissue | Disease Stage |
| Page: 1 |
Top |
Single-cell gene regulatory network inference analysis |
| Find out the significant the regulons (TFs) and the target genes of each regulon across cell types for different disease states |
| TF | Cell Type | Tissue | Disease Stage | Target Gene | RSS | Regulon Activity |
| ∗The dot plots of a searched regulon are shown for all cell subpopulations in each disease state of each tissue based on the regulon specific score inferred using pySCENIC and by calculating the average expression. |
| Page: 1 |
Top |
Somatic mutation of malignant transformation related genes |
| Annotation of somatic variants for genes involved in malignant transformation |
| Hugo Symbol | Variant Class | Variant Classification | dbSNP RS | HGVSc | HGVSp | HGVSp Short | SWISSPROT | BIOTYPE | SIFT | PolyPhen | Tumor Sample Barcode | Tissue | Histology | Sex | Age | Stage | Therapy Types | Drugs | Outcome |
| MAPRE2 | insertion | Frame_Shift_Ins | novel | c.110_111insATCTCTCCTGGCTGGGCGTGGTGGCTCAT | p.Arg38SerfsTer26 | p.R38Sfs*26 | Q15555 | protein_coding | TCGA-AN-A0FX-01 | Breast | breast invasive carcinoma | Female | <65 | I/II | Unknown | Unknown | SD | ||
| MAPRE2 | SNV | Missense_Mutation | c.499T>C | p.Tyr167His | p.Y167H | Q15555 | protein_coding | deleterious(0.02) | probably_damaging(0.993) | TCGA-A6-6780-01 | Colorectum | colon adenocarcinoma | Male | >=65 | I/II | Unknown | Unknown | SD | |
| MAPRE2 | SNV | Missense_Mutation | c.920C>T | p.Thr307Ile | p.T307I | Q15555 | protein_coding | tolerated(0.06) | benign(0.266) | TCGA-A6-6780-01 | Colorectum | colon adenocarcinoma | Male | >=65 | I/II | Unknown | Unknown | SD | |
| MAPRE2 | SNV | Missense_Mutation | rs756121791 | c.388N>A | p.Val130Ile | p.V130I | Q15555 | protein_coding | deleterious(0.02) | probably_damaging(0.999) | TCGA-AA-A010-01 | Colorectum | colon adenocarcinoma | Female | <65 | I/II | Chemotherapy | folinic | CR |
| MAPRE2 | SNV | Missense_Mutation | c.428G>A | p.Arg143His | p.R143H | Q15555 | protein_coding | deleterious(0) | probably_damaging(0.946) | TCGA-D5-6530-01 | Colorectum | colon adenocarcinoma | Male | <65 | I/II | Unknown | Unknown | SD | |
| MAPRE2 | insertion | Frame_Shift_Ins | novel | c.575_576insA | p.Ser195ValfsTer13 | p.S195Vfs*13 | Q15555 | protein_coding | TCGA-D5-6927-01 | Colorectum | colon adenocarcinoma | Male | <65 | I/II | Unknown | Unknown | SD | ||
| MAPRE2 | SNV | Missense_Mutation | novel | c.133N>A | p.Ala45Thr | p.A45T | Q15555 | protein_coding | deleterious(0.04) | probably_damaging(0.953) | TCGA-AX-A06F-01 | Endometrium | uterine corpus endometrioid carcinoma | Female | <65 | III/IV | Chemotherapy | carboplatin | SD |
| MAPRE2 | SNV | Missense_Mutation | novel | c.500N>G | p.Tyr167Cys | p.Y167C | Q15555 | protein_coding | deleterious(0.01) | probably_damaging(0.993) | TCGA-AX-A1CE-01 | Endometrium | uterine corpus endometrioid carcinoma | Female | <65 | I/II | Unspecific | Paclitaxel | SD |
| MAPRE2 | SNV | Missense_Mutation | c.465N>T | p.Lys155Asn | p.K155N | Q15555 | protein_coding | deleterious(0) | probably_damaging(0.998) | TCGA-D1-A17Q-01 | Endometrium | uterine corpus endometrioid carcinoma | Female | <65 | I/II | Unknown | Unknown | SD | |
| MAPRE2 | SNV | Missense_Mutation | novel | c.604A>G | p.Thr202Ala | p.T202A | Q15555 | protein_coding | tolerated(0.29) | benign(0.264) | TCGA-E6-A2P9-01 | Endometrium | uterine corpus endometrioid carcinoma | Female | >=65 | I/II | Unknown | Unknown | SD |
| Page: 1 2 3 |
Top |
Related drugs of malignant transformation related genes |
| Identification of chemicals and drugs interact with genes involved in malignant transfromation |
| (DGIdb 4.0) |
| Entrez ID | Symbol | Category | Interaction Types | Drug Claim Name | Drug Name | PMIDs |
| Page: 1 |

Copyright 2023-Present -The University of Texas Health Science Center at Houston |