
|
|||||
|
 | |
| |
| |
| |
| |
| |
|
Gene: MAN2C1 |
Gene summary for MAN2C1 |
| Gene information | Species | Human | Gene symbol | MAN2C1 | Gene ID | 4123 |
| Gene name | mannosidase alpha class 2C member 1 | |
| Gene Alias | MAN6A8 | |
| Cytomap | 15q24.2 | |
| Gene Type | protein-coding | GO ID | GO:0005975 | UniProtAcc | Q9NTJ4 |
Top |
Malignant transformation analysis |
| Identification of the aberrant gene expression in precancerous and cancerous lesions by comparing the gene expression of stem-like cells in diseased tissues with normal stem cells |
| Entrez ID | Symbol | Replicates | Species | Organ | Tissue | Adj P-value | Log2FC | Malignancy |
| 4123 | MAN2C1 | P62T-E | Human | Esophagus | ESCC | 1.28e-11 | 1.74e-01 | 0.1302 |
| 4123 | MAN2C1 | P65T-E | Human | Esophagus | ESCC | 2.56e-07 | 1.40e-01 | 0.0978 |
| 4123 | MAN2C1 | P74T-E | Human | Esophagus | ESCC | 9.85e-05 | 1.27e-01 | 0.1479 |
| 4123 | MAN2C1 | P75T-E | Human | Esophagus | ESCC | 2.59e-10 | 1.73e-01 | 0.1125 |
| 4123 | MAN2C1 | P76T-E | Human | Esophagus | ESCC | 3.04e-07 | 1.14e-01 | 0.1207 |
| 4123 | MAN2C1 | P79T-E | Human | Esophagus | ESCC | 2.51e-07 | 8.55e-02 | 0.1154 |
| 4123 | MAN2C1 | P80T-E | Human | Esophagus | ESCC | 1.52e-11 | 2.79e-01 | 0.155 |
| 4123 | MAN2C1 | P82T-E | Human | Esophagus | ESCC | 3.05e-04 | 2.62e-01 | 0.1072 |
| 4123 | MAN2C1 | P83T-E | Human | Esophagus | ESCC | 5.27e-04 | 1.13e-01 | 0.1738 |
| 4123 | MAN2C1 | P104T-E | Human | Esophagus | ESCC | 2.45e-10 | 3.81e-01 | 0.0931 |
| 4123 | MAN2C1 | P107T-E | Human | Esophagus | ESCC | 3.41e-16 | 3.07e-01 | 0.171 |
| 4123 | MAN2C1 | P127T-E | Human | Esophagus | ESCC | 2.69e-06 | 7.00e-02 | 0.0826 |
| 4123 | MAN2C1 | P128T-E | Human | Esophagus | ESCC | 7.08e-18 | 5.71e-01 | 0.1241 |
| 4123 | MAN2C1 | P130T-E | Human | Esophagus | ESCC | 2.60e-24 | 3.64e-01 | 0.1676 |
| 4123 | MAN2C1 | HCC1_Meng | Human | Liver | HCC | 3.24e-37 | 3.93e-02 | 0.0246 |
| 4123 | MAN2C1 | HCC2_Meng | Human | Liver | HCC | 5.46e-08 | 8.30e-02 | 0.0107 |
| 4123 | MAN2C1 | HCC1 | Human | Liver | HCC | 3.34e-06 | 4.15e+00 | 0.5336 |
| 4123 | MAN2C1 | HCC2 | Human | Liver | HCC | 1.28e-09 | 4.22e+00 | 0.5341 |
| 4123 | MAN2C1 | S014 | Human | Liver | HCC | 5.36e-09 | 4.79e-01 | 0.2254 |
| 4123 | MAN2C1 | S015 | Human | Liver | HCC | 8.78e-11 | 6.31e-01 | 0.2375 |
| Page: 1 2 3 4 5 |
| Tissue | Expression Dynamics | Abbreviation |
| Esophagus | 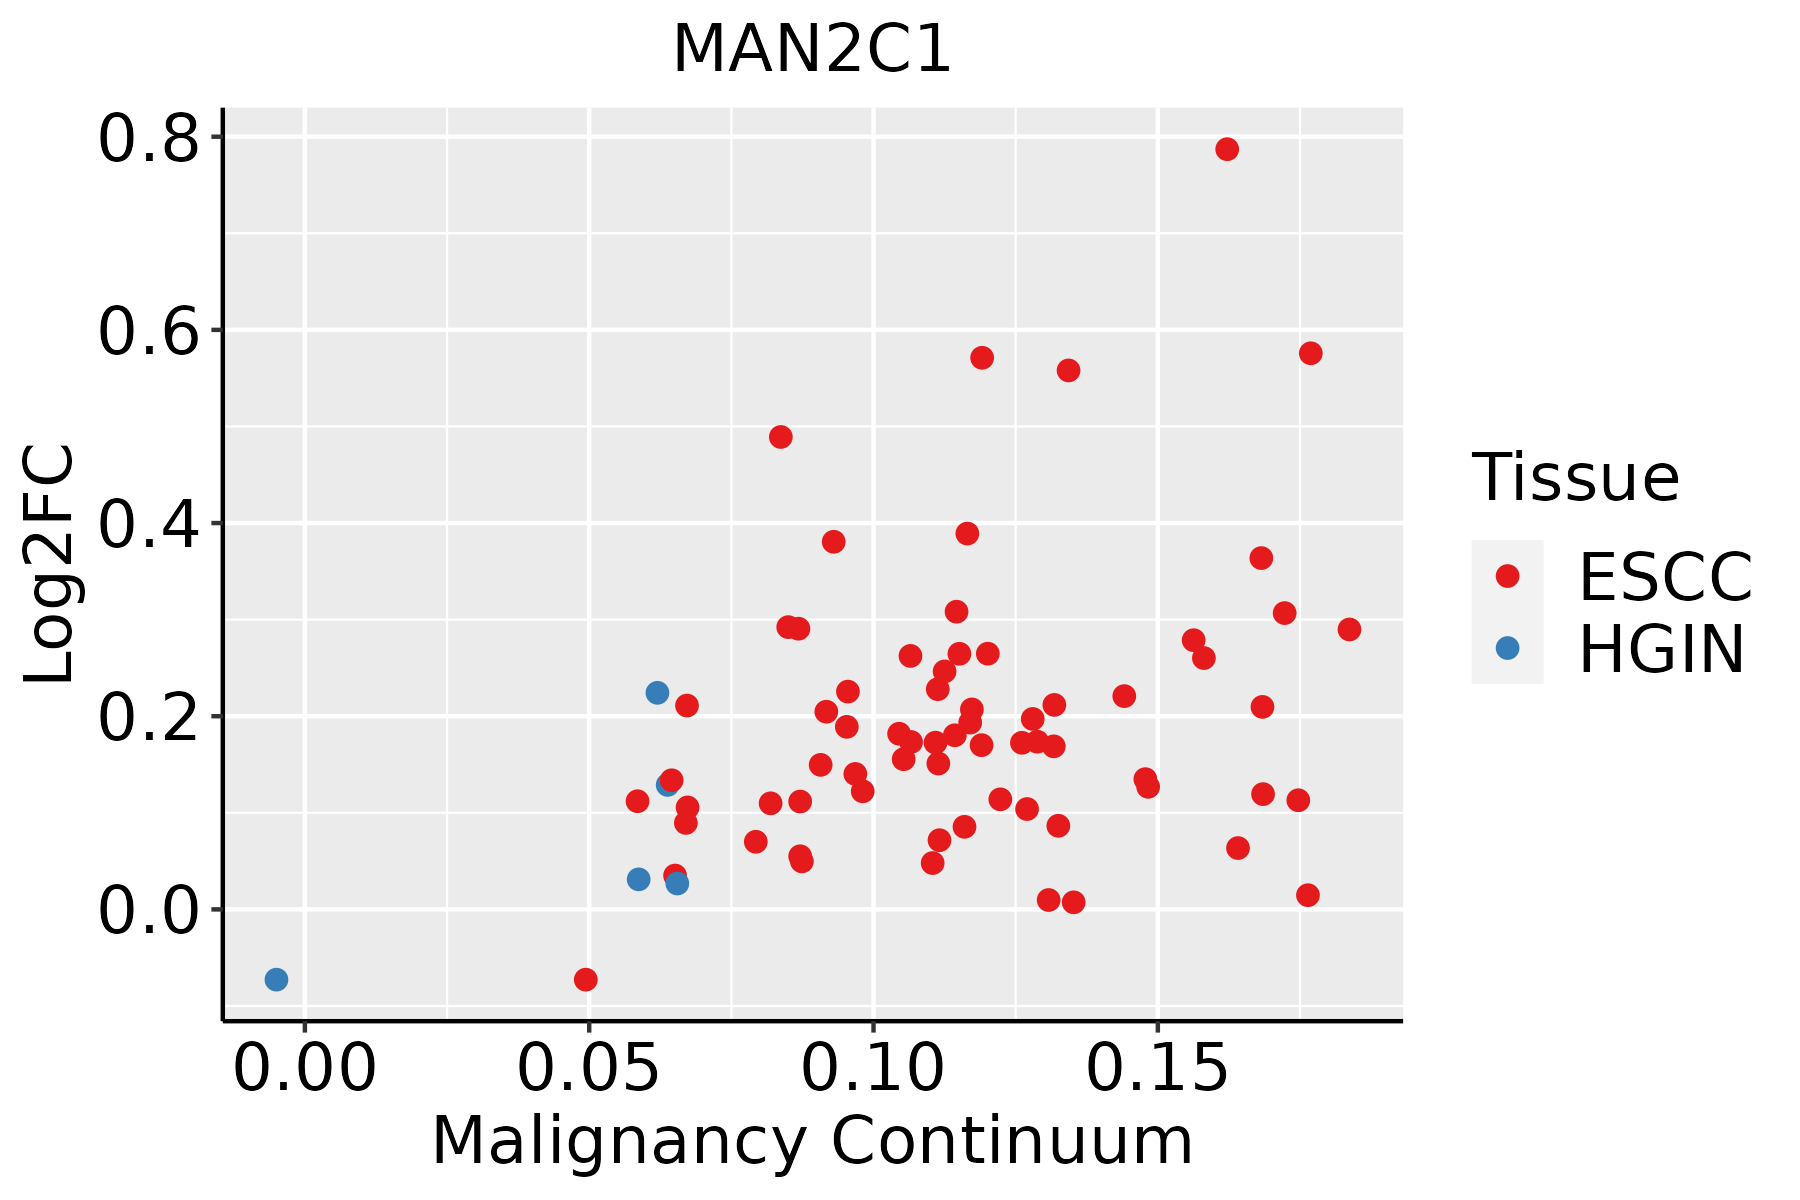 | ESCC: Esophageal squamous cell carcinoma |
| HGIN: High-grade intraepithelial neoplasias | ||
| LGIN: Low-grade intraepithelial neoplasias | ||
| Liver | 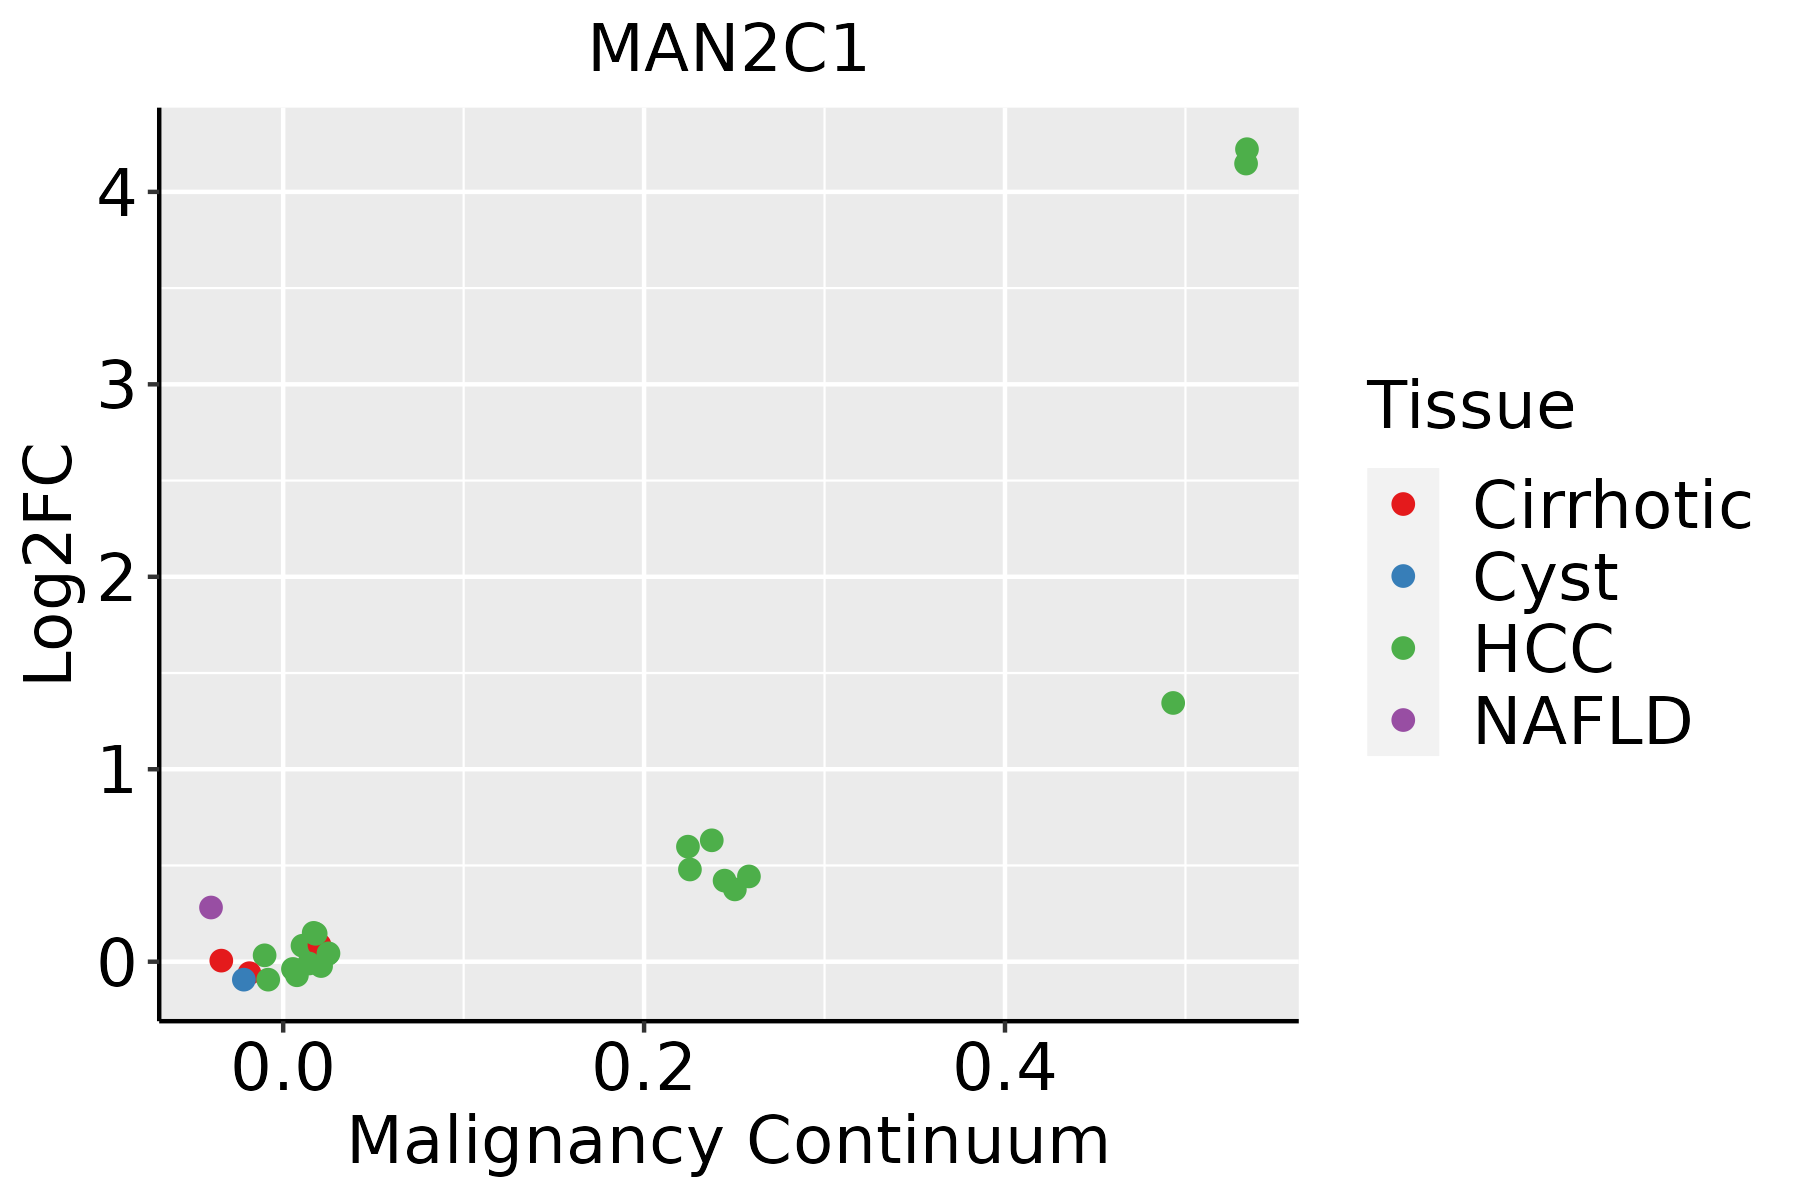 | HCC: Hepatocellular carcinoma |
| NAFLD: Non-alcoholic fatty liver disease | ||
| Oral Cavity | 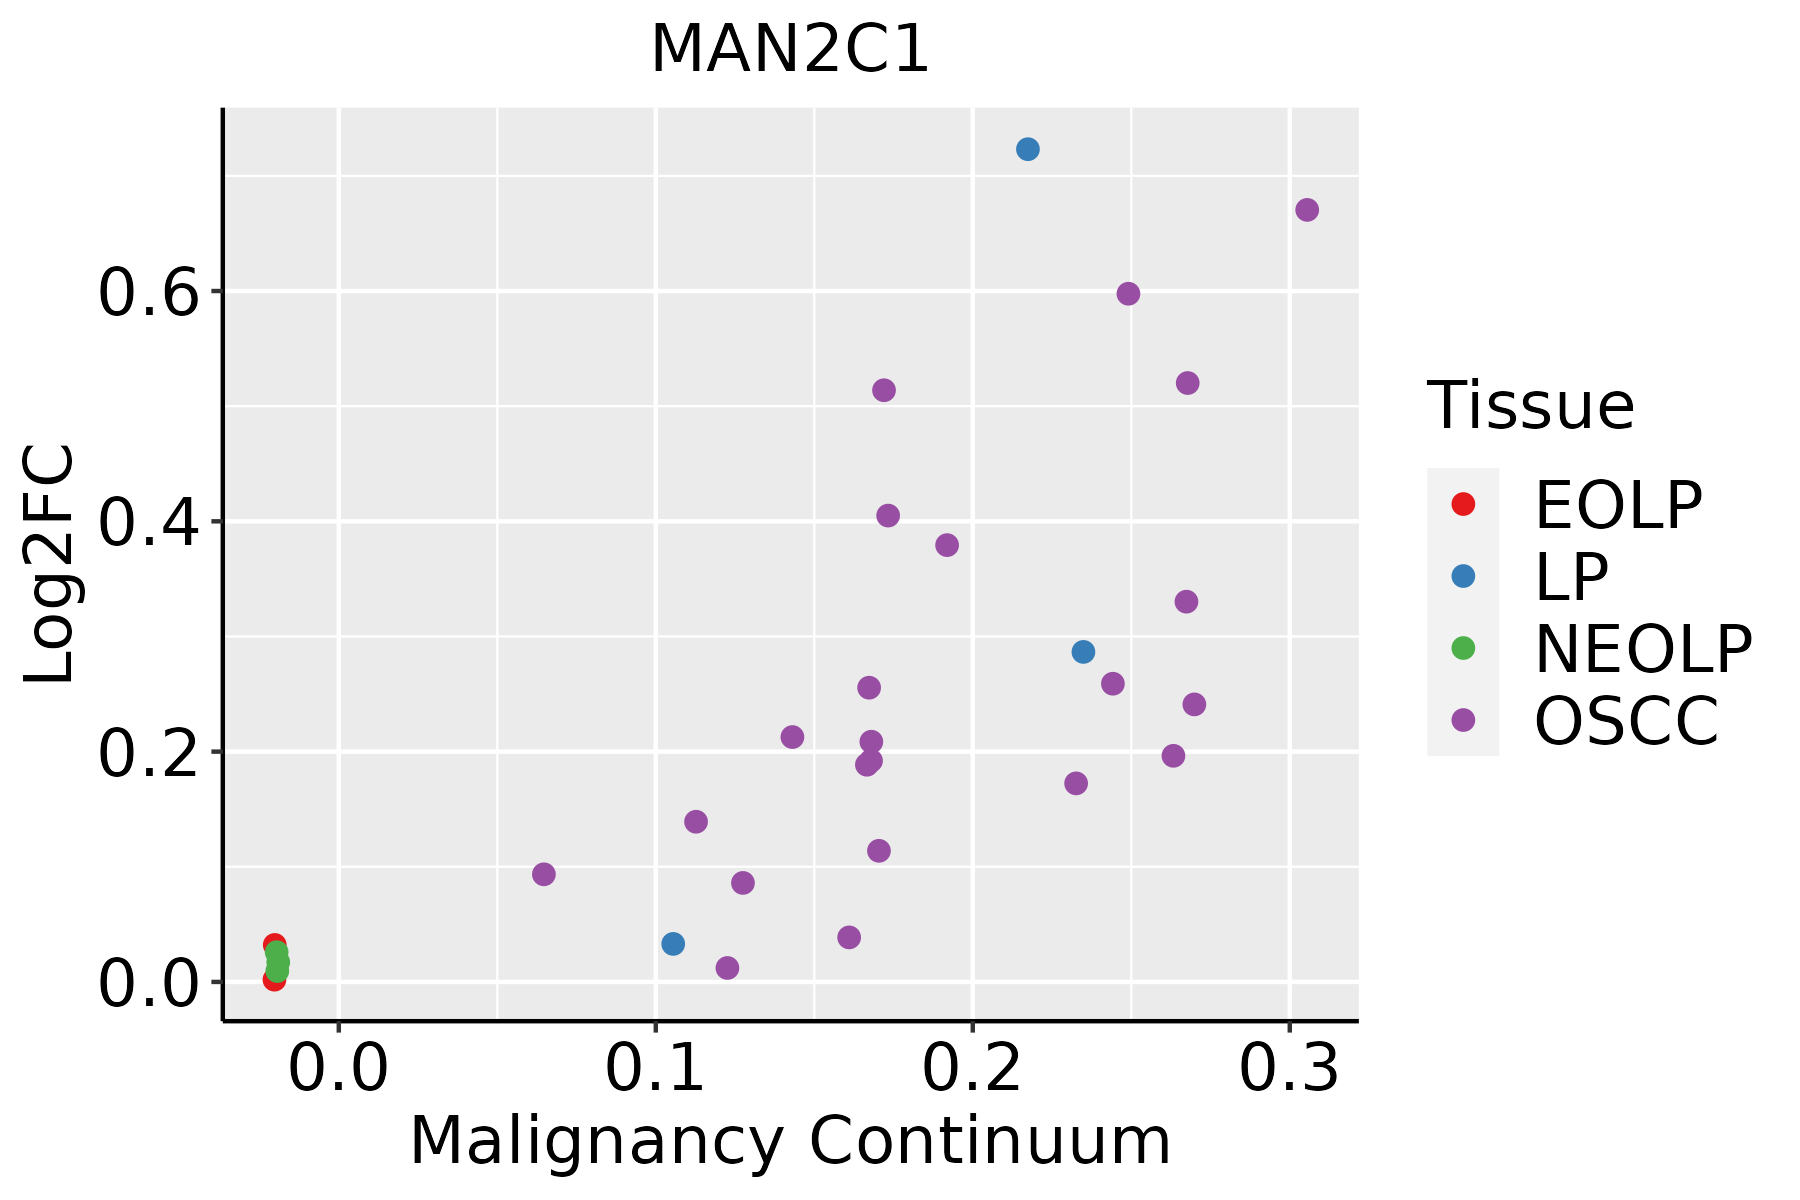 | EOLP: Erosive Oral lichen planus |
| LP: leukoplakia | ||
| NEOLP: Non-erosive oral lichen planus | ||
| OSCC: Oral squamous cell carcinoma | ||
| Thyroid | 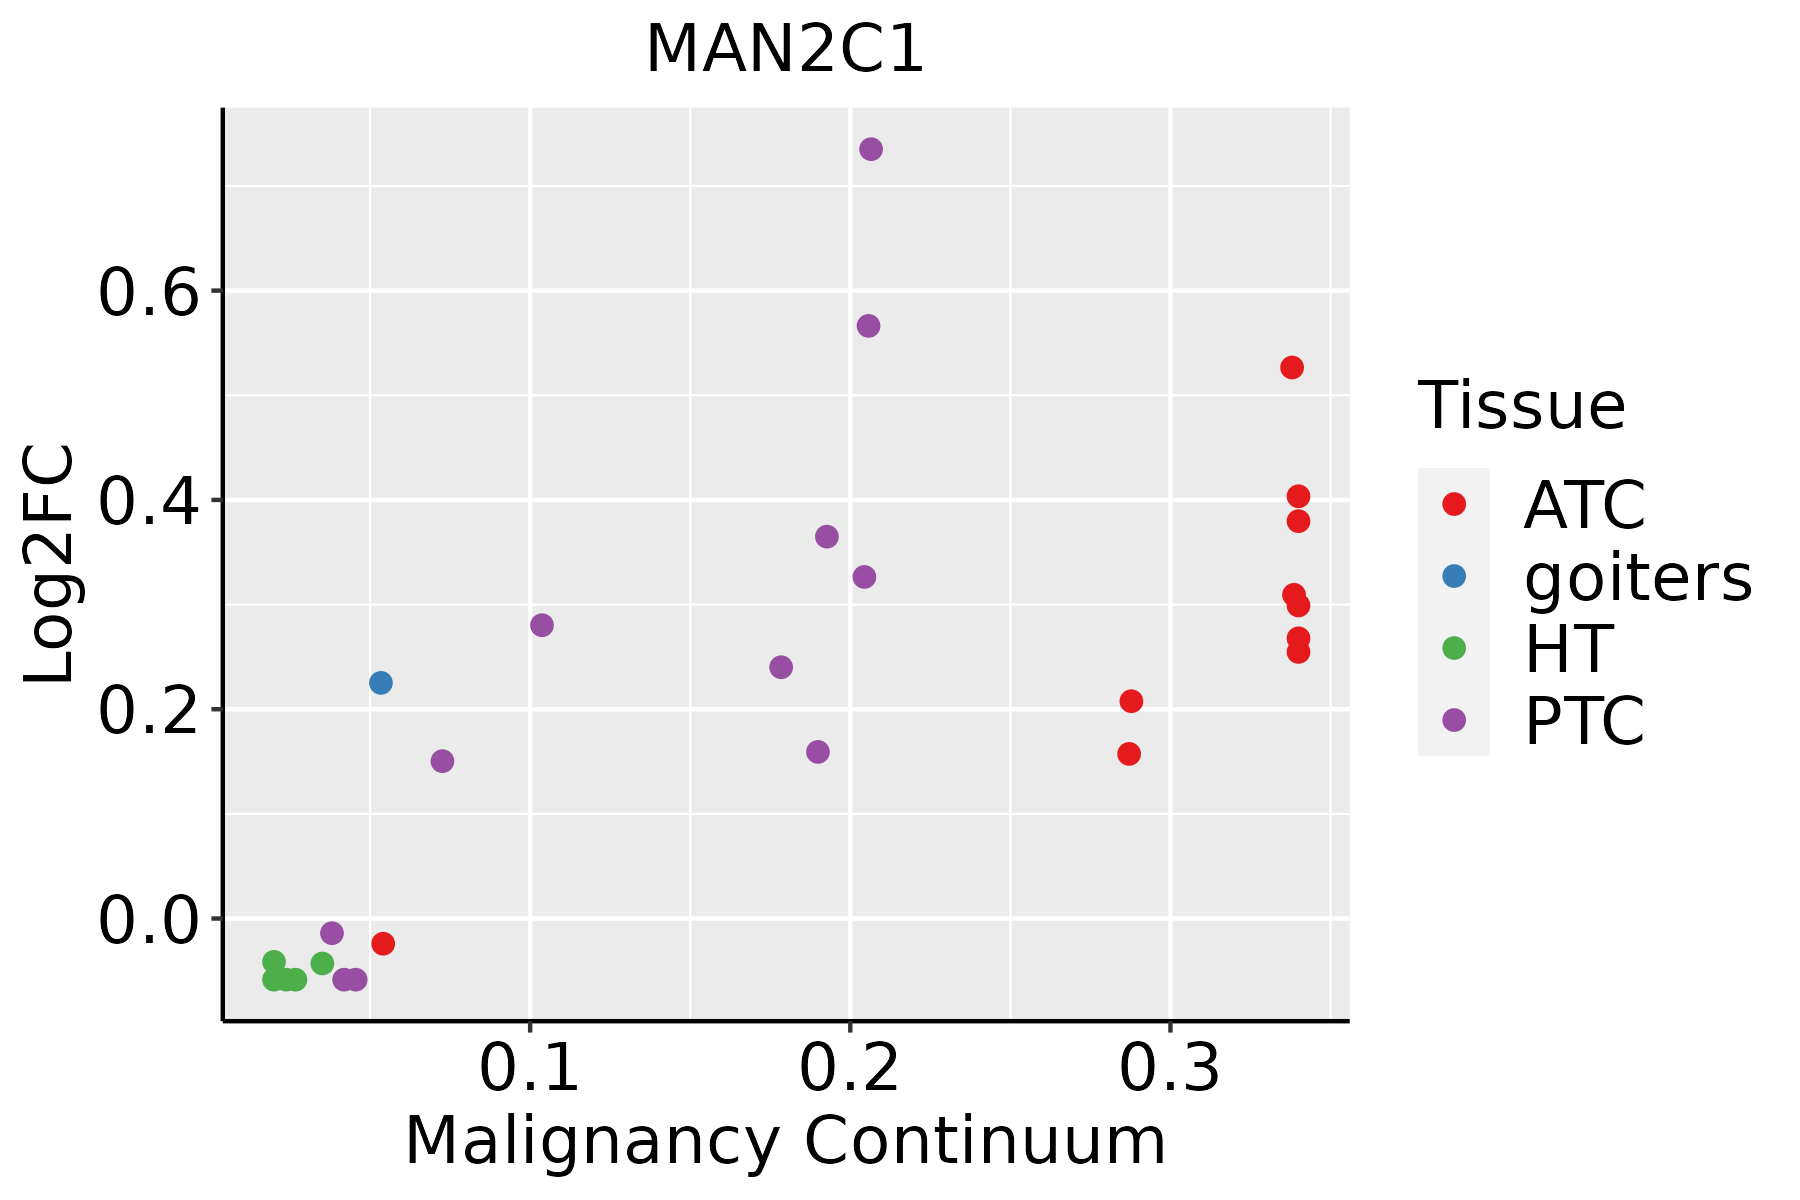 | ATC: Anaplastic thyroid cancer |
| HT: Hashimoto's thyroiditis | ||
| PTC: Papillary thyroid cancer |
| ∗log2FC in expression of this searched gene in stem-like cells from each diseased tissue sample relative to stem-like cells in normal samples in each tissue plotted against the malignancy continuum. Samples are colored based on if they are from different disease stage. |
Top |
Malignant transformation related pathway analysis |
| Find out the enriched GO biological processes and KEGG pathways involved in transition from healthy to precancer to cancer |
| Tissue | Disease Stage | Enriched GO biological Processes |
| Colorectum | AD |  |
| Colorectum | SER |  |
| Colorectum | MSS |  |
| Colorectum | MSI-H |  |
| Colorectum | FAP |  |
| ∗Top 15 enriched GO BP terms are showed in the bar plot of each disease state in each tissue. Each row represents a significant GO biological process which is colored according to the -log10(p.adjust). |
| Page: 1 2 3 4 5 6 7 8 9 |
| GO ID | Tissue | Disease Stage | Description | Gene Ratio | Bg Ratio | pvalue | p.adjust | Count |
| GO:00059969 | Esophagus | ESCC | monosaccharide metabolic process | 159/8552 | 257/18723 | 1.11e-07 | 1.81e-06 | 159 |
| GO:00193189 | Esophagus | ESCC | hexose metabolic process | 147/8552 | 237/18723 | 2.63e-07 | 3.94e-06 | 147 |
| GO:001605216 | Esophagus | ESCC | carbohydrate catabolic process | 91/8552 | 154/18723 | 5.39e-04 | 2.97e-03 | 91 |
| GO:000599621 | Liver | HCC | monosaccharide metabolic process | 167/7958 | 257/18723 | 2.31e-13 | 1.25e-11 | 167 |
| GO:001931821 | Liver | HCC | hexose metabolic process | 155/7958 | 237/18723 | 7.63e-13 | 3.90e-11 | 155 |
| GO:001605222 | Liver | HCC | carbohydrate catabolic process | 99/7958 | 154/18723 | 3.79e-08 | 8.30e-07 | 99 |
| GO:00059968 | Oral cavity | OSCC | monosaccharide metabolic process | 129/7305 | 257/18723 | 1.63e-04 | 1.13e-03 | 129 |
| GO:00193188 | Oral cavity | OSCC | hexose metabolic process | 118/7305 | 237/18723 | 4.53e-04 | 2.73e-03 | 118 |
| GO:001605210 | Oral cavity | OSCC | carbohydrate catabolic process | 76/7305 | 154/18723 | 5.67e-03 | 2.18e-02 | 76 |
| GO:000599613 | Oral cavity | LP | monosaccharide metabolic process | 86/4623 | 257/18723 | 9.13e-04 | 7.79e-03 | 86 |
| GO:001931813 | Oral cavity | LP | hexose metabolic process | 78/4623 | 237/18723 | 2.55e-03 | 1.80e-02 | 78 |
| GO:001605215 | Oral cavity | LP | carbohydrate catabolic process | 53/4623 | 154/18723 | 4.22e-03 | 2.70e-02 | 53 |
| GO:001931810 | Thyroid | PTC | hexose metabolic process | 108/5968 | 237/18723 | 6.42e-06 | 7.65e-05 | 108 |
| GO:000599614 | Thyroid | PTC | monosaccharide metabolic process | 115/5968 | 257/18723 | 9.36e-06 | 1.05e-04 | 115 |
| GO:001605218 | Thyroid | PTC | carbohydrate catabolic process | 70/5968 | 154/18723 | 2.77e-04 | 1.97e-03 | 70 |
| GO:001931814 | Thyroid | ATC | hexose metabolic process | 111/6293 | 237/18723 | 1.51e-05 | 1.41e-04 | 111 |
| GO:000599615 | Thyroid | ATC | monosaccharide metabolic process | 118/6293 | 257/18723 | 2.56e-05 | 2.20e-04 | 118 |
| GO:001605224 | Thyroid | ATC | carbohydrate catabolic process | 71/6293 | 154/18723 | 8.33e-04 | 4.57e-03 | 71 |
| Page: 1 |
| Pathway ID | Tissue | Disease Stage | Description | Gene Ratio | Bg Ratio | pvalue | p.adjust | qvalue | Count |
| hsa00511 | Liver | HCC | Other glycan degradation | 15/4020 | 18/8465 | 1.96e-03 | 6.91e-03 | 3.84e-03 | 15 |
| hsa005111 | Liver | HCC | Other glycan degradation | 15/4020 | 18/8465 | 1.96e-03 | 6.91e-03 | 3.84e-03 | 15 |
| Page: 1 |
Top |
Cell-cell communication analysis |
| Identification of potential cell-cell interactions between two cell types and their ligand-receptor pairs for different disease states |
| Ligand | Receptor | LRpair | Pathway | Tissue | Disease Stage |
| Page: 1 |
Top |
Single-cell gene regulatory network inference analysis |
| Find out the significant the regulons (TFs) and the target genes of each regulon across cell types for different disease states |
| TF | Cell Type | Tissue | Disease Stage | Target Gene | RSS | Regulon Activity |
| ∗The dot plots of a searched regulon are shown for all cell subpopulations in each disease state of each tissue based on the regulon specific score inferred using pySCENIC and by calculating the average expression. |
| Page: 1 |
Top |
Somatic mutation of malignant transformation related genes |
| Annotation of somatic variants for genes involved in malignant transformation |
| Hugo Symbol | Variant Class | Variant Classification | dbSNP RS | HGVSc | HGVSp | HGVSp Short | SWISSPROT | BIOTYPE | SIFT | PolyPhen | Tumor Sample Barcode | Tissue | Histology | Sex | Age | Stage | Therapy Types | Drugs | Outcome |
| MAN2C1 | SNV | Missense_Mutation | c.1237N>A | p.Glu413Lys | p.E413K | Q9NTJ4 | protein_coding | tolerated(0.09) | benign(0.209) | TCGA-A2-A0D2-01 | Breast | breast invasive carcinoma | Female | <65 | I/II | Chemotherapy | adriamycin | SD | |
| MAN2C1 | SNV | Missense_Mutation | c.441A>T | p.Glu147Asp | p.E147D | Q9NTJ4 | protein_coding | deleterious(0) | probably_damaging(1) | TCGA-A8-A09Z-01 | Breast | breast invasive carcinoma | Female | >=65 | I/II | Unknown | Unknown | SD | |
| MAN2C1 | SNV | Missense_Mutation | novel | c.1855N>G | p.Pro619Ala | p.P619A | Q9NTJ4 | protein_coding | tolerated(0.5) | benign(0.01) | TCGA-AR-A2LR-01 | Breast | breast invasive carcinoma | Female | <65 | I/II | Chemotherapy | adriamycin | SD |
| MAN2C1 | insertion | Frame_Shift_Ins | novel | c.709_710insAGCAGGCAGAGTTGGTGTCACAA | p.Leu237GlnfsTer45 | p.L237Qfs*45 | Q9NTJ4 | protein_coding | TCGA-AO-A0JJ-01 | Breast | breast invasive carcinoma | Female | <65 | I/II | Chemotherapy | cyclophospamide | SD | ||
| MAN2C1 | SNV | Missense_Mutation | c.3149N>C | p.Leu1050Pro | p.L1050P | Q9NTJ4 | protein_coding | deleterious(0) | probably_damaging(0.999) | TCGA-A6-6781-01 | Colorectum | colon adenocarcinoma | Male | <65 | III/IV | Chemotherapy | oxaliplatin | SD | |
| MAN2C1 | SNV | Missense_Mutation | rs752353552 | c.2521N>A | p.Ala841Thr | p.A841T | Q9NTJ4 | protein_coding | deleterious(0) | probably_damaging(0.976) | TCGA-AA-3715-01 | Colorectum | colon adenocarcinoma | Male | >=65 | I/II | Unknown | Unknown | PD |
| MAN2C1 | SNV | Missense_Mutation | c.1171C>T | p.Arg391Cys | p.R391C | Q9NTJ4 | protein_coding | tolerated(0.06) | benign(0.046) | TCGA-AA-3864-01 | Colorectum | colon adenocarcinoma | Male | >=65 | I/II | Unknown | Unknown | SD | |
| MAN2C1 | SNV | Missense_Mutation | novel | c.68N>T | p.Pro23Leu | p.P23L | Q9NTJ4 | protein_coding | tolerated(0.16) | possibly_damaging(0.739) | TCGA-AA-3877-01 | Colorectum | colon adenocarcinoma | Female | >=65 | I/II | Unknown | Unknown | SD |
| MAN2C1 | SNV | Missense_Mutation | c.3071N>G | p.Asp1024Gly | p.D1024G | Q9NTJ4 | protein_coding | tolerated(0.2) | benign(0.343) | TCGA-AA-A01R-01 | Colorectum | colon adenocarcinoma | Male | <65 | III/IV | Chemotherapy | 5-fluorouracil | PD | |
| MAN2C1 | SNV | Missense_Mutation | rs199696370 | c.962N>T | p.Ala321Val | p.A321V | Q9NTJ4 | protein_coding | tolerated(1) | benign(0.006) | TCGA-AD-6895-01 | Colorectum | colon adenocarcinoma | Male | >=65 | III/IV | Unknown | Unknown | SD |
| Page: 1 2 3 4 5 6 7 8 9 10 |
Top |
Related drugs of malignant transformation related genes |
| Identification of chemicals and drugs interact with genes involved in malignant transfromation |
| (DGIdb 4.0) |
| Entrez ID | Symbol | Category | Interaction Types | Drug Claim Name | Drug Name | PMIDs |
| 4123 | MAN2C1 | DRUGGABLE GENOME | M-0011 |
| Page: 1 |

Copyright 2023-Present -The University of Texas Health Science Center at Houston |