
|
|||||
|
 | |
| |
| |
| |
| |
| |
|
Gene: LYPD3 |
Gene summary for LYPD3 |
| Gene information | Species | Human | Gene symbol | LYPD3 | Gene ID | 27076 |
| Gene name | LY6/PLAUR domain containing 3 | |
| Gene Alias | C4.4A | |
| Cytomap | 19q13.31 | |
| Gene Type | protein-coding | GO ID | GO:0007155 | UniProtAcc | B2RBR3 |
Top |
Malignant transformation analysis |
| Identification of the aberrant gene expression in precancerous and cancerous lesions by comparing the gene expression of stem-like cells in diseased tissues with normal stem cells |
| Entrez ID | Symbol | Replicates | Species | Organ | Tissue | Adj P-value | Log2FC | Malignancy |
| 27076 | LYPD3 | P39T-E | Human | Esophagus | ESCC | 3.59e-20 | 1.04e+00 | 0.0894 |
| 27076 | LYPD3 | P40T-E | Human | Esophagus | ESCC | 1.25e-14 | 9.18e-01 | 0.109 |
| 27076 | LYPD3 | P42T-E | Human | Esophagus | ESCC | 1.01e-13 | 1.25e+00 | 0.1175 |
| 27076 | LYPD3 | P44T-E | Human | Esophagus | ESCC | 9.32e-07 | 9.04e-01 | 0.1096 |
| 27076 | LYPD3 | P47T-E | Human | Esophagus | ESCC | 8.89e-33 | 9.79e-01 | 0.1067 |
| 27076 | LYPD3 | P48T-E | Human | Esophagus | ESCC | 6.74e-23 | 8.84e-01 | 0.0959 |
| 27076 | LYPD3 | P49T-E | Human | Esophagus | ESCC | 8.09e-07 | 2.13e+00 | 0.1768 |
| 27076 | LYPD3 | P52T-E | Human | Esophagus | ESCC | 1.17e-30 | 1.81e+00 | 0.1555 |
| 27076 | LYPD3 | P54T-E | Human | Esophagus | ESCC | 1.20e-41 | 1.69e+00 | 0.0975 |
| 27076 | LYPD3 | P57T-E | Human | Esophagus | ESCC | 2.75e-03 | 5.48e-01 | 0.0926 |
| 27076 | LYPD3 | P61T-E | Human | Esophagus | ESCC | 8.74e-14 | 7.23e-01 | 0.099 |
| 27076 | LYPD3 | P62T-E | Human | Esophagus | ESCC | 9.71e-38 | 1.35e+00 | 0.1302 |
| 27076 | LYPD3 | P65T-E | Human | Esophagus | ESCC | 9.40e-23 | 8.28e-01 | 0.0978 |
| 27076 | LYPD3 | P74T-E | Human | Esophagus | ESCC | 2.31e-22 | 1.16e+00 | 0.1479 |
| 27076 | LYPD3 | P75T-E | Human | Esophagus | ESCC | 2.87e-07 | 4.65e-01 | 0.1125 |
| 27076 | LYPD3 | P76T-E | Human | Esophagus | ESCC | 1.02e-07 | 4.85e-01 | 0.1207 |
| 27076 | LYPD3 | P79T-E | Human | Esophagus | ESCC | 4.04e-03 | 4.35e-01 | 0.1154 |
| 27076 | LYPD3 | P82T-E | Human | Esophagus | ESCC | 4.08e-03 | 7.23e-01 | 0.1072 |
| 27076 | LYPD3 | P83T-E | Human | Esophagus | ESCC | 2.73e-46 | 2.33e+00 | 0.1738 |
| 27076 | LYPD3 | P84T-E | Human | Esophagus | ESCC | 5.29e-15 | 1.48e+00 | 0.0933 |
| Page: 1 2 3 4 5 6 |
| Tissue | Expression Dynamics | Abbreviation |
| Cervix | 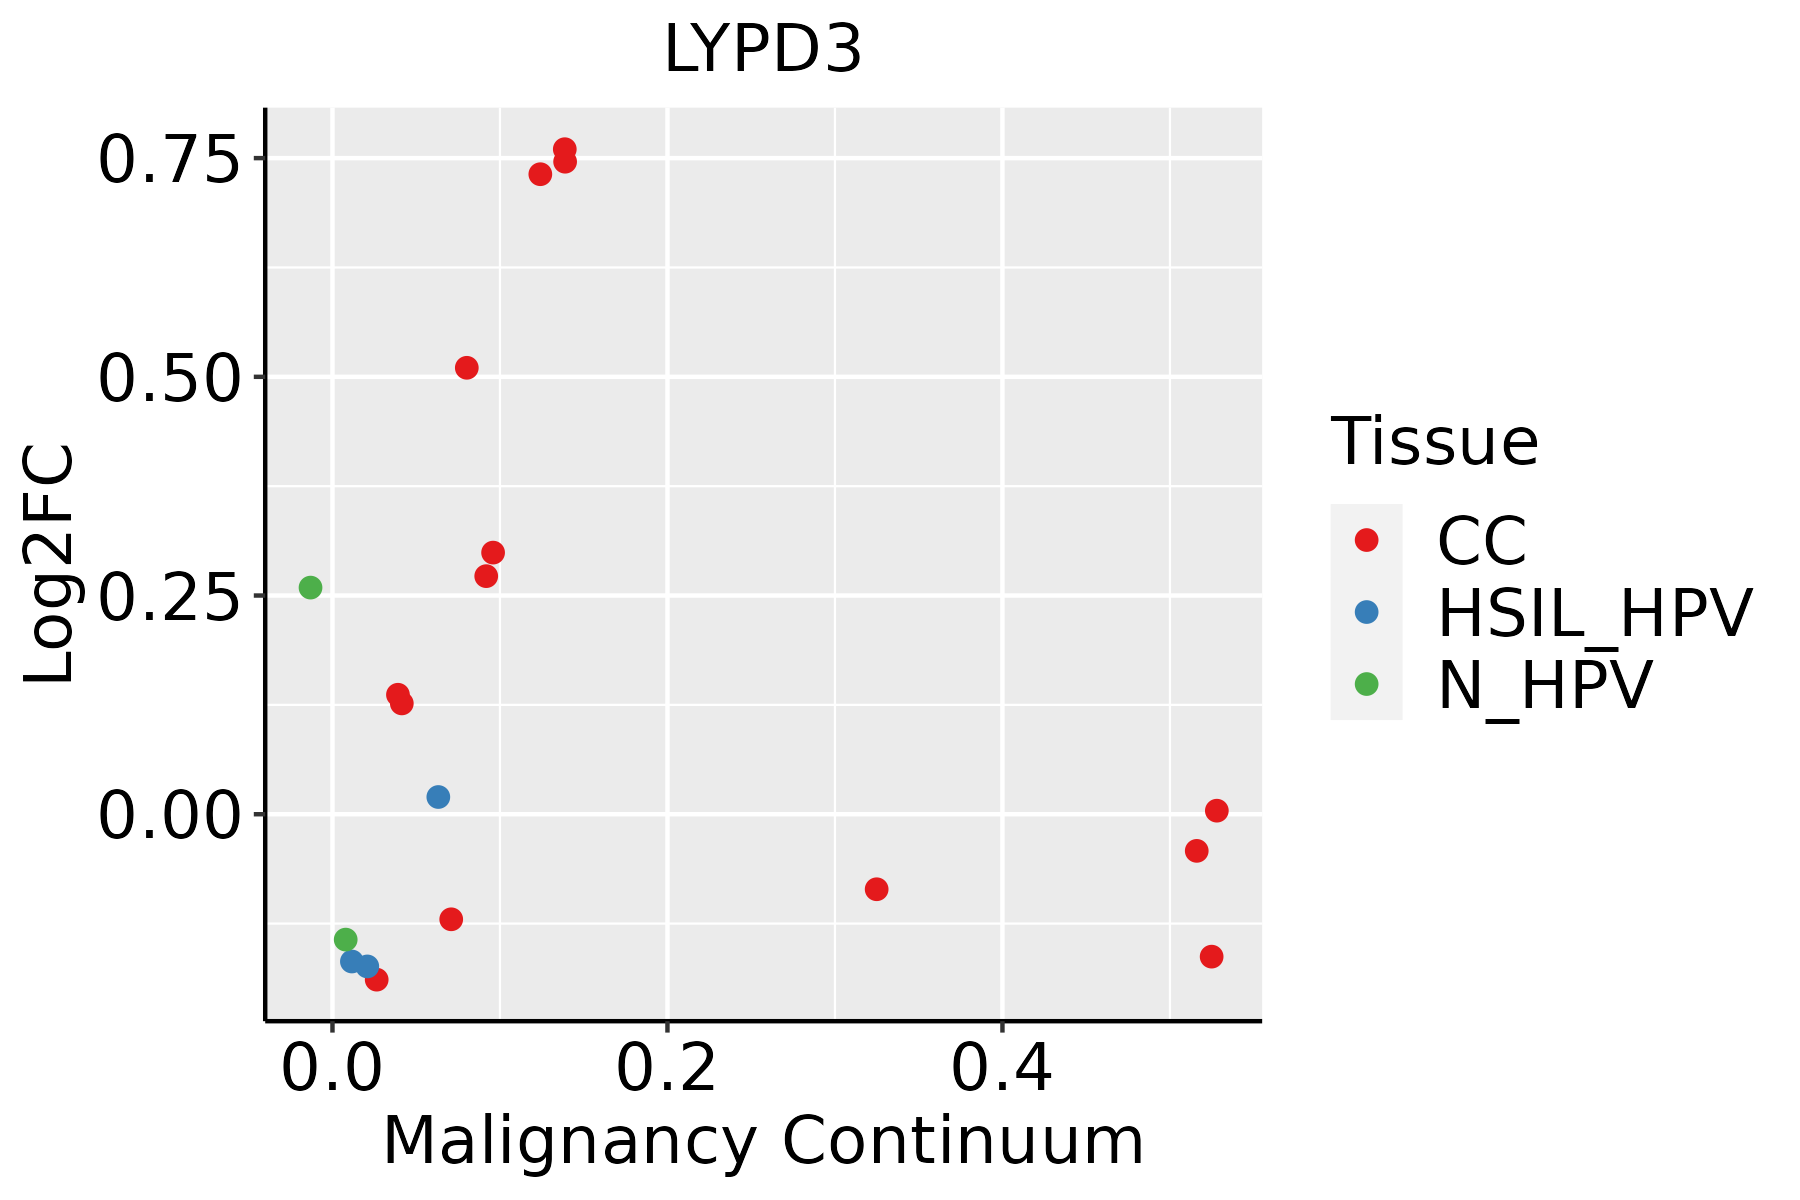 | CC: Cervix cancer |
| HSIL_HPV: HPV-infected high-grade squamous intraepithelial lesions | ||
| N_HPV: HPV-infected normal cervix | ||
| Esophagus | 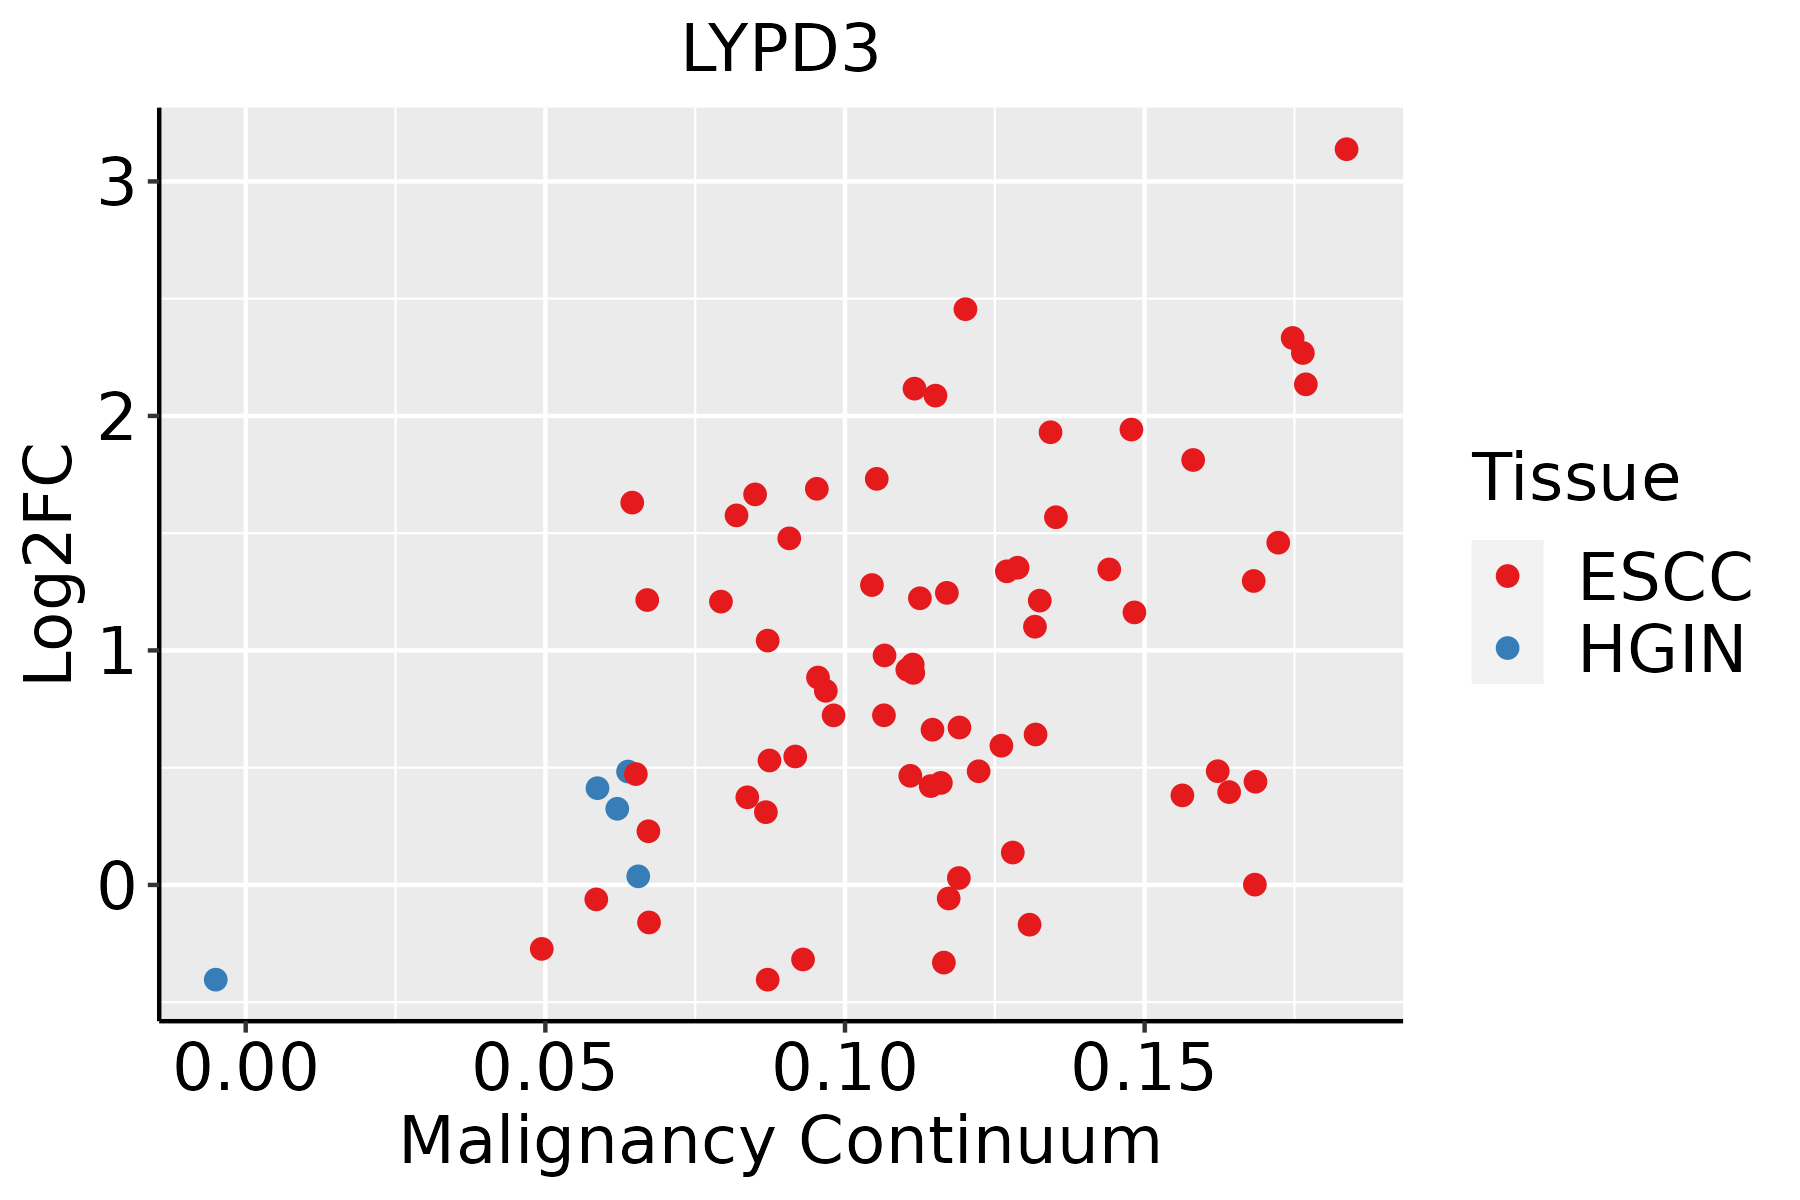 | ESCC: Esophageal squamous cell carcinoma |
| HGIN: High-grade intraepithelial neoplasias | ||
| LGIN: Low-grade intraepithelial neoplasias | ||
| Oral Cavity | 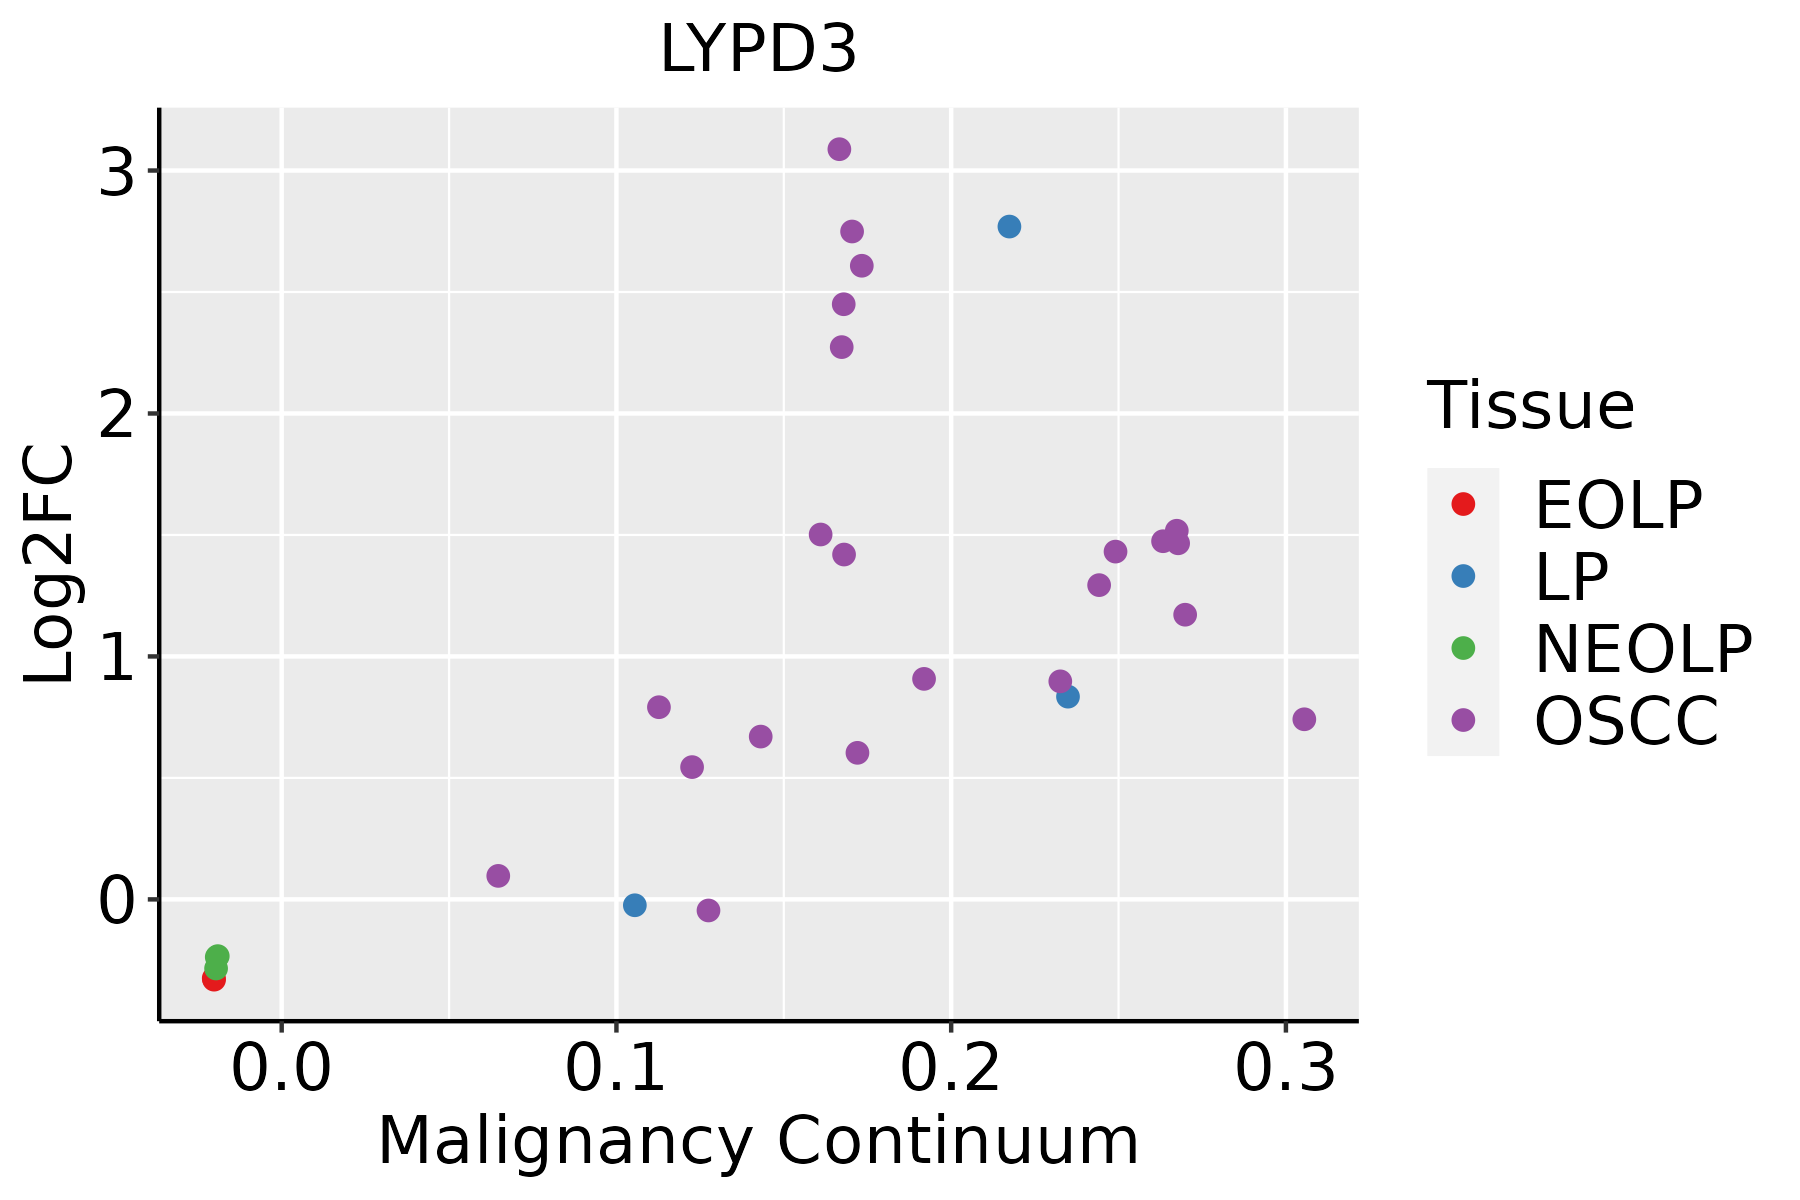 | EOLP: Erosive Oral lichen planus |
| LP: leukoplakia | ||
| NEOLP: Non-erosive oral lichen planus | ||
| OSCC: Oral squamous cell carcinoma | ||
| Skin |  | AK: Actinic keratosis |
| cSCC: Cutaneous squamous cell carcinoma | ||
| SCCIS:squamous cell carcinoma in situ |
| ∗log2FC in expression of this searched gene in stem-like cells from each diseased tissue sample relative to stem-like cells in normal samples in each tissue plotted against the malignancy continuum. Samples are colored based on if they are from different disease stage. |
Top |
Malignant transformation related pathway analysis |
| Find out the enriched GO biological processes and KEGG pathways involved in transition from healthy to precancer to cancer |
| Tissue | Disease Stage | Enriched GO biological Processes |
| Colorectum | AD |  |
| Colorectum | SER |  |
| Colorectum | MSS |  |
| Colorectum | MSI-H |  |
| Colorectum | FAP |  |
| ∗Top 15 enriched GO BP terms are showed in the bar plot of each disease state in each tissue. Each row represents a significant GO biological process which is colored according to the -log10(p.adjust). |
| Page: 1 2 3 4 5 6 7 8 9 |
| GO ID | Tissue | Disease Stage | Description | Gene Ratio | Bg Ratio | pvalue | p.adjust | Count |
| GO:00315898 | Cervix | CC | cell-substrate adhesion | 96/2311 | 363/18723 | 1.48e-13 | 8.85e-11 | 96 |
| GO:00071608 | Cervix | CC | cell-matrix adhesion | 60/2311 | 233/18723 | 1.58e-08 | 1.23e-06 | 60 |
| GO:003158924 | Cervix | N_HPV | cell-substrate adhesion | 23/534 | 363/18723 | 3.24e-04 | 4.84e-03 | 23 |
| GO:000716013 | Cervix | N_HPV | cell-matrix adhesion | 14/534 | 233/18723 | 7.21e-03 | 4.74e-02 | 14 |
| GO:003158919 | Esophagus | ESCC | cell-substrate adhesion | 221/8552 | 363/18723 | 3.06e-09 | 6.62e-08 | 221 |
| GO:000716018 | Esophagus | ESCC | cell-matrix adhesion | 141/8552 | 233/18723 | 3.33e-06 | 3.71e-05 | 141 |
| GO:003158917 | Oral cavity | OSCC | cell-substrate adhesion | 193/7305 | 363/18723 | 2.48e-08 | 4.82e-07 | 193 |
| GO:000716016 | Oral cavity | OSCC | cell-matrix adhesion | 125/7305 | 233/18723 | 3.76e-06 | 4.45e-05 | 125 |
| GO:003158918 | Oral cavity | LP | cell-substrate adhesion | 111/4623 | 363/18723 | 5.94e-03 | 3.53e-02 | 111 |
| GO:003158925 | Oral cavity | EOLP | cell-substrate adhesion | 84/2218 | 363/18723 | 8.71e-10 | 6.29e-08 | 84 |
| GO:000716017 | Oral cavity | EOLP | cell-matrix adhesion | 56/2218 | 233/18723 | 1.44e-07 | 4.68e-06 | 56 |
| GO:003158932 | Oral cavity | NEOLP | cell-substrate adhesion | 93/2005 | 363/18723 | 4.93e-16 | 2.93e-13 | 93 |
| GO:000716023 | Oral cavity | NEOLP | cell-matrix adhesion | 62/2005 | 233/18723 | 6.73e-12 | 1.14e-09 | 62 |
| GO:003158920 | Skin | AK | cell-substrate adhesion | 74/1910 | 363/18723 | 4.40e-09 | 3.30e-07 | 74 |
| GO:000716019 | Skin | AK | cell-matrix adhesion | 53/1910 | 233/18723 | 1.56e-08 | 9.40e-07 | 53 |
| GO:003158926 | Skin | cSCC | cell-substrate adhesion | 130/4864 | 363/18723 | 1.87e-05 | 2.23e-04 | 130 |
| GO:000716024 | Skin | cSCC | cell-matrix adhesion | 85/4864 | 233/18723 | 2.43e-04 | 1.98e-03 | 85 |
| Page: 1 |
| Pathway ID | Tissue | Disease Stage | Description | Gene Ratio | Bg Ratio | pvalue | p.adjust | qvalue | Count |
| Page: 1 |
Top |
Cell-cell communication analysis |
| Identification of potential cell-cell interactions between two cell types and their ligand-receptor pairs for different disease states |
| Ligand | Receptor | LRpair | Pathway | Tissue | Disease Stage |
| Page: 1 |
Top |
Single-cell gene regulatory network inference analysis |
| Find out the significant the regulons (TFs) and the target genes of each regulon across cell types for different disease states |
| TF | Cell Type | Tissue | Disease Stage | Target Gene | RSS | Regulon Activity |
| ∗The dot plots of a searched regulon are shown for all cell subpopulations in each disease state of each tissue based on the regulon specific score inferred using pySCENIC and by calculating the average expression. |
| Page: 1 |
Top |
Somatic mutation of malignant transformation related genes |
| Annotation of somatic variants for genes involved in malignant transformation |
| Hugo Symbol | Variant Class | Variant Classification | dbSNP RS | HGVSc | HGVSp | HGVSp Short | SWISSPROT | BIOTYPE | SIFT | PolyPhen | Tumor Sample Barcode | Tissue | Histology | Sex | Age | Stage | Therapy Types | Drugs | Outcome |
| LYPD3 | SNV | Missense_Mutation | rs745685365 | c.701N>A | p.Arg234Gln | p.R234Q | O95274 | protein_coding | tolerated(0.09) | benign(0.08) | TCGA-AO-A0JC-01 | Breast | breast invasive carcinoma | Female | <65 | I/II | Chemotherapy | fluorouracil | SD |
| LYPD3 | deletion | Frame_Shift_Del | novel | c.930delN | p.Gln311SerfsTer93 | p.Q311Sfs*93 | O95274 | protein_coding | TCGA-EW-A2FV-01 | Breast | breast invasive carcinoma | Female | <65 | III/IV | Chemotherapy | docetaxel | SD | ||
| LYPD3 | SNV | Missense_Mutation | rs754129433 | c.193G>A | p.Val65Met | p.V65M | O95274 | protein_coding | deleterious(0.02) | probably_damaging(0.998) | TCGA-C5-A1M6-01 | Cervix | cervical & endocervical cancer | Female | <65 | I/II | Chemotherapy | cisplatin | PD |
| LYPD3 | SNV | Missense_Mutation | c.752N>T | p.Ser251Leu | p.S251L | O95274 | protein_coding | tolerated(0.24) | benign(0.007) | TCGA-DR-A0ZM-01 | Cervix | cervical & endocervical cancer | Female | <65 | III/IV | Unspecific | Cisplatin | SD | |
| LYPD3 | SNV | Missense_Mutation | novel | c.635N>A | p.Ser212Asn | p.S212N | O95274 | protein_coding | deleterious(0.02) | possibly_damaging(0.902) | TCGA-VS-A8QF-01 | Cervix | cervical & endocervical cancer | Female | <65 | I/II | Chemotherapy | cisplatin | CR |
| LYPD3 | SNV | Missense_Mutation | c.76N>A | p.Gly26Arg | p.G26R | O95274 | protein_coding | tolerated(0.52) | benign(0) | TCGA-A6-6653-01 | Colorectum | colon adenocarcinoma | Male | >=65 | I/II | Unknown | Unknown | SD | |
| LYPD3 | SNV | Missense_Mutation | novel | c.137C>T | p.Pro46Leu | p.P46L | O95274 | protein_coding | tolerated(0.09) | benign(0.207) | TCGA-AA-3947-01 | Colorectum | colon adenocarcinoma | Female | <65 | I/II | Unknown | Unknown | SD |
| LYPD3 | SNV | Missense_Mutation | novel | c.641C>A | p.Ser214Tyr | p.S214Y | O95274 | protein_coding | tolerated(0.05) | probably_damaging(0.995) | TCGA-AA-3949-01 | Colorectum | colon adenocarcinoma | Female | >=65 | III/IV | Unknown | Unknown | SD |
| LYPD3 | SNV | Missense_Mutation | rs779677919 | c.916C>T | p.Arg306Cys | p.R306C | O95274 | protein_coding | deleterious_low_confidence(0) | probably_damaging(0.996) | TCGA-AA-3984-01 | Colorectum | colon adenocarcinoma | Female | <65 | I/II | Unknown | Unknown | SD |
| LYPD3 | SNV | Missense_Mutation | c.472N>A | p.Val158Ile | p.V158I | O95274 | protein_coding | tolerated(0.3) | possibly_damaging(0.579) | TCGA-EI-6507-01 | Colorectum | rectum adenocarcinoma | Male | <65 | I/II | Unknown | Unknown | SD |
| Page: 1 2 3 4 |
Top |
Related drugs of malignant transformation related genes |
| Identification of chemicals and drugs interact with genes involved in malignant transfromation |
| (DGIdb 4.0) |
| Entrez ID | Symbol | Category | Interaction Types | Drug Claim Name | Drug Name | PMIDs |
| Page: 1 |

Copyright 2023-Present -The University of Texas Health Science Center at Houston |