
|
|||||
|
 | |
| |
| |
| |
| |
| |
|
Gene: LTB4R |
Gene summary for LTB4R |
| Gene information | Species | Human | Gene symbol | LTB4R | Gene ID | 1241 |
| Gene name | leukotriene B4 receptor | |
| Gene Alias | BLT1 | |
| Cytomap | 14q12 | |
| Gene Type | protein-coding | GO ID | GO:0002376 | UniProtAcc | Q15722 |
Top |
Malignant transformation analysis |
| Identification of the aberrant gene expression in precancerous and cancerous lesions by comparing the gene expression of stem-like cells in diseased tissues with normal stem cells |
| Entrez ID | Symbol | Replicates | Species | Organ | Tissue | Adj P-value | Log2FC | Malignancy |
| 1241 | LTB4R | C46 | Human | Oral cavity | OSCC | 5.12e-35 | 8.27e-01 | 0.1673 |
| 1241 | LTB4R | C51 | Human | Oral cavity | OSCC | 4.02e-10 | 7.46e-01 | 0.2674 |
| 1241 | LTB4R | C57 | Human | Oral cavity | OSCC | 1.07e-05 | 4.80e-01 | 0.1679 |
| 1241 | LTB4R | C06 | Human | Oral cavity | OSCC | 9.03e-06 | 1.43e+00 | 0.2699 |
| 1241 | LTB4R | C08 | Human | Oral cavity | OSCC | 1.70e-09 | 3.56e-01 | 0.1919 |
| 1241 | LTB4R | C09 | Human | Oral cavity | OSCC | 1.13e-03 | 2.69e-01 | 0.1431 |
| 1241 | LTB4R | LN22 | Human | Oral cavity | OSCC | 1.98e-06 | 8.86e-01 | 0.1733 |
| 1241 | LTB4R | LN46 | Human | Oral cavity | OSCC | 8.15e-21 | 9.16e-01 | 0.1666 |
| 1241 | LTB4R | LP15 | Human | Oral cavity | LP | 1.01e-02 | 6.94e-01 | 0.2174 |
| 1241 | LTB4R | SYSMH1 | Human | Oral cavity | OSCC | 4.06e-22 | 6.10e-01 | 0.1127 |
| 1241 | LTB4R | SYSMH2 | Human | Oral cavity | OSCC | 1.85e-43 | 1.09e+00 | 0.2326 |
| 1241 | LTB4R | SYSMH3 | Human | Oral cavity | OSCC | 1.44e-62 | 1.40e+00 | 0.2442 |
| 1241 | LTB4R | SYSMH4 | Human | Oral cavity | OSCC | 9.43e-19 | 3.40e-01 | 0.1226 |
| 1241 | LTB4R | SYSMH5 | Human | Oral cavity | OSCC | 1.70e-04 | 2.52e-01 | 0.0647 |
| 1241 | LTB4R | P2_S3_AK | Human | Skin | AK | 1.81e-02 | 1.77e-01 | -0.3287 |
| 1241 | LTB4R | P4_S8_cSCC | Human | Skin | cSCC | 2.53e-09 | 3.04e-01 | -0.3095 |
| 1241 | LTB4R | P5_S10_cSCC | Human | Skin | cSCC | 4.89e-19 | 3.99e-01 | -0.299 |
| 1241 | LTB4R | P1_cSCC | Human | Skin | cSCC | 5.44e-75 | 1.85e+00 | 0.0292 |
| 1241 | LTB4R | P2_cSCC | Human | Skin | cSCC | 1.67e-41 | 1.01e+00 | -0.024 |
| 1241 | LTB4R | P4_cSCC | Human | Skin | cSCC | 2.03e-37 | 6.84e-01 | -0.00290000000000005 |
| Page: 1 2 3 4 |
| Tissue | Expression Dynamics | Abbreviation |
| Esophagus |  | ESCC: Esophageal squamous cell carcinoma |
| HGIN: High-grade intraepithelial neoplasias | ||
| LGIN: Low-grade intraepithelial neoplasias | ||
| Oral Cavity | 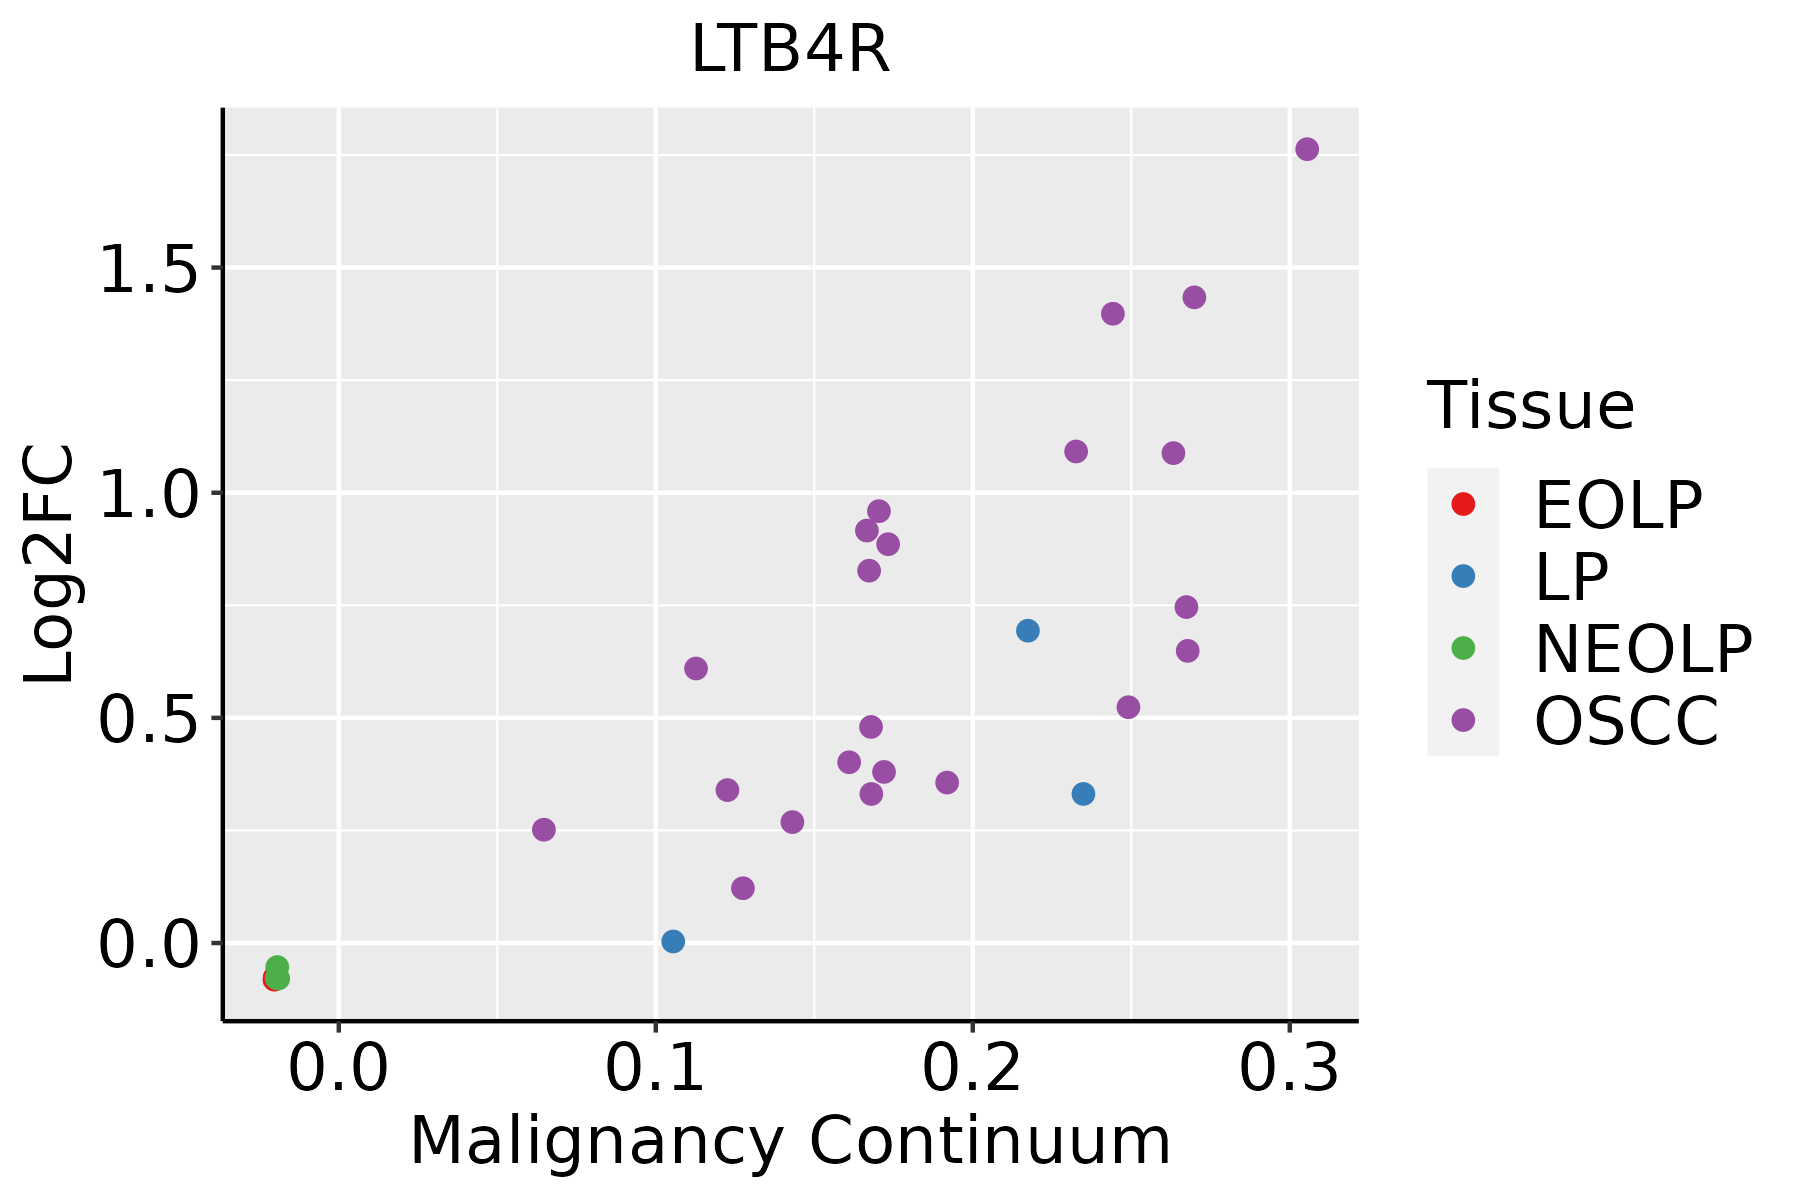 | EOLP: Erosive Oral lichen planus |
| LP: leukoplakia | ||
| NEOLP: Non-erosive oral lichen planus | ||
| OSCC: Oral squamous cell carcinoma | ||
| Skin | 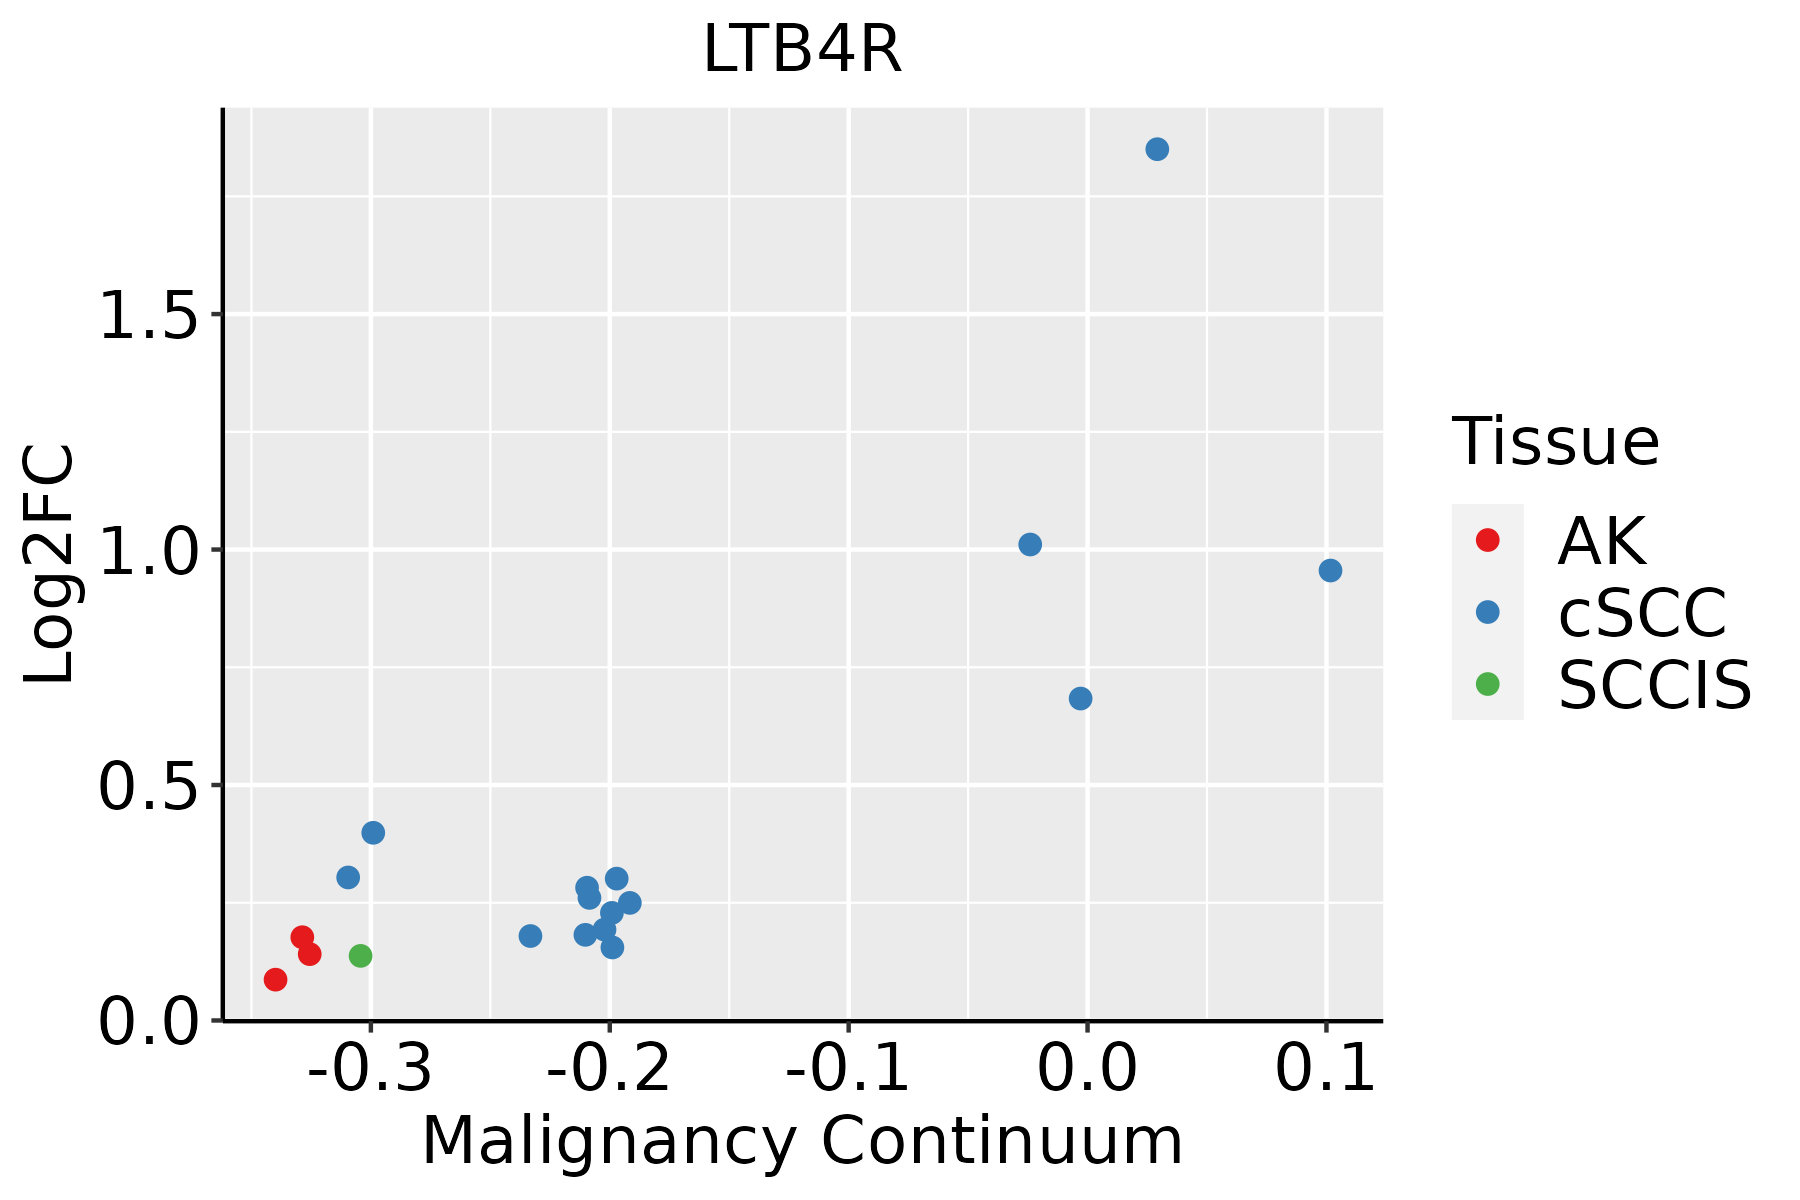 | AK: Actinic keratosis |
| cSCC: Cutaneous squamous cell carcinoma | ||
| SCCIS:squamous cell carcinoma in situ |
| ∗log2FC in expression of this searched gene in stem-like cells from each diseased tissue sample relative to stem-like cells in normal samples in each tissue plotted against the malignancy continuum. Samples are colored based on if they are from different disease stage. |
Top |
Malignant transformation related pathway analysis |
| Find out the enriched GO biological processes and KEGG pathways involved in transition from healthy to precancer to cancer |
| Tissue | Disease Stage | Enriched GO biological Processes |
| Colorectum | AD |  |
| Colorectum | SER |  |
| Colorectum | MSS |  |
| Colorectum | MSI-H |  |
| Colorectum | FAP |  |
| ∗Top 15 enriched GO BP terms are showed in the bar plot of each disease state in each tissue. Each row represents a significant GO biological process which is colored according to the -log10(p.adjust). |
| Page: 1 2 3 4 5 6 7 8 9 |
| GO ID | Tissue | Disease Stage | Description | Gene Ratio | Bg Ratio | pvalue | p.adjust | Count |
| GO:000166720 | Esophagus | ESCC | ameboidal-type cell migration | 250/8552 | 475/18723 | 1.22e-03 | 5.97e-03 | 250 |
| GO:001063120 | Esophagus | ESCC | epithelial cell migration | 187/8552 | 357/18723 | 6.05e-03 | 2.23e-02 | 187 |
| GO:009013220 | Esophagus | ESCC | epithelium migration | 188/8552 | 360/18723 | 6.96e-03 | 2.54e-02 | 188 |
| GO:009013020 | Esophagus | ESCC | tissue migration | 190/8552 | 365/18723 | 7.91e-03 | 2.82e-02 | 190 |
| GO:000166719 | Oral cavity | OSCC | ameboidal-type cell migration | 228/7305 | 475/18723 | 3.46e-05 | 3.10e-04 | 228 |
| GO:001063118 | Oral cavity | OSCC | epithelial cell migration | 174/7305 | 357/18723 | 1.04e-04 | 7.70e-04 | 174 |
| GO:009013218 | Oral cavity | OSCC | epithelium migration | 175/7305 | 360/18723 | 1.18e-04 | 8.54e-04 | 175 |
| GO:009013018 | Oral cavity | OSCC | tissue migration | 176/7305 | 365/18723 | 1.92e-04 | 1.29e-03 | 176 |
| GO:00030129 | Skin | AK | muscle system process | 64/1910 | 452/18723 | 4.32e-03 | 2.52e-02 | 64 |
| Page: 1 |
| Pathway ID | Tissue | Disease Stage | Description | Gene Ratio | Bg Ratio | pvalue | p.adjust | qvalue | Count |
| Page: 1 |
Top |
Cell-cell communication analysis |
| Identification of potential cell-cell interactions between two cell types and their ligand-receptor pairs for different disease states |
| Ligand | Receptor | LRpair | Pathway | Tissue | Disease Stage |
| Page: 1 |
Top |
Single-cell gene regulatory network inference analysis |
| Find out the significant the regulons (TFs) and the target genes of each regulon across cell types for different disease states |
| TF | Cell Type | Tissue | Disease Stage | Target Gene | RSS | Regulon Activity |
| ∗The dot plots of a searched regulon are shown for all cell subpopulations in each disease state of each tissue based on the regulon specific score inferred using pySCENIC and by calculating the average expression. |
| Page: 1 |
Top |
Somatic mutation of malignant transformation related genes |
| Annotation of somatic variants for genes involved in malignant transformation |
| Hugo Symbol | Variant Class | Variant Classification | dbSNP RS | HGVSc | HGVSp | HGVSp Short | SWISSPROT | BIOTYPE | SIFT | PolyPhen | Tumor Sample Barcode | Tissue | Histology | Sex | Age | Stage | Therapy Types | Drugs | Outcome |
| LTB4R | SNV | Missense_Mutation | novel | c.326N>A | p.Thr109Lys | p.T109K | Q15722 | protein_coding | deleterious(0.02) | possibly_damaging(0.758) | TCGA-EA-A411-01 | Cervix | cervical & endocervical cancer | Female | <65 | I/II | Unknown | Unknown | SD |
| LTB4R | SNV | Missense_Mutation | novel | c.401N>T | p.Ala134Val | p.A134V | Q15722 | protein_coding | tolerated(1) | benign(0.015) | TCGA-VS-A94Z-01 | Cervix | cervical & endocervical cancer | Female | <65 | I/II | Chemotherapy | cisplatin | CR |
| LTB4R | SNV | Missense_Mutation | novel | c.602A>T | p.Tyr201Phe | p.Y201F | Q15722 | protein_coding | deleterious(0) | probably_damaging(0.986) | TCGA-VS-A950-01 | Cervix | cervical & endocervical cancer | Female | <65 | III/IV | Unknown | Unknown | SD |
| LTB4R | SNV | Missense_Mutation | c.217T>C | p.Phe73Leu | p.F73L | Q15722 | protein_coding | tolerated(0.24) | benign(0.018) | TCGA-VS-A9UV-01 | Cervix | cervical & endocervical cancer | Female | >=65 | I/II | Unknown | Unknown | PD | |
| LTB4R | insertion | In_Frame_Ins | novel | c.325_326insGTG | p.Thr109delinsSerAla | p.T109delinsSA | Q15722 | protein_coding | TCGA-EA-A411-01 | Cervix | cervical & endocervical cancer | Female | <65 | I/II | Unknown | Unknown | SD | ||
| LTB4R | SNV | Missense_Mutation | novel | c.97N>G | p.Leu33Val | p.L33V | Q15722 | protein_coding | tolerated(0.06) | benign(0.018) | TCGA-AA-3930-01 | Colorectum | colon adenocarcinoma | Male | >=65 | III/IV | Chemotherapy | capecitabine | PD |
| LTB4R | SNV | Missense_Mutation | novel | c.263N>T | p.Ala88Val | p.A88V | Q15722 | protein_coding | tolerated(0.53) | benign(0.011) | TCGA-AA-3930-01 | Colorectum | colon adenocarcinoma | Male | >=65 | III/IV | Chemotherapy | capecitabine | PD |
| LTB4R | SNV | Missense_Mutation | c.568T>G | p.Phe190Val | p.F190V | Q15722 | protein_coding | deleterious(0) | probably_damaging(0.985) | TCGA-AG-A002-01 | Colorectum | rectum adenocarcinoma | Male | <65 | I/II | Unknown | Unknown | SD | |
| LTB4R | SNV | Missense_Mutation | novel | c.221N>C | p.Phe74Ser | p.F74S | Q15722 | protein_coding | deleterious(0) | probably_damaging(0.994) | TCGA-F5-6814-01 | Colorectum | rectum adenocarcinoma | Male | <65 | I/II | Unknown | Unknown | SD |
| LTB4R | SNV | Missense_Mutation | novel | c.362G>A | p.Arg121His | p.R121H | Q15722 | protein_coding | tolerated(0.11) | possibly_damaging(0.88) | TCGA-A5-A0G2-01 | Endometrium | uterine corpus endometrioid carcinoma | Female | <65 | III/IV | Unknown | Unknown | SD |
| Page: 1 2 3 |
Top |
Related drugs of malignant transformation related genes |
| Identification of chemicals and drugs interact with genes involved in malignant transfromation |
| (DGIdb 4.0) |
| Entrez ID | Symbol | Category | Interaction Types | Drug Claim Name | Drug Name | PMIDs |
| 1241 | LTB4R | G PROTEIN COUPLED RECEPTOR, DRUGGABLE GENOME | antagonist | CHEMBL1742420 | AMELUBANT | |
| 1241 | LTB4R | G PROTEIN COUPLED RECEPTOR, DRUGGABLE GENOME | agonist | 135651386 | ||
| 1241 | LTB4R | G PROTEIN COUPLED RECEPTOR, DRUGGABLE GENOME | antagonist | 178100421 | ||
| 1241 | LTB4R | G PROTEIN COUPLED RECEPTOR, DRUGGABLE GENOME | Biomed 101 | |||
| 1241 | LTB4R | G PROTEIN COUPLED RECEPTOR, DRUGGABLE GENOME | Amelubant | AMELUBANT | ||
| 1241 | LTB4R | G PROTEIN COUPLED RECEPTOR, DRUGGABLE GENOME | CP-195543 | CP-195543 | ||
| 1241 | LTB4R | G PROTEIN COUPLED RECEPTOR, DRUGGABLE GENOME | antagonist | 178102777 | SC-41390 | |
| 1241 | LTB4R | G PROTEIN COUPLED RECEPTOR, DRUGGABLE GENOME | antagonist | 178102776 | CP-195543 | |
| 1241 | LTB4R | G PROTEIN COUPLED RECEPTOR, DRUGGABLE GENOME | antagonist | 178100392 | ||
| 1241 | LTB4R | G PROTEIN COUPLED RECEPTOR, DRUGGABLE GENOME | LTB 019 |
| Page: 1 2 3 |

Copyright 2023-Present -The University of Texas Health Science Center at Houston |