
|
|||||
|
 | |
| |
| |
| |
| |
| |
|
Gene: LRRC28 |
Gene summary for LRRC28 |
| Gene information | Species | Human | Gene symbol | LRRC28 | Gene ID | 123355 |
| Gene name | leucine rich repeat containing 28 | |
| Gene Alias | LRRC28 | |
| Cytomap | 15q26.3 | |
| Gene Type | protein-coding | GO ID | NA | UniProtAcc | A0A024RC88 |
Top |
Malignant transformation analysis |
| Identification of the aberrant gene expression in precancerous and cancerous lesions by comparing the gene expression of stem-like cells in diseased tissues with normal stem cells |
| Entrez ID | Symbol | Replicates | Species | Organ | Tissue | Adj P-value | Log2FC | Malignancy |
| 123355 | LRRC28 | P52T-E | Human | Esophagus | ESCC | 2.33e-15 | 3.26e-01 | 0.1555 |
| 123355 | LRRC28 | P54T-E | Human | Esophagus | ESCC | 8.79e-20 | 3.90e-01 | 0.0975 |
| 123355 | LRRC28 | P56T-E | Human | Esophagus | ESCC | 1.17e-02 | 4.86e-01 | 0.1613 |
| 123355 | LRRC28 | P57T-E | Human | Esophagus | ESCC | 4.39e-14 | 2.09e-01 | 0.0926 |
| 123355 | LRRC28 | P61T-E | Human | Esophagus | ESCC | 1.37e-17 | 2.32e-01 | 0.099 |
| 123355 | LRRC28 | P62T-E | Human | Esophagus | ESCC | 2.34e-18 | 2.15e-01 | 0.1302 |
| 123355 | LRRC28 | P65T-E | Human | Esophagus | ESCC | 2.35e-11 | 2.11e-01 | 0.0978 |
| 123355 | LRRC28 | P74T-E | Human | Esophagus | ESCC | 1.71e-12 | 3.31e-01 | 0.1479 |
| 123355 | LRRC28 | P75T-E | Human | Esophagus | ESCC | 5.12e-15 | 3.12e-01 | 0.1125 |
| 123355 | LRRC28 | P76T-E | Human | Esophagus | ESCC | 6.30e-17 | 3.29e-01 | 0.1207 |
| 123355 | LRRC28 | P79T-E | Human | Esophagus | ESCC | 3.46e-122 | 3.60e+00 | 0.1154 |
| 123355 | LRRC28 | P80T-E | Human | Esophagus | ESCC | 1.25e-13 | 3.55e-01 | 0.155 |
| 123355 | LRRC28 | P82T-E | Human | Esophagus | ESCC | 7.81e-13 | 5.33e-01 | 0.1072 |
| 123355 | LRRC28 | P83T-E | Human | Esophagus | ESCC | 3.33e-15 | 4.62e-01 | 0.1738 |
| 123355 | LRRC28 | P84T-E | Human | Esophagus | ESCC | 2.58e-05 | 3.51e-01 | 0.0933 |
| 123355 | LRRC28 | P89T-E | Human | Esophagus | ESCC | 1.71e-08 | 3.25e-01 | 0.1752 |
| 123355 | LRRC28 | P91T-E | Human | Esophagus | ESCC | 1.32e-08 | 7.34e-01 | 0.1828 |
| 123355 | LRRC28 | P107T-E | Human | Esophagus | ESCC | 1.50e-32 | 6.31e-01 | 0.171 |
| 123355 | LRRC28 | P126T-E | Human | Esophagus | ESCC | 4.79e-07 | 4.36e-01 | 0.1125 |
| 123355 | LRRC28 | P127T-E | Human | Esophagus | ESCC | 2.16e-18 | 2.00e-01 | 0.0826 |
| Page: 1 2 3 4 5 |
| Tissue | Expression Dynamics | Abbreviation |
| Esophagus | 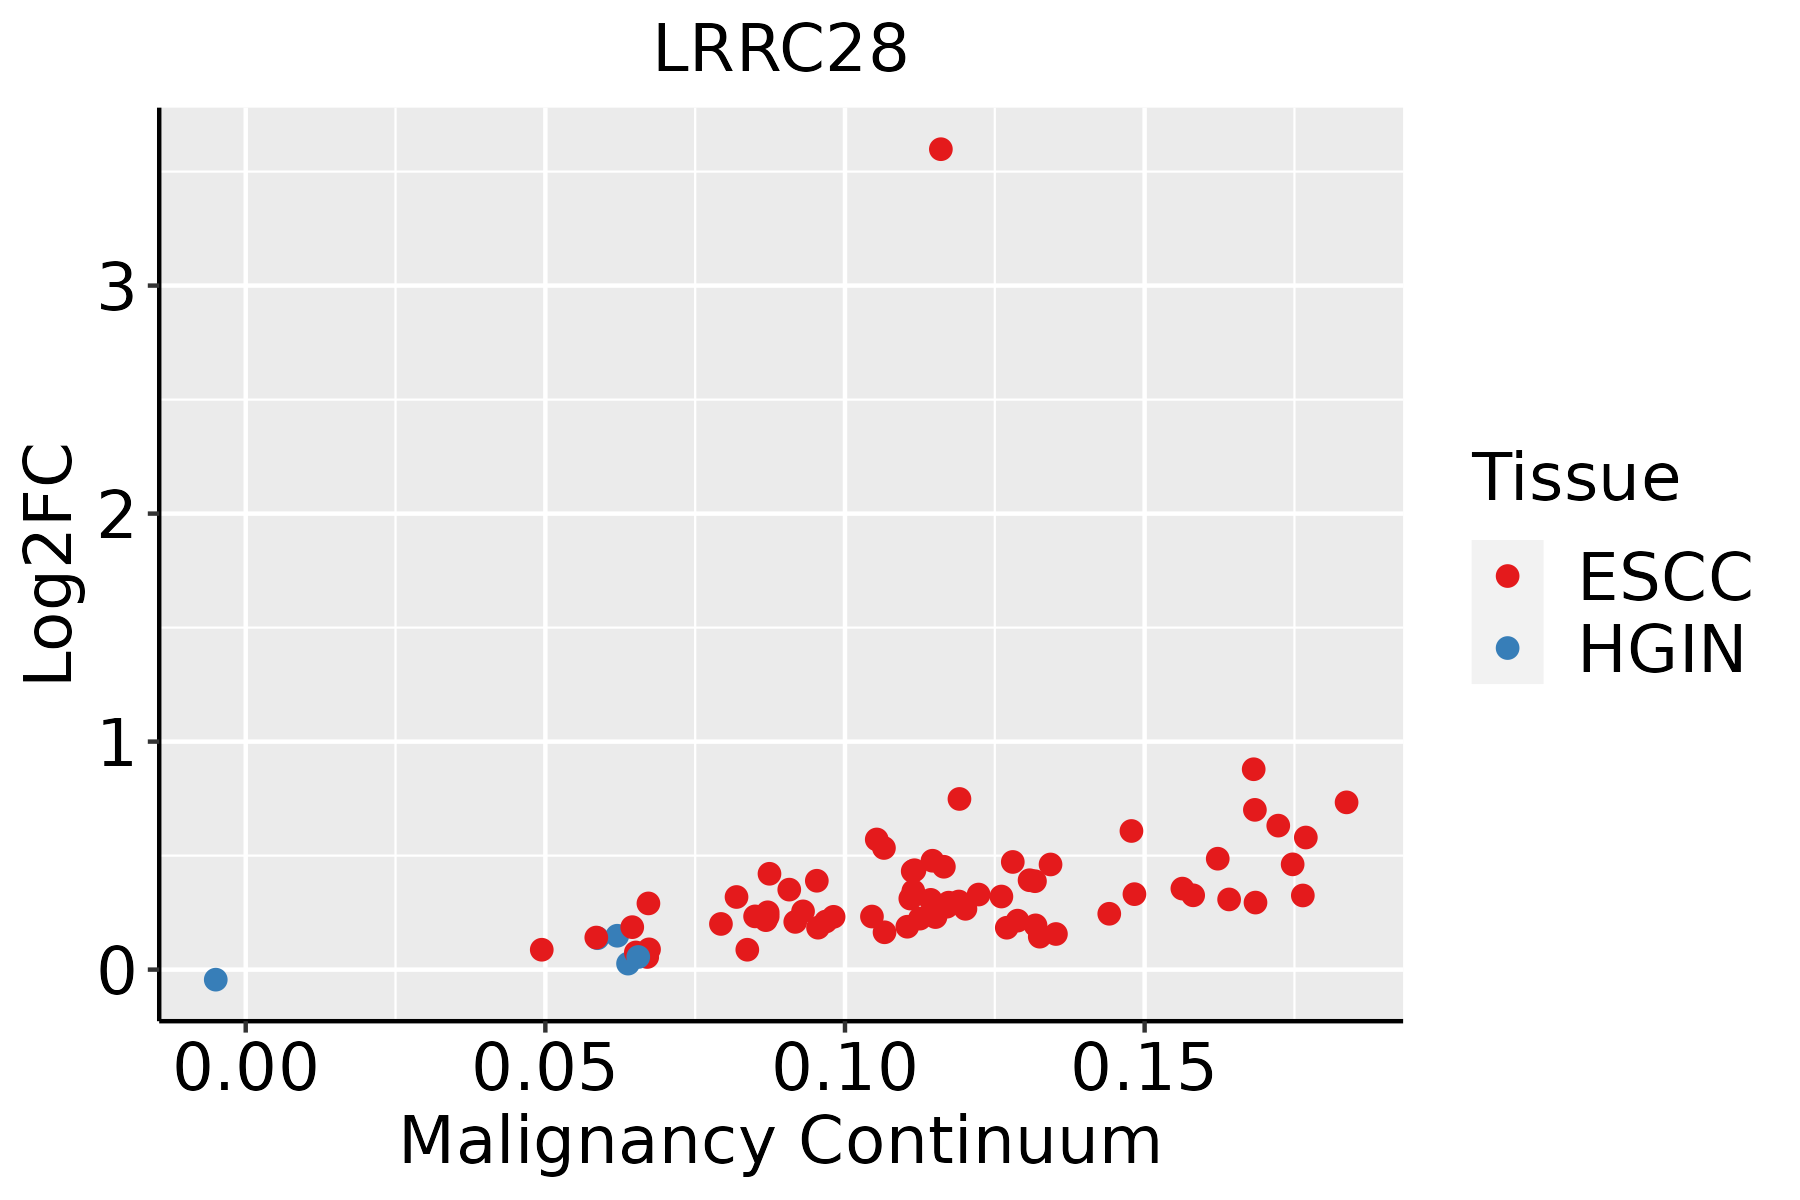 | ESCC: Esophageal squamous cell carcinoma |
| HGIN: High-grade intraepithelial neoplasias | ||
| LGIN: Low-grade intraepithelial neoplasias | ||
| Liver |  | HCC: Hepatocellular carcinoma |
| NAFLD: Non-alcoholic fatty liver disease | ||
| Oral Cavity | 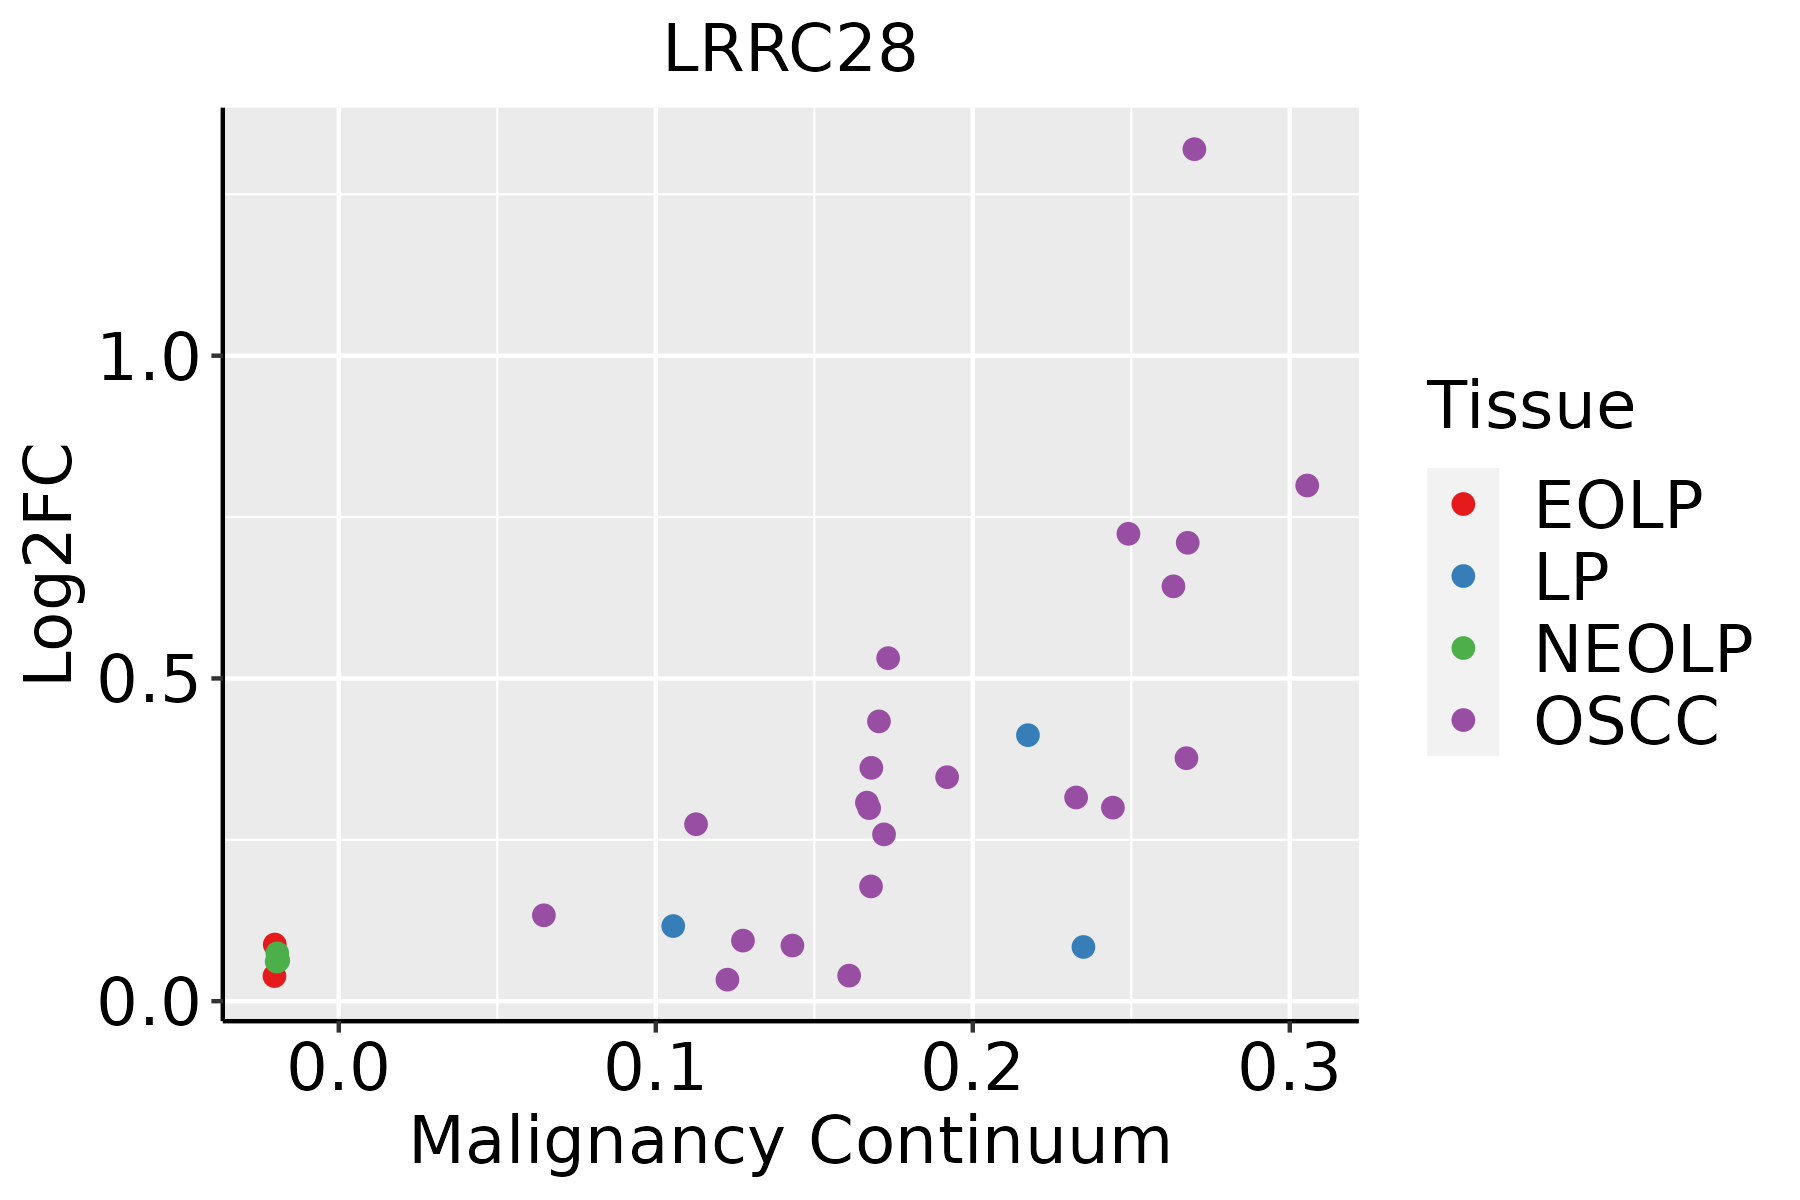 | EOLP: Erosive Oral lichen planus |
| LP: leukoplakia | ||
| NEOLP: Non-erosive oral lichen planus | ||
| OSCC: Oral squamous cell carcinoma |
| ∗log2FC in expression of this searched gene in stem-like cells from each diseased tissue sample relative to stem-like cells in normal samples in each tissue plotted against the malignancy continuum. Samples are colored based on if they are from different disease stage. |
Top |
Malignant transformation related pathway analysis |
| Find out the enriched GO biological processes and KEGG pathways involved in transition from healthy to precancer to cancer |
| Tissue | Disease Stage | Enriched GO biological Processes |
| Colorectum | AD |  |
| Colorectum | SER |  |
| Colorectum | MSS |  |
| Colorectum | MSI-H |  |
| Colorectum | FAP |  |
| ∗Top 15 enriched GO BP terms are showed in the bar plot of each disease state in each tissue. Each row represents a significant GO biological process which is colored according to the -log10(p.adjust). |
| Page: 1 2 3 4 5 6 7 8 9 |
| GO ID | Tissue | Disease Stage | Description | Gene Ratio | Bg Ratio | pvalue | p.adjust | Count |
| Page: 1 |
| Pathway ID | Tissue | Disease Stage | Description | Gene Ratio | Bg Ratio | pvalue | p.adjust | qvalue | Count |
| Page: 1 |
Top |
Cell-cell communication analysis |
| Identification of potential cell-cell interactions between two cell types and their ligand-receptor pairs for different disease states |
| Ligand | Receptor | LRpair | Pathway | Tissue | Disease Stage |
| Page: 1 |
Top |
Single-cell gene regulatory network inference analysis |
| Find out the significant the regulons (TFs) and the target genes of each regulon across cell types for different disease states |
| TF | Cell Type | Tissue | Disease Stage | Target Gene | RSS | Regulon Activity |
| ∗The dot plots of a searched regulon are shown for all cell subpopulations in each disease state of each tissue based on the regulon specific score inferred using pySCENIC and by calculating the average expression. |
| Page: 1 |
Top |
Somatic mutation of malignant transformation related genes |
| Annotation of somatic variants for genes involved in malignant transformation |
| Hugo Symbol | Variant Class | Variant Classification | dbSNP RS | HGVSc | HGVSp | HGVSp Short | SWISSPROT | BIOTYPE | SIFT | PolyPhen | Tumor Sample Barcode | Tissue | Histology | Sex | Age | Stage | Therapy Types | Drugs | Outcome |
| LRRC28 | SNV | Missense_Mutation | c.587N>G | p.Pro196Arg | p.P196R | Q86X40 | protein_coding | deleterious(0) | probably_damaging(0.996) | TCGA-A8-A07R-01 | Breast | breast invasive carcinoma | Female | >=65 | III/IV | Ancillary | zoledronic | SD | |
| LRRC28 | insertion | Nonsense_Mutation | novel | c.1080_1081insTCCTGAAAAGTTTTTAGGTAACCACCC | p.Leu360_Gln361insSerTerLysValPheArgTerProPro | p.L360_Q361insS*KVFR*PP | Q86X40 | protein_coding | TCGA-AO-A03R-01 | Breast | breast invasive carcinoma | Female | <65 | I/II | Chemotherapy | doxorubicin | SD | ||
| LRRC28 | SNV | Missense_Mutation | novel | c.890N>T | p.Pro297Leu | p.P297L | Q86X40 | protein_coding | deleterious(0.01) | possibly_damaging(0.521) | TCGA-2W-A8YY-01 | Cervix | cervical & endocervical cancer | Female | <65 | I/II | Chemotherapy | cisplatin | CR |
| LRRC28 | SNV | Missense_Mutation | c.797N>C | p.Glu266Ala | p.E266A | Q86X40 | protein_coding | tolerated(0.33) | benign(0) | TCGA-A6-5665-01 | Colorectum | colon adenocarcinoma | Female | >=65 | I/II | Unknown | Unknown | PD | |
| LRRC28 | SNV | Missense_Mutation | rs750430368 | c.242N>T | p.Pro81Leu | p.P81L | Q86X40 | protein_coding | deleterious(0.01) | probably_damaging(0.995) | TCGA-A6-6141-01 | Colorectum | colon adenocarcinoma | Male | <65 | I/II | Chemotherapy | 5-fu | SD |
| LRRC28 | SNV | Missense_Mutation | c.248C>T | p.Ala83Val | p.A83V | Q86X40 | protein_coding | deleterious(0.02) | probably_damaging(0.983) | TCGA-AA-3510-01 | Colorectum | colon adenocarcinoma | Male | >=65 | I/II | Unknown | Unknown | SD | |
| LRRC28 | SNV | Missense_Mutation | c.638A>G | p.Asn213Ser | p.N213S | Q86X40 | protein_coding | deleterious(0.04) | benign(0.062) | TCGA-AA-3510-01 | Colorectum | colon adenocarcinoma | Male | >=65 | I/II | Unknown | Unknown | SD | |
| LRRC28 | SNV | Missense_Mutation | rs375152645 | c.497N>A | p.Arg166Gln | p.R166Q | Q86X40 | protein_coding | tolerated(0.06) | benign(0.005) | TCGA-AA-3984-01 | Colorectum | colon adenocarcinoma | Female | <65 | I/II | Unknown | Unknown | SD |
| LRRC28 | SNV | Missense_Mutation | rs199769485 | c.340N>T | p.Arg114Cys | p.R114C | Q86X40 | protein_coding | deleterious(0) | probably_damaging(0.996) | TCGA-AZ-4313-01 | Colorectum | colon adenocarcinoma | Female | <65 | I/II | Unknown | Unknown | SD |
| LRRC28 | SNV | Missense_Mutation | rs753306548 | c.502N>T | p.Arg168Cys | p.R168C | Q86X40 | protein_coding | tolerated(0.15) | benign(0.438) | TCGA-AZ-4315-01 | Colorectum | colon adenocarcinoma | Male | <65 | I/II | Unknown | Unknown | SD |
| Page: 1 2 3 4 5 |
Top |
Related drugs of malignant transformation related genes |
| Identification of chemicals and drugs interact with genes involved in malignant transfromation |
| (DGIdb 4.0) |
| Entrez ID | Symbol | Category | Interaction Types | Drug Claim Name | Drug Name | PMIDs |
| Page: 1 |

Copyright 2023-Present -The University of Texas Health Science Center at Houston |