
|
|||||
|
 | |
| |
| |
| |
| |
| |
|
Gene: LPAR2 |
Gene summary for LPAR2 |
| Gene information | Species | Human | Gene symbol | LPAR2 | Gene ID | 9170 |
| Gene name | lysophosphatidic acid receptor 2 | |
| Gene Alias | EDG-4 | |
| Cytomap | 19p13.11 | |
| Gene Type | protein-coding | GO ID | GO:0006873 | UniProtAcc | A0A024R7M9 |
Top |
Malignant transformation analysis |
| Identification of the aberrant gene expression in precancerous and cancerous lesions by comparing the gene expression of stem-like cells in diseased tissues with normal stem cells |
| Entrez ID | Symbol | Replicates | Species | Organ | Tissue | Adj P-value | Log2FC | Malignancy |
| 9170 | LPAR2 | P56T-E | Human | Esophagus | ESCC | 2.84e-02 | 5.28e-01 | 0.1613 |
| 9170 | LPAR2 | P57T-E | Human | Esophagus | ESCC | 1.32e-09 | 2.35e-01 | 0.0926 |
| 9170 | LPAR2 | P61T-E | Human | Esophagus | ESCC | 9.18e-19 | 4.90e-01 | 0.099 |
| 9170 | LPAR2 | P62T-E | Human | Esophagus | ESCC | 7.23e-29 | 5.36e-01 | 0.1302 |
| 9170 | LPAR2 | P65T-E | Human | Esophagus | ESCC | 6.97e-08 | 2.65e-01 | 0.0978 |
| 9170 | LPAR2 | P74T-E | Human | Esophagus | ESCC | 8.98e-15 | 4.77e-01 | 0.1479 |
| 9170 | LPAR2 | P75T-E | Human | Esophagus | ESCC | 5.81e-17 | 3.27e-01 | 0.1125 |
| 9170 | LPAR2 | P76T-E | Human | Esophagus | ESCC | 3.90e-14 | 2.90e-01 | 0.1207 |
| 9170 | LPAR2 | P79T-E | Human | Esophagus | ESCC | 5.34e-17 | 3.03e-01 | 0.1154 |
| 9170 | LPAR2 | P80T-E | Human | Esophagus | ESCC | 4.49e-20 | 4.95e-01 | 0.155 |
| 9170 | LPAR2 | P82T-E | Human | Esophagus | ESCC | 1.45e-08 | 5.68e-01 | 0.1072 |
| 9170 | LPAR2 | P83T-E | Human | Esophagus | ESCC | 4.61e-42 | 1.04e+00 | 0.1738 |
| 9170 | LPAR2 | P84T-E | Human | Esophagus | ESCC | 3.14e-08 | 3.56e-01 | 0.0933 |
| 9170 | LPAR2 | P89T-E | Human | Esophagus | ESCC | 2.56e-14 | 9.31e-01 | 0.1752 |
| 9170 | LPAR2 | P91T-E | Human | Esophagus | ESCC | 2.34e-12 | 7.98e-01 | 0.1828 |
| 9170 | LPAR2 | P107T-E | Human | Esophagus | ESCC | 5.65e-17 | 4.73e-01 | 0.171 |
| 9170 | LPAR2 | P126T-E | Human | Esophagus | ESCC | 4.79e-02 | 3.28e-01 | 0.1125 |
| 9170 | LPAR2 | P127T-E | Human | Esophagus | ESCC | 5.63e-06 | 1.13e-01 | 0.0826 |
| 9170 | LPAR2 | P128T-E | Human | Esophagus | ESCC | 1.68e-25 | 8.12e-01 | 0.1241 |
| 9170 | LPAR2 | P130T-E | Human | Esophagus | ESCC | 1.09e-47 | 1.00e+00 | 0.1676 |
| Page: 1 2 3 4 |
| Tissue | Expression Dynamics | Abbreviation |
| Esophagus | 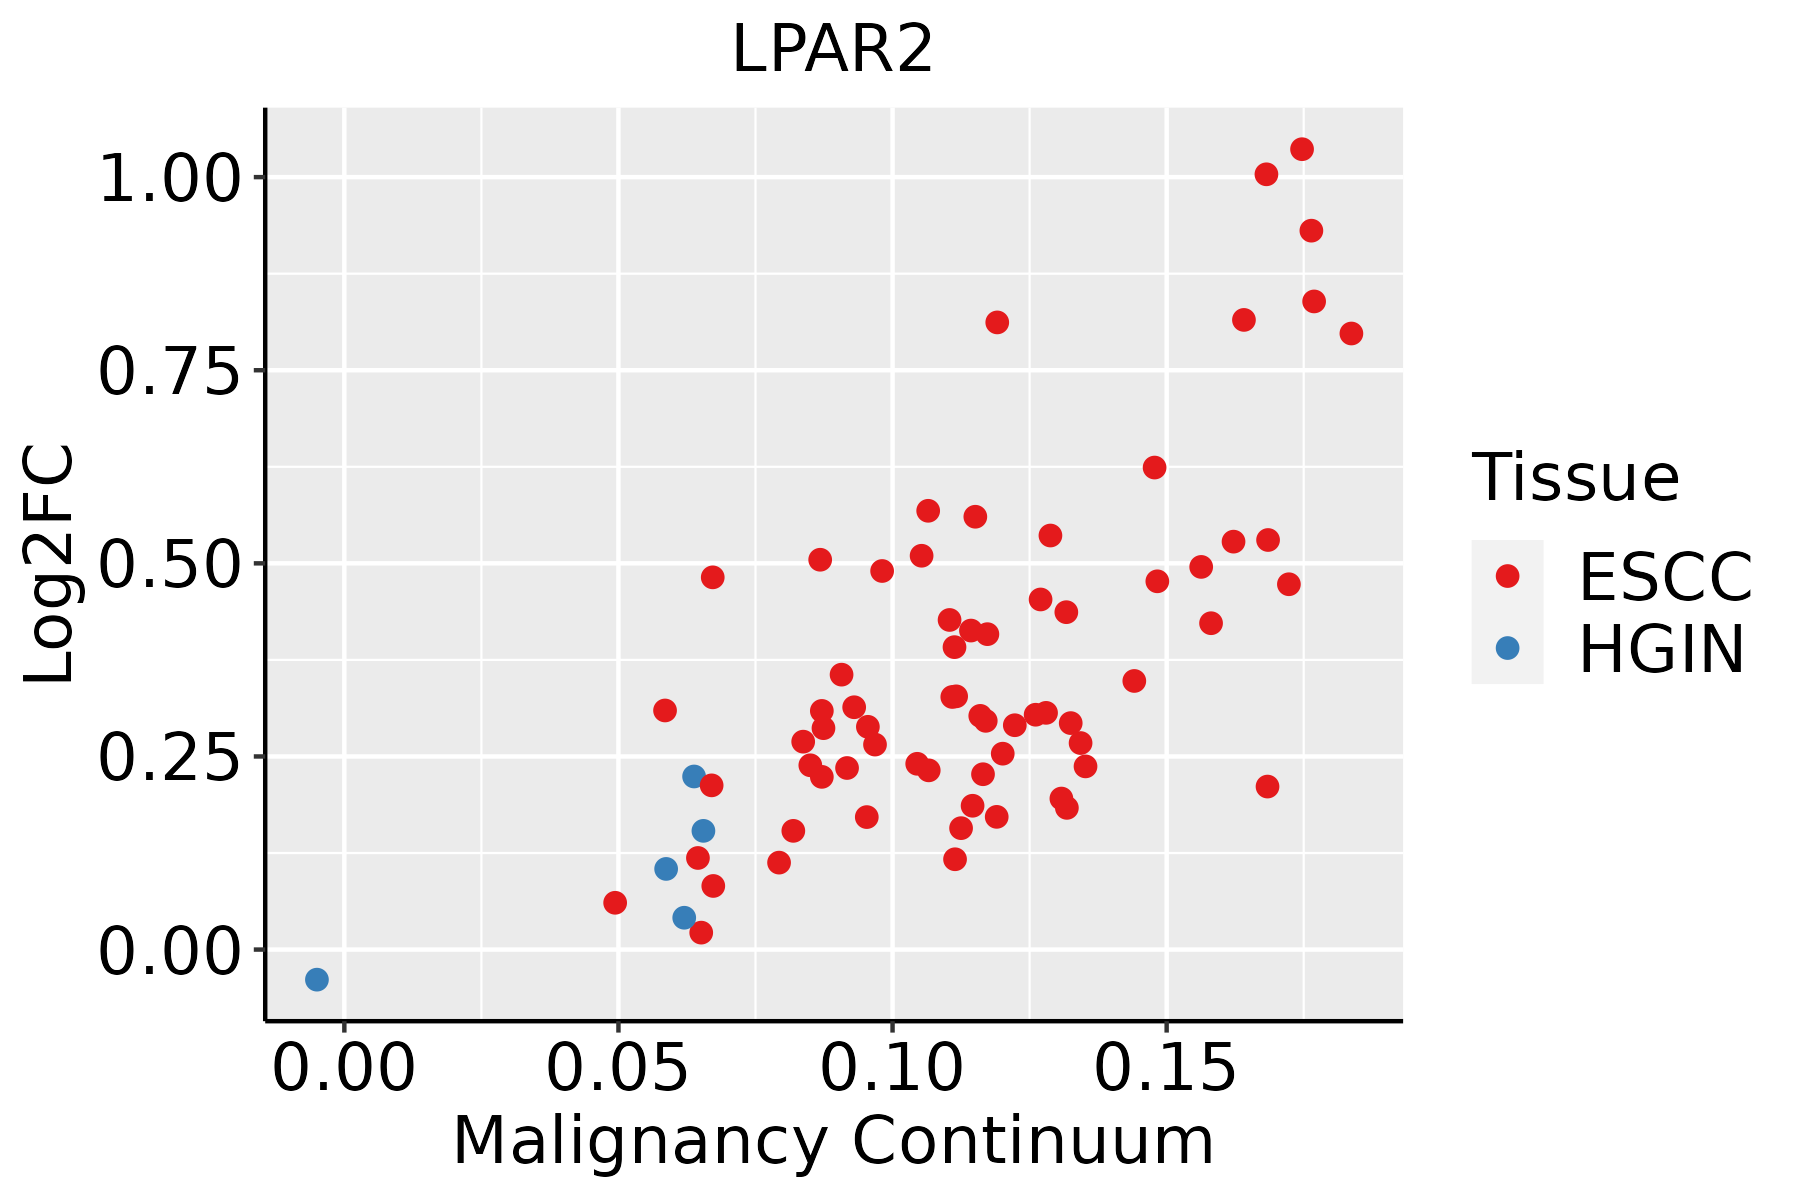 | ESCC: Esophageal squamous cell carcinoma |
| HGIN: High-grade intraepithelial neoplasias | ||
| LGIN: Low-grade intraepithelial neoplasias | ||
| Oral Cavity |  | EOLP: Erosive Oral lichen planus |
| LP: leukoplakia | ||
| NEOLP: Non-erosive oral lichen planus | ||
| OSCC: Oral squamous cell carcinoma |
| ∗log2FC in expression of this searched gene in stem-like cells from each diseased tissue sample relative to stem-like cells in normal samples in each tissue plotted against the malignancy continuum. Samples are colored based on if they are from different disease stage. |
Top |
Malignant transformation related pathway analysis |
| Find out the enriched GO biological processes and KEGG pathways involved in transition from healthy to precancer to cancer |
| Tissue | Disease Stage | Enriched GO biological Processes |
| Colorectum | AD |  |
| Colorectum | SER |  |
| Colorectum | MSS |  |
| Colorectum | MSI-H |  |
| Colorectum | FAP |  |
| ∗Top 15 enriched GO BP terms are showed in the bar plot of each disease state in each tissue. Each row represents a significant GO biological process which is colored according to the -log10(p.adjust). |
| Page: 1 2 3 4 5 6 7 8 9 |
| GO ID | Tissue | Disease Stage | Description | Gene Ratio | Bg Ratio | pvalue | p.adjust | Count |
| Page: 1 |
| Pathway ID | Tissue | Disease Stage | Description | Gene Ratio | Bg Ratio | pvalue | p.adjust | qvalue | Count |
| hsa05130211 | Esophagus | ESCC | Pathogenic Escherichia coli infection | 142/4205 | 197/8465 | 8.21e-11 | 1.06e-09 | 5.42e-10 | 142 |
| hsa0481028 | Esophagus | ESCC | Regulation of actin cytoskeleton | 133/4205 | 229/8465 | 5.94e-03 | 1.48e-02 | 7.56e-03 | 133 |
| hsa041517 | Esophagus | ESCC | PI3K-Akt signaling pathway | 197/4205 | 354/8465 | 1.24e-02 | 2.83e-02 | 1.45e-02 | 197 |
| hsa05130310 | Esophagus | ESCC | Pathogenic Escherichia coli infection | 142/4205 | 197/8465 | 8.21e-11 | 1.06e-09 | 5.42e-10 | 142 |
| hsa04810112 | Esophagus | ESCC | Regulation of actin cytoskeleton | 133/4205 | 229/8465 | 5.94e-03 | 1.48e-02 | 7.56e-03 | 133 |
| hsa0415114 | Esophagus | ESCC | PI3K-Akt signaling pathway | 197/4205 | 354/8465 | 1.24e-02 | 2.83e-02 | 1.45e-02 | 197 |
| hsa0513030 | Oral cavity | OSCC | Pathogenic Escherichia coli infection | 129/3704 | 197/8465 | 4.32e-10 | 5.17e-09 | 2.63e-09 | 129 |
| hsa0481026 | Oral cavity | OSCC | Regulation of actin cytoskeleton | 129/3704 | 229/8465 | 7.14e-05 | 2.74e-04 | 1.40e-04 | 129 |
| hsa041516 | Oral cavity | OSCC | PI3K-Akt signaling pathway | 185/3704 | 354/8465 | 6.26e-04 | 1.86e-03 | 9.49e-04 | 185 |
| hsa0401518 | Oral cavity | OSCC | Rap1 signaling pathway | 107/3704 | 210/8465 | 2.01e-02 | 4.34e-02 | 2.21e-02 | 107 |
| hsa05130114 | Oral cavity | OSCC | Pathogenic Escherichia coli infection | 129/3704 | 197/8465 | 4.32e-10 | 5.17e-09 | 2.63e-09 | 129 |
| hsa04810111 | Oral cavity | OSCC | Regulation of actin cytoskeleton | 129/3704 | 229/8465 | 7.14e-05 | 2.74e-04 | 1.40e-04 | 129 |
| hsa0415113 | Oral cavity | OSCC | PI3K-Akt signaling pathway | 185/3704 | 354/8465 | 6.26e-04 | 1.86e-03 | 9.49e-04 | 185 |
| hsa0401519 | Oral cavity | OSCC | Rap1 signaling pathway | 107/3704 | 210/8465 | 2.01e-02 | 4.34e-02 | 2.21e-02 | 107 |
| Page: 1 |
Top |
Cell-cell communication analysis |
| Identification of potential cell-cell interactions between two cell types and their ligand-receptor pairs for different disease states |
| Ligand | Receptor | LRpair | Pathway | Tissue | Disease Stage |
| Page: 1 |
Top |
Single-cell gene regulatory network inference analysis |
| Find out the significant the regulons (TFs) and the target genes of each regulon across cell types for different disease states |
| TF | Cell Type | Tissue | Disease Stage | Target Gene | RSS | Regulon Activity |
| ∗The dot plots of a searched regulon are shown for all cell subpopulations in each disease state of each tissue based on the regulon specific score inferred using pySCENIC and by calculating the average expression. |
| Page: 1 |
Top |
Somatic mutation of malignant transformation related genes |
| Annotation of somatic variants for genes involved in malignant transformation |
| Hugo Symbol | Variant Class | Variant Classification | dbSNP RS | HGVSc | HGVSp | HGVSp Short | SWISSPROT | BIOTYPE | SIFT | PolyPhen | Tumor Sample Barcode | Tissue | Histology | Sex | Age | Stage | Therapy Types | Drugs | Outcome |
| LPAR2 | insertion | Frame_Shift_Ins | novel | c.965_966insCTTGGTAAGCCCTGTGGACT | p.Val323LeufsTer31 | p.V323Lfs*31 | Q9HBW0 | protein_coding | TCGA-A8-A06Q-01 | Breast | breast invasive carcinoma | Female | <65 | III/IV | Unknown | Unknown | SD | ||
| LPAR2 | insertion | In_Frame_Ins | novel | c.963_964insACATTATTCTGTTTTCACTGCGTA | p.Glu321_Ser322insThrLeuPheCysPheHisCysVal | p.E321_S322insTLFCFHCV | Q9HBW0 | protein_coding | TCGA-A8-A06Q-01 | Breast | breast invasive carcinoma | Female | <65 | III/IV | Unknown | Unknown | SD | ||
| LPAR2 | insertion | Nonsense_Mutation | novel | c.844_845insGATTACAGGCACCTGCCACCGTGCCCGGCTAATT | p.Leu282ArgfsTer11 | p.L282Rfs*11 | Q9HBW0 | protein_coding | TCGA-AN-A04A-01 | Breast | breast invasive carcinoma | Female | <65 | III/IV | Unknown | Unknown | SD | ||
| LPAR2 | SNV | Missense_Mutation | novel | c.646C>T | p.Arg216Trp | p.R216W | Q9HBW0 | protein_coding | deleterious(0.03) | probably_damaging(0.989) | TCGA-EA-A3HU-01 | Cervix | cervical & endocervical cancer | Female | <65 | I/II | Unknown | Unknown | SD |
| LPAR2 | SNV | Missense_Mutation | c.385C>T | p.Arg129Trp | p.R129W | Q9HBW0 | protein_coding | deleterious(0) | probably_damaging(1) | TCGA-ZJ-AAXD-01 | Cervix | cervical & endocervical cancer | Female | <65 | III/IV | Unknown | Unknown | SD | |
| LPAR2 | SNV | Missense_Mutation | c.686N>G | p.His229Arg | p.H229R | Q9HBW0 | protein_coding | tolerated(0.21) | benign(0.326) | TCGA-AA-3715-01 | Colorectum | colon adenocarcinoma | Male | >=65 | I/II | Unknown | Unknown | PD | |
| LPAR2 | SNV | Missense_Mutation | c.242C>T | p.Ala81Val | p.A81V | Q9HBW0 | protein_coding | deleterious(0) | probably_damaging(0.997) | TCGA-AD-5900-01 | Colorectum | colon adenocarcinoma | Male | >=65 | I/II | Unknown | Unknown | SD | |
| LPAR2 | SNV | Missense_Mutation | c.1012A>G | p.Met338Val | p.M338V | Q9HBW0 | protein_coding | tolerated(0.42) | benign(0) | TCGA-AY-6197-01 | Colorectum | colon adenocarcinoma | Male | <65 | I/II | Unknown | Unknown | SD | |
| LPAR2 | SNV | Missense_Mutation | rs575876718 | c.124N>A | p.Val42Ile | p.V42I | Q9HBW0 | protein_coding | tolerated(0.22) | possibly_damaging(0.459) | TCGA-NH-A5IV-01 | Colorectum | colon adenocarcinoma | Female | >=65 | I/II | Unknown | Unknown | SD |
| LPAR2 | SNV | Missense_Mutation | novel | c.731T>C | p.Val244Ala | p.V244A | Q9HBW0 | protein_coding | tolerated(0.14) | benign(0.06) | TCGA-A5-A0G1-01 | Endometrium | uterine corpus endometrioid carcinoma | Female | >=65 | I/II | Unknown | Unknown | SD |
| Page: 1 2 3 4 5 |
Top |
Related drugs of malignant transformation related genes |
| Identification of chemicals and drugs interact with genes involved in malignant transfromation |
| (DGIdb 4.0) |
| Entrez ID | Symbol | Category | Interaction Types | Drug Claim Name | Drug Name | PMIDs |
| 9170 | LPAR2 | DRUGGABLE GENOME, G PROTEIN COUPLED RECEPTOR, CELL SURFACE | antagonist | 135650457 | ||
| 9170 | LPAR2 | DRUGGABLE GENOME, G PROTEIN COUPLED RECEPTOR, CELL SURFACE | CAFFEINE | CAFFEINE | 10199823 | |
| 9170 | LPAR2 | DRUGGABLE GENOME, G PROTEIN COUPLED RECEPTOR, CELL SURFACE | agonist | 178103194 | ||
| 9170 | LPAR2 | DRUGGABLE GENOME, G PROTEIN COUPLED RECEPTOR, CELL SURFACE | agonist | 135651509 | ||
| 9170 | LPAR2 | DRUGGABLE GENOME, G PROTEIN COUPLED RECEPTOR, CELL SURFACE | agonist | 178100857 | ||
| 9170 | LPAR2 | DRUGGABLE GENOME, G PROTEIN COUPLED RECEPTOR, CELL SURFACE | agonist | 178100856 | ||
| 9170 | LPAR2 | DRUGGABLE GENOME, G PROTEIN COUPLED RECEPTOR, CELL SURFACE | agonist | 135651487 | ||
| 9170 | LPAR2 | DRUGGABLE GENOME, G PROTEIN COUPLED RECEPTOR, CELL SURFACE | agonist | 135649710 | ||
| 9170 | LPAR2 | DRUGGABLE GENOME, G PROTEIN COUPLED RECEPTOR, CELL SURFACE | MORPHINE | MORPHINE | 17090705 | |
| 9170 | LPAR2 | DRUGGABLE GENOME, G PROTEIN COUPLED RECEPTOR, CELL SURFACE | OCTREOTIDE | OCTREOTIDE | 18624922 |
| Page: 1 2 |

Copyright 2023-Present -The University of Texas Health Science Center at Houston |