
|
|||||
|
 | |
| |
| |
| |
| |
| |
|
Gene: LIME1 |
Gene summary for LIME1 |
| Gene information | Species | Human | Gene symbol | LIME1 | Gene ID | 54923 |
| Gene name | Lck interacting transmembrane adaptor 1 | |
| Gene Alias | LIME | |
| Cytomap | 20q13.33 | |
| Gene Type | protein-coding | GO ID | GO:0001932 | UniProtAcc | A0A087WT39 |
Top |
Malignant transformation analysis |
| Identification of the aberrant gene expression in precancerous and cancerous lesions by comparing the gene expression of stem-like cells in diseased tissues with normal stem cells |
| Entrez ID | Symbol | Replicates | Species | Organ | Tissue | Adj P-value | Log2FC | Malignancy |
| 54923 | LIME1 | Pat02-B | Human | Stomach | GC | 1.98e-09 | 1.92e-01 | 0.0368 |
| 54923 | LIME1 | Pat03-B | Human | Stomach | GC | 8.68e-03 | 1.10e-01 | 0.3693 |
| 54923 | LIME1 | Pat04-B | Human | Stomach | GC | 1.01e-24 | 5.18e-01 | -0.1483 |
| 54923 | LIME1 | Pat05-B | Human | Stomach | GC | 3.56e-13 | 3.58e-01 | -0.0353 |
| 54923 | LIME1 | Pat06-B | Human | Stomach | GC | 1.17e-27 | 4.49e-01 | -0.1961 |
| 54923 | LIME1 | Pat07-B | Human | Stomach | GC | 1.10e-07 | 2.97e-01 | 0.0935 |
| 54923 | LIME1 | Pat08-B | Human | Stomach | GC | 1.69e-02 | 2.00e-01 | 0.0182 |
| 54923 | LIME1 | Pat09-B | Human | Stomach | GC | 8.28e-03 | 1.20e-01 | -0.0359 |
| 54923 | LIME1 | Pat10-B | Human | Stomach | GC | 1.01e-08 | 4.06e-01 | 0.084 |
| 54923 | LIME1 | Pat11-B | Human | Stomach | GC | 8.08e-26 | 5.90e-01 | -0.182 |
| 54923 | LIME1 | Pat13-B | Human | Stomach | GC | 9.64e-05 | 2.04e-01 | 0.0555 |
| 54923 | LIME1 | Pat15-B | Human | Stomach | GC | 7.16e-11 | 2.94e-01 | -0.0778 |
| 54923 | LIME1 | Pat18-B | Human | Stomach | GC | 7.19e-20 | 3.78e-01 | -0.0432 |
| 54923 | LIME1 | Pat19-B | Human | Stomach | GC | 1.08e-03 | 1.69e-01 | 0.0826 |
| 54923 | LIME1 | Pat22-B | Human | Stomach | GC | 1.15e-18 | 3.09e-01 | -0.1042 |
| 54923 | LIME1 | Pat24-B | Human | Stomach | GC | 2.66e-08 | 3.20e-01 | -0.1184 |
| 54923 | LIME1 | Pat25-A | Human | Stomach | CAG with IM | 1.87e-35 | 4.78e-01 | -0.1648 |
| 54923 | LIME1 | Pat26-A | Human | Stomach | CSG | 1.85e-27 | 4.37e-01 | -0.2402 |
| 54923 | LIME1 | Pat28-A | Human | Stomach | CSG | 1.48e-17 | 4.03e-01 | -0.2594 |
| 54923 | LIME1 | Pat29-A | Human | Stomach | CAG with IM | 1.22e-10 | 4.01e-01 | -0.2769 |
| Page: 1 2 3 |
| Tissue | Expression Dynamics | Abbreviation |
| Esophagus | 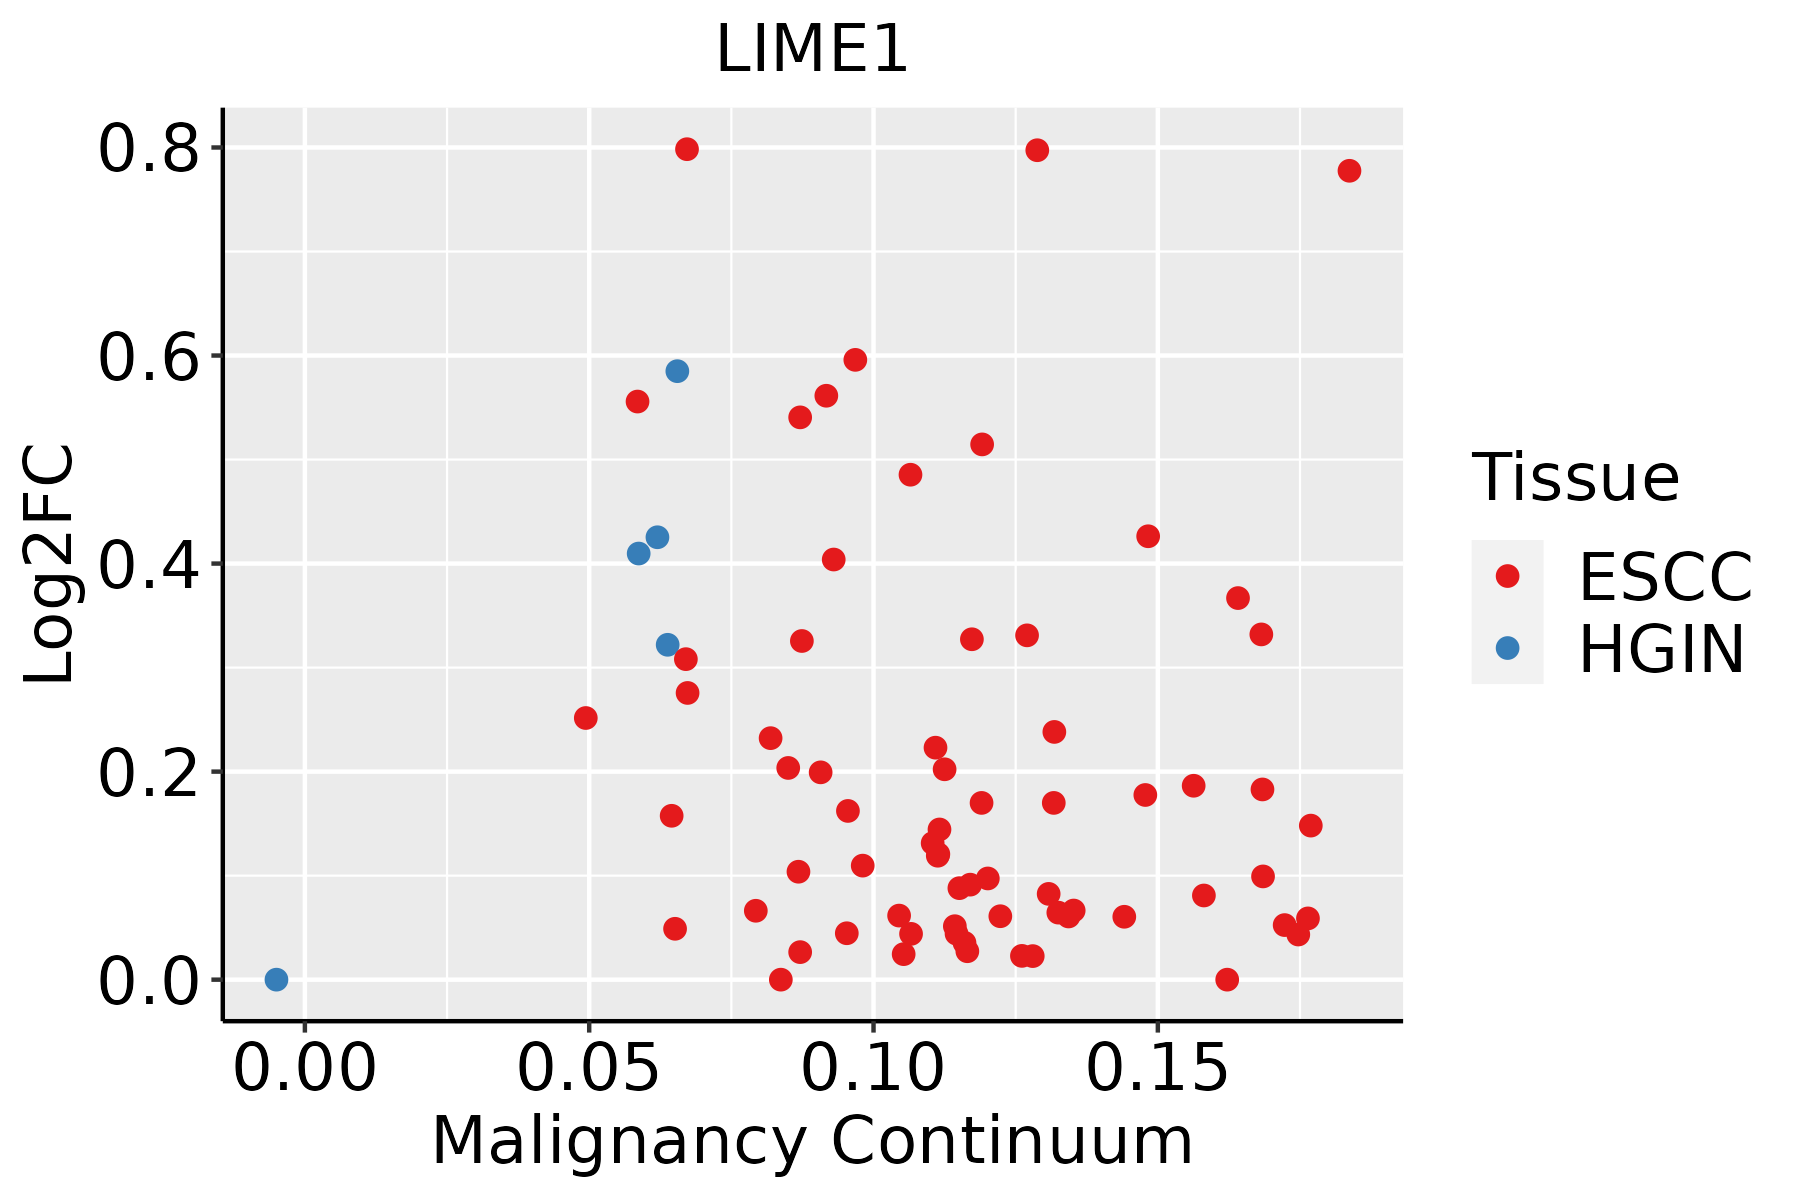 | ESCC: Esophageal squamous cell carcinoma |
| HGIN: High-grade intraepithelial neoplasias | ||
| LGIN: Low-grade intraepithelial neoplasias | ||
| GC | 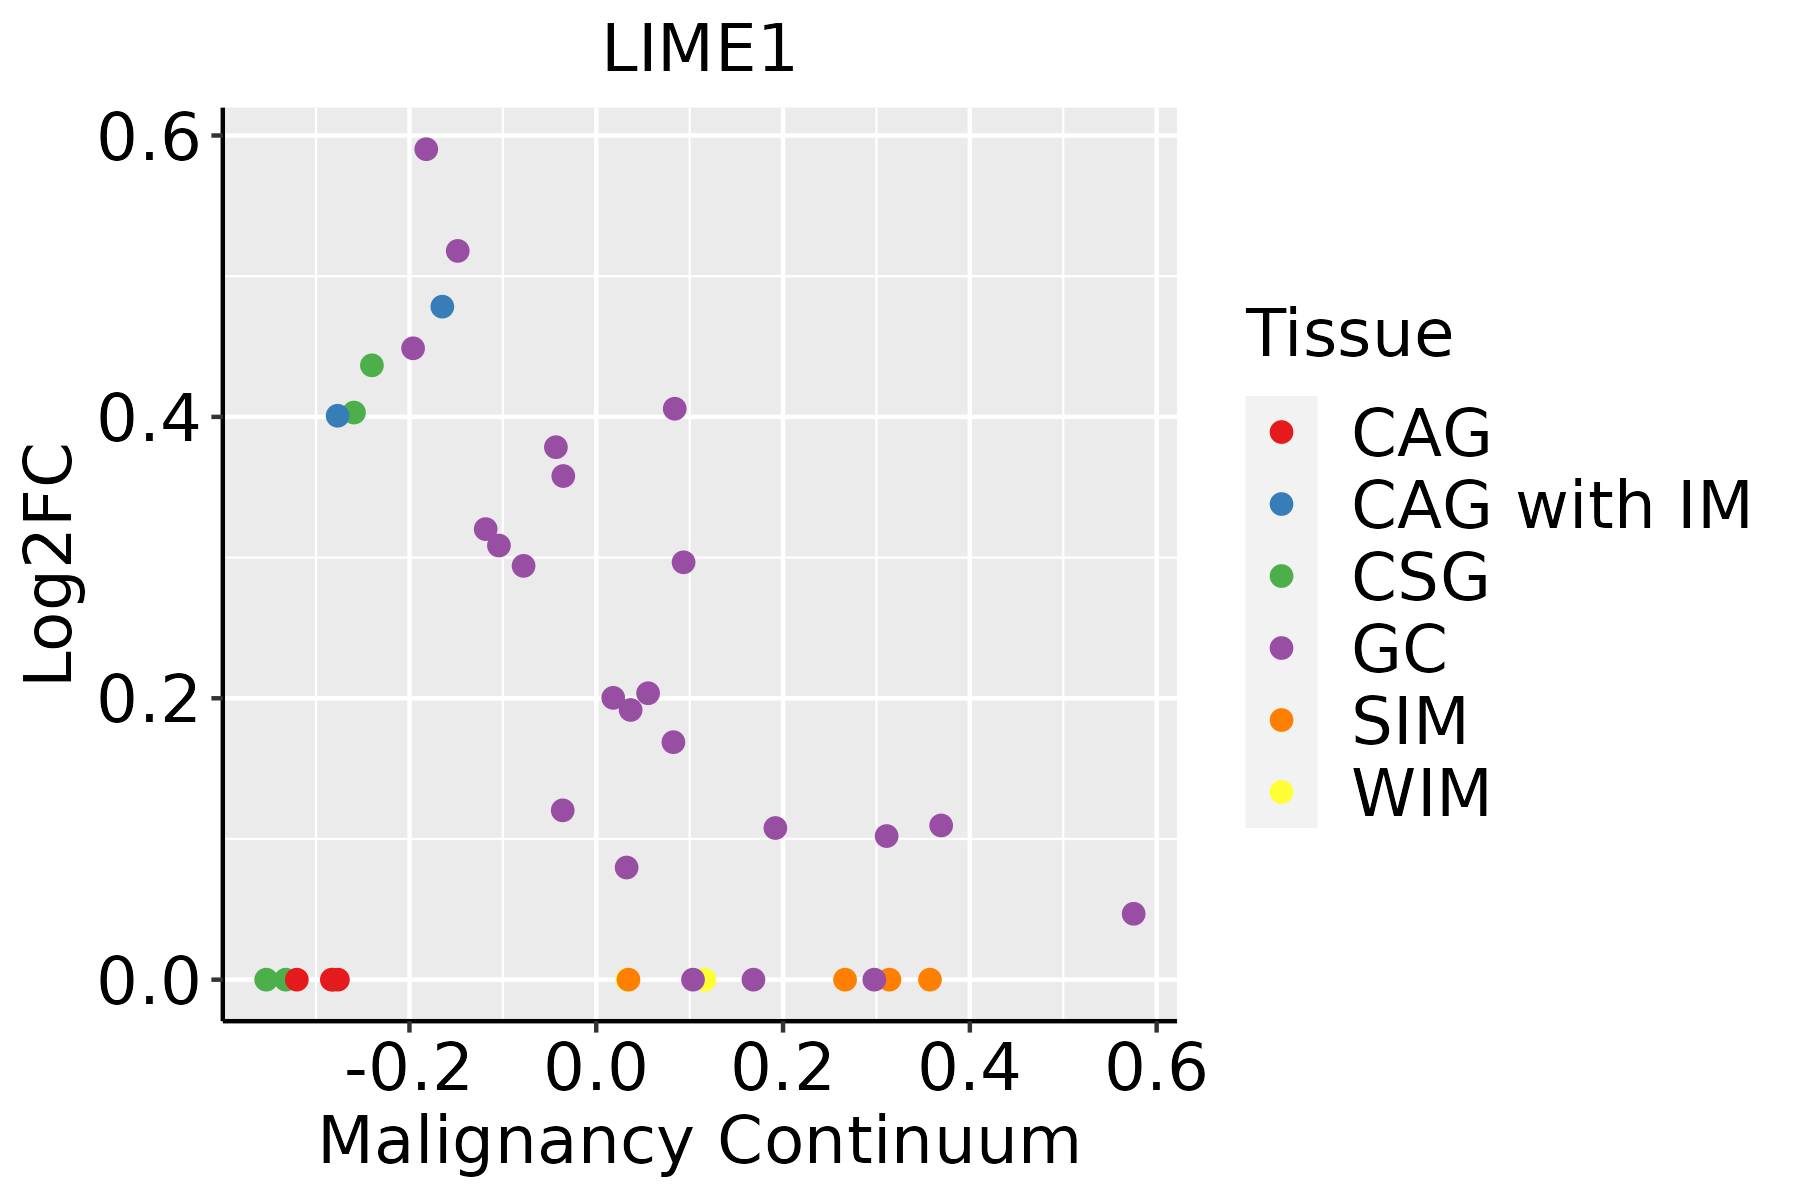 | CAG: Chronic atrophic gastritis |
| CAG with IM: Chronic atrophic gastritis with intestinal metaplasia | ||
| CSG: Chronic superficial gastritis | ||
| GC: Gastric cancer | ||
| SIM: Severe intestinal metaplasia | ||
| WIM: Wild intestinal metaplasia | ||
| Liver | 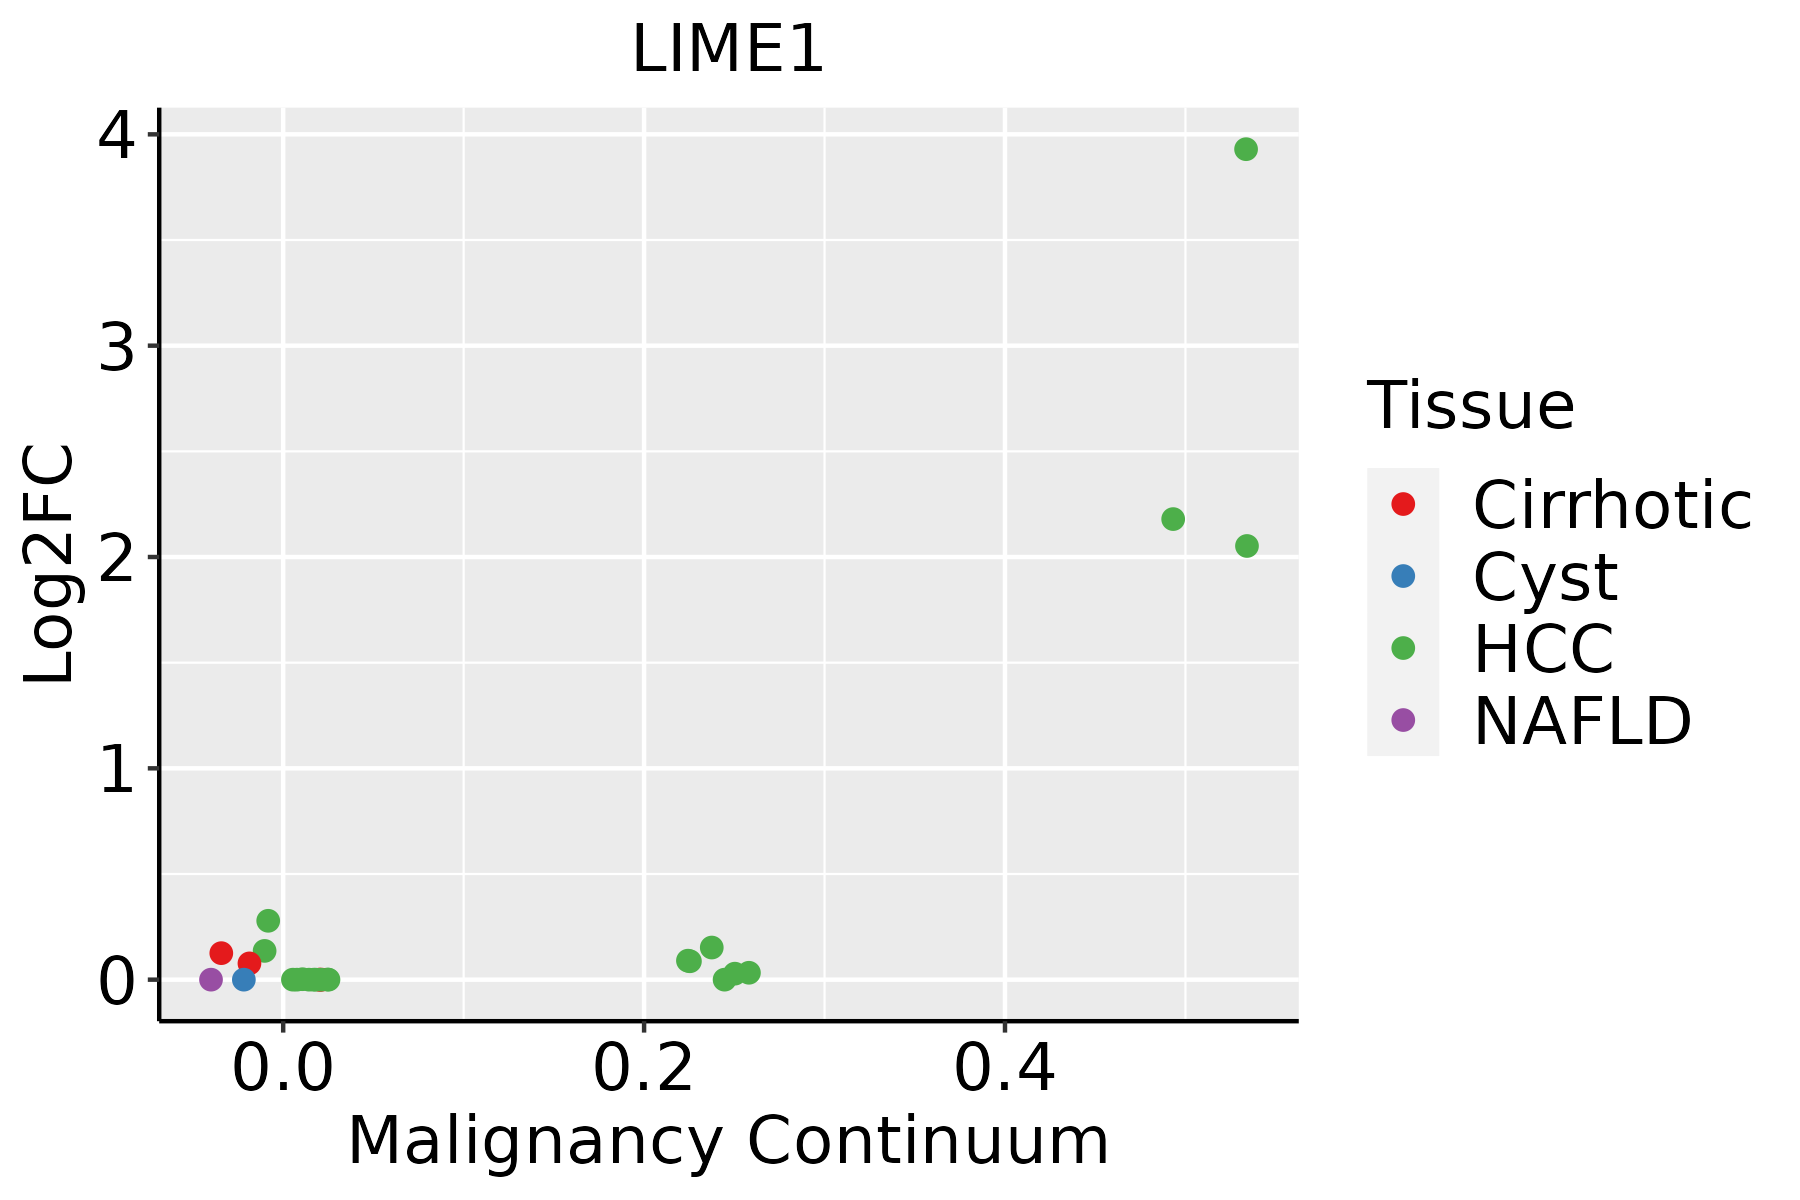 | HCC: Hepatocellular carcinoma |
| NAFLD: Non-alcoholic fatty liver disease |
| ∗log2FC in expression of this searched gene in stem-like cells from each diseased tissue sample relative to stem-like cells in normal samples in each tissue plotted against the malignancy continuum. Samples are colored based on if they are from different disease stage. |
Top |
Malignant transformation related pathway analysis |
| Find out the enriched GO biological processes and KEGG pathways involved in transition from healthy to precancer to cancer |
| Tissue | Disease Stage | Enriched GO biological Processes |
| Colorectum | AD |  |
| Colorectum | SER |  |
| Colorectum | MSS |  |
| Colorectum | MSI-H |  |
| Colorectum | FAP |  |
| ∗Top 15 enriched GO BP terms are showed in the bar plot of each disease state in each tissue. Each row represents a significant GO biological process which is colored according to the -log10(p.adjust). |
| Page: 1 2 3 4 5 6 7 8 9 |
| GO ID | Tissue | Disease Stage | Description | Gene Ratio | Bg Ratio | pvalue | p.adjust | Count |
| GO:004312220 | Esophagus | HGIN | regulation of I-kappaB kinase/NF-kappaB signaling | 63/2587 | 249/18723 | 8.91e-07 | 3.61e-05 | 63 |
| GO:000724918 | Esophagus | HGIN | I-kappaB kinase/NF-kappaB signaling | 67/2587 | 281/18723 | 3.84e-06 | 1.29e-04 | 67 |
| GO:005165126 | Esophagus | HGIN | maintenance of location in cell | 53/2587 | 214/18723 | 1.22e-05 | 3.45e-04 | 53 |
| GO:005123520 | Esophagus | HGIN | maintenance of location | 73/2587 | 327/18723 | 1.73e-05 | 4.71e-04 | 73 |
| GO:0043122110 | Esophagus | ESCC | regulation of I-kappaB kinase/NF-kappaB signaling | 167/8552 | 249/18723 | 6.11e-12 | 2.32e-10 | 167 |
| GO:007190016 | Esophagus | ESCC | regulation of protein serine/threonine kinase activity | 227/8552 | 359/18723 | 1.12e-11 | 4.10e-10 | 227 |
| GO:000724919 | Esophagus | ESCC | I-kappaB kinase/NF-kappaB signaling | 183/8552 | 281/18723 | 3.02e-11 | 1.01e-09 | 183 |
| GO:0051235110 | Esophagus | ESCC | maintenance of location | 200/8552 | 327/18723 | 1.01e-08 | 2.02e-07 | 200 |
| GO:0051651111 | Esophagus | ESCC | maintenance of location in cell | 126/8552 | 214/18723 | 6.57e-05 | 5.00e-04 | 126 |
| GO:00434055 | Esophagus | ESCC | regulation of MAP kinase activity | 102/8552 | 177/18723 | 8.89e-04 | 4.55e-03 | 102 |
| GO:00508528 | Esophagus | ESCC | T cell receptor signaling pathway | 73/8552 | 123/18723 | 1.54e-03 | 7.24e-03 | 73 |
| GO:00380615 | Esophagus | ESCC | NIK/NF-kappaB signaling | 81/8552 | 143/18723 | 5.33e-03 | 2.00e-02 | 81 |
| GO:005123521 | Liver | HCC | maintenance of location | 185/7958 | 327/18723 | 1.70e-07 | 3.12e-06 | 185 |
| GO:000724912 | Liver | HCC | I-kappaB kinase/NF-kappaB signaling | 156/7958 | 281/18723 | 6.66e-06 | 8.00e-05 | 156 |
| GO:004312212 | Liver | HCC | regulation of I-kappaB kinase/NF-kappaB signaling | 138/7958 | 249/18723 | 2.47e-05 | 2.58e-04 | 138 |
| GO:007190021 | Liver | HCC | regulation of protein serine/threonine kinase activity | 189/7958 | 359/18723 | 5.97e-05 | 5.47e-04 | 189 |
| GO:005165112 | Liver | HCC | maintenance of location in cell | 119/7958 | 214/18723 | 7.11e-05 | 6.39e-04 | 119 |
| GO:00380611 | Liver | HCC | NIK/NF-kappaB signaling | 77/7958 | 143/18723 | 3.98e-03 | 1.76e-02 | 77 |
| GO:19012221 | Liver | HCC | regulation of NIK/NF-kappaB signaling | 60/7958 | 112/18723 | 1.17e-02 | 4.28e-02 | 60 |
| GO:0051235 | Stomach | GC | maintenance of location | 41/1159 | 327/18723 | 1.33e-05 | 4.35e-04 | 41 |
| Page: 1 2 3 |
| Pathway ID | Tissue | Disease Stage | Description | Gene Ratio | Bg Ratio | pvalue | p.adjust | qvalue | Count |
| Page: 1 |
Top |
Cell-cell communication analysis |
| Identification of potential cell-cell interactions between two cell types and their ligand-receptor pairs for different disease states |
| Ligand | Receptor | LRpair | Pathway | Tissue | Disease Stage |
| Page: 1 |
Top |
Single-cell gene regulatory network inference analysis |
| Find out the significant the regulons (TFs) and the target genes of each regulon across cell types for different disease states |
| TF | Cell Type | Tissue | Disease Stage | Target Gene | RSS | Regulon Activity |
| ∗The dot plots of a searched regulon are shown for all cell subpopulations in each disease state of each tissue based on the regulon specific score inferred using pySCENIC and by calculating the average expression. |
| Page: 1 |
Top |
Somatic mutation of malignant transformation related genes |
| Annotation of somatic variants for genes involved in malignant transformation |
| Hugo Symbol | Variant Class | Variant Classification | dbSNP RS | HGVSc | HGVSp | HGVSp Short | SWISSPROT | BIOTYPE | SIFT | PolyPhen | Tumor Sample Barcode | Tissue | Histology | Sex | Age | Stage | Therapy Types | Drugs | Outcome |
| LIME1 | SNV | Missense_Mutation | c.580N>A | p.Ala194Thr | p.A194T | Q9H400 | protein_coding | tolerated(0.67) | benign(0.006) | TCGA-G4-6588-01 | Colorectum | colon adenocarcinoma | Female | <65 | I/II | Unknown | Unknown | SD | |
| LIME1 | SNV | Missense_Mutation | novel | c.445N>T | p.Gly149Trp | p.G149W | Q9H400 | protein_coding | deleterious(0.01) | probably_damaging(1) | TCGA-AJ-A3OJ-01 | Endometrium | uterine corpus endometrioid carcinoma | Female | <65 | I/II | Chemotherapy | carboplatin | CR |
| LIME1 | SNV | Missense_Mutation | novel | c.646G>T | p.Asp216Tyr | p.D216Y | Q9H400 | protein_coding | deleterious(0.01) | possibly_damaging(0.808) | TCGA-B5-A3FC-01 | Endometrium | uterine corpus endometrioid carcinoma | Female | <65 | I/II | Unknown | Unknown | SD |
| LIME1 | SNV | Missense_Mutation | rs776251119 | c.716C>T | p.Pro239Leu | p.P239L | Q9H400 | protein_coding | deleterious(0.03) | benign(0.014) | TCGA-D1-A1NZ-01 | Endometrium | uterine corpus endometrioid carcinoma | Female | <65 | I/II | Unknown | Unknown | SD |
| LIME1 | SNV | Missense_Mutation | novel | c.517C>T | p.Arg173Cys | p.R173C | Q9H400 | protein_coding | tolerated(0.12) | possibly_damaging(0.735) | TCGA-FI-A2D0-01 | Endometrium | uterine corpus endometrioid carcinoma | Female | <65 | I/II | Unknown | Unknown | SD |
| LIME1 | deletion | Frame_Shift_Del | novel | c.487delG | p.Val163TrpfsTer28 | p.V163Wfs*28 | Q9H400 | protein_coding | TCGA-DI-A1BU-01 | Endometrium | uterine corpus endometrioid carcinoma | Female | <65 | I/II | Chemotherapy | paclitaxel | SD | ||
| LIME1 | SNV | Missense_Mutation | c.127N>T | p.Arg43Trp | p.R43W | Q9H400 | protein_coding | deleterious(0.01) | benign(0.038) | TCGA-86-8358-01 | Lung | lung adenocarcinoma | Male | <65 | I/II | Unknown | Unknown | SD | |
| LIME1 | SNV | Missense_Mutation | novel | c.86C>T | p.Thr29Ile | p.T29I | Q9H400 | protein_coding | deleterious(0) | possibly_damaging(0.744) | TCGA-NC-A5HG-01 | Lung | lung squamous cell carcinoma | Male | <65 | III/IV | Chemotherapy | cisplatin | CR |
| LIME1 | SNV | Missense_Mutation | rs774768440 | c.592N>A | p.Val198Ile | p.V198I | Q9H400 | protein_coding | tolerated(1) | benign(0.003) | TCGA-BA-A6DI-01 | Oral cavity | head & neck squamous cell carcinoma | Male | <65 | I/II | Chemotherapy | cisplatin | PD |
| LIME1 | SNV | Missense_Mutation | c.656N>G | p.Asp219Gly | p.D219G | Q9H400 | protein_coding | tolerated(0.11) | benign(0.003) | TCGA-EJ-A65M-01 | Prostate | prostate adenocarcinoma | Male | >=65 | 6 | Unknown | Unknown | SD |
| Page: 1 |
Top |
Related drugs of malignant transformation related genes |
| Identification of chemicals and drugs interact with genes involved in malignant transfromation |
| (DGIdb 4.0) |
| Entrez ID | Symbol | Category | Interaction Types | Drug Claim Name | Drug Name | PMIDs |
| Page: 1 |

Copyright 2023-Present -The University of Texas Health Science Center at Houston |