
|
|||||
|
 | |
| |
| |
| |
| |
| |
|
Gene: LCORL |
Gene summary for LCORL |
| Gene information | Species | Human | Gene symbol | LCORL | Gene ID | 254251 |
| Gene name | ligand dependent nuclear receptor corepressor like | |
| Gene Alias | MLR1 | |
| Cytomap | 4p15.31 | |
| Gene Type | protein-coding | GO ID | GO:0006139 | UniProtAcc | Q8N3X6 |
Top |
Malignant transformation analysis |
| Identification of the aberrant gene expression in precancerous and cancerous lesions by comparing the gene expression of stem-like cells in diseased tissues with normal stem cells |
| Entrez ID | Symbol | Replicates | Species | Organ | Tissue | Adj P-value | Log2FC | Malignancy |
| 254251 | LCORL | NAFLD1 | Human | Liver | NAFLD | 1.47e-05 | 6.13e-01 | -0.04 |
| 254251 | LCORL | HCC1_Meng | Human | Liver | HCC | 8.34e-17 | -7.60e-02 | 0.0246 |
| 254251 | LCORL | HCC2_Meng | Human | Liver | HCC | 1.48e-11 | 8.73e-03 | 0.0107 |
| 254251 | LCORL | HCC2 | Human | Liver | HCC | 8.09e-05 | 3.45e+00 | 0.5341 |
| 254251 | LCORL | Pt14.a | Human | Liver | HCC | 4.96e-03 | 2.51e-01 | 0.0169 |
| 254251 | LCORL | S028 | Human | Liver | HCC | 6.15e-05 | 3.58e-01 | 0.2503 |
| 254251 | LCORL | RNA-P17T-P17T-2 | Human | Lung | IAC | 3.61e-03 | 4.70e-01 | 0.3371 |
| 254251 | LCORL | RNA-P17T-P17T-6 | Human | Lung | IAC | 1.50e-04 | 6.84e-01 | 0.3385 |
| 254251 | LCORL | RNA-P25T1-P25T1-1 | Human | Lung | AIS | 6.00e-09 | 5.17e-01 | -0.2116 |
| 254251 | LCORL | RNA-P25T1-P25T1-2 | Human | Lung | AIS | 3.53e-02 | 5.10e-01 | -0.1941 |
| 254251 | LCORL | RNA-P25T1-P25T1-3 | Human | Lung | AIS | 4.75e-02 | 4.56e-01 | -0.2107 |
| 254251 | LCORL | RNA-P25T1-P25T1-4 | Human | Lung | AIS | 4.05e-06 | 4.23e-01 | -0.2119 |
| 254251 | LCORL | RNA-P6T1-P6T1-1 | Human | Lung | MIAC | 3.42e-02 | 7.37e-01 | -0.0238 |
| 254251 | LCORL | RNA-P6T2-P6T2-1 | Human | Lung | IAC | 2.46e-09 | 4.27e-01 | -0.0166 |
| 254251 | LCORL | RNA-P6T2-P6T2-2 | Human | Lung | IAC | 3.02e-12 | 4.77e-01 | -0.0132 |
| 254251 | LCORL | RNA-P6T2-P6T2-3 | Human | Lung | IAC | 8.76e-14 | 4.51e-01 | -0.013 |
| 254251 | LCORL | RNA-P6T2-P6T2-4 | Human | Lung | IAC | 4.23e-06 | 3.33e-01 | -0.0121 |
| 254251 | LCORL | C21 | Human | Oral cavity | OSCC | 2.04e-08 | 3.90e-01 | 0.2678 |
| 254251 | LCORL | C30 | Human | Oral cavity | OSCC | 1.05e-10 | 5.70e-01 | 0.3055 |
| 254251 | LCORL | C43 | Human | Oral cavity | OSCC | 1.08e-02 | 9.50e-02 | 0.1704 |
| Page: 1 2 3 4 5 |
| Tissue | Expression Dynamics | Abbreviation |
| Colorectum (GSE201348) |  | FAP: Familial adenomatous polyposis |
| CRC: Colorectal cancer | ||
| Colorectum (HTA11) |  | AD: Adenomas |
| SER: Sessile serrated lesions | ||
| MSI-H: Microsatellite-high colorectal cancer | ||
| MSS: Microsatellite stable colorectal cancer | ||
| Liver | 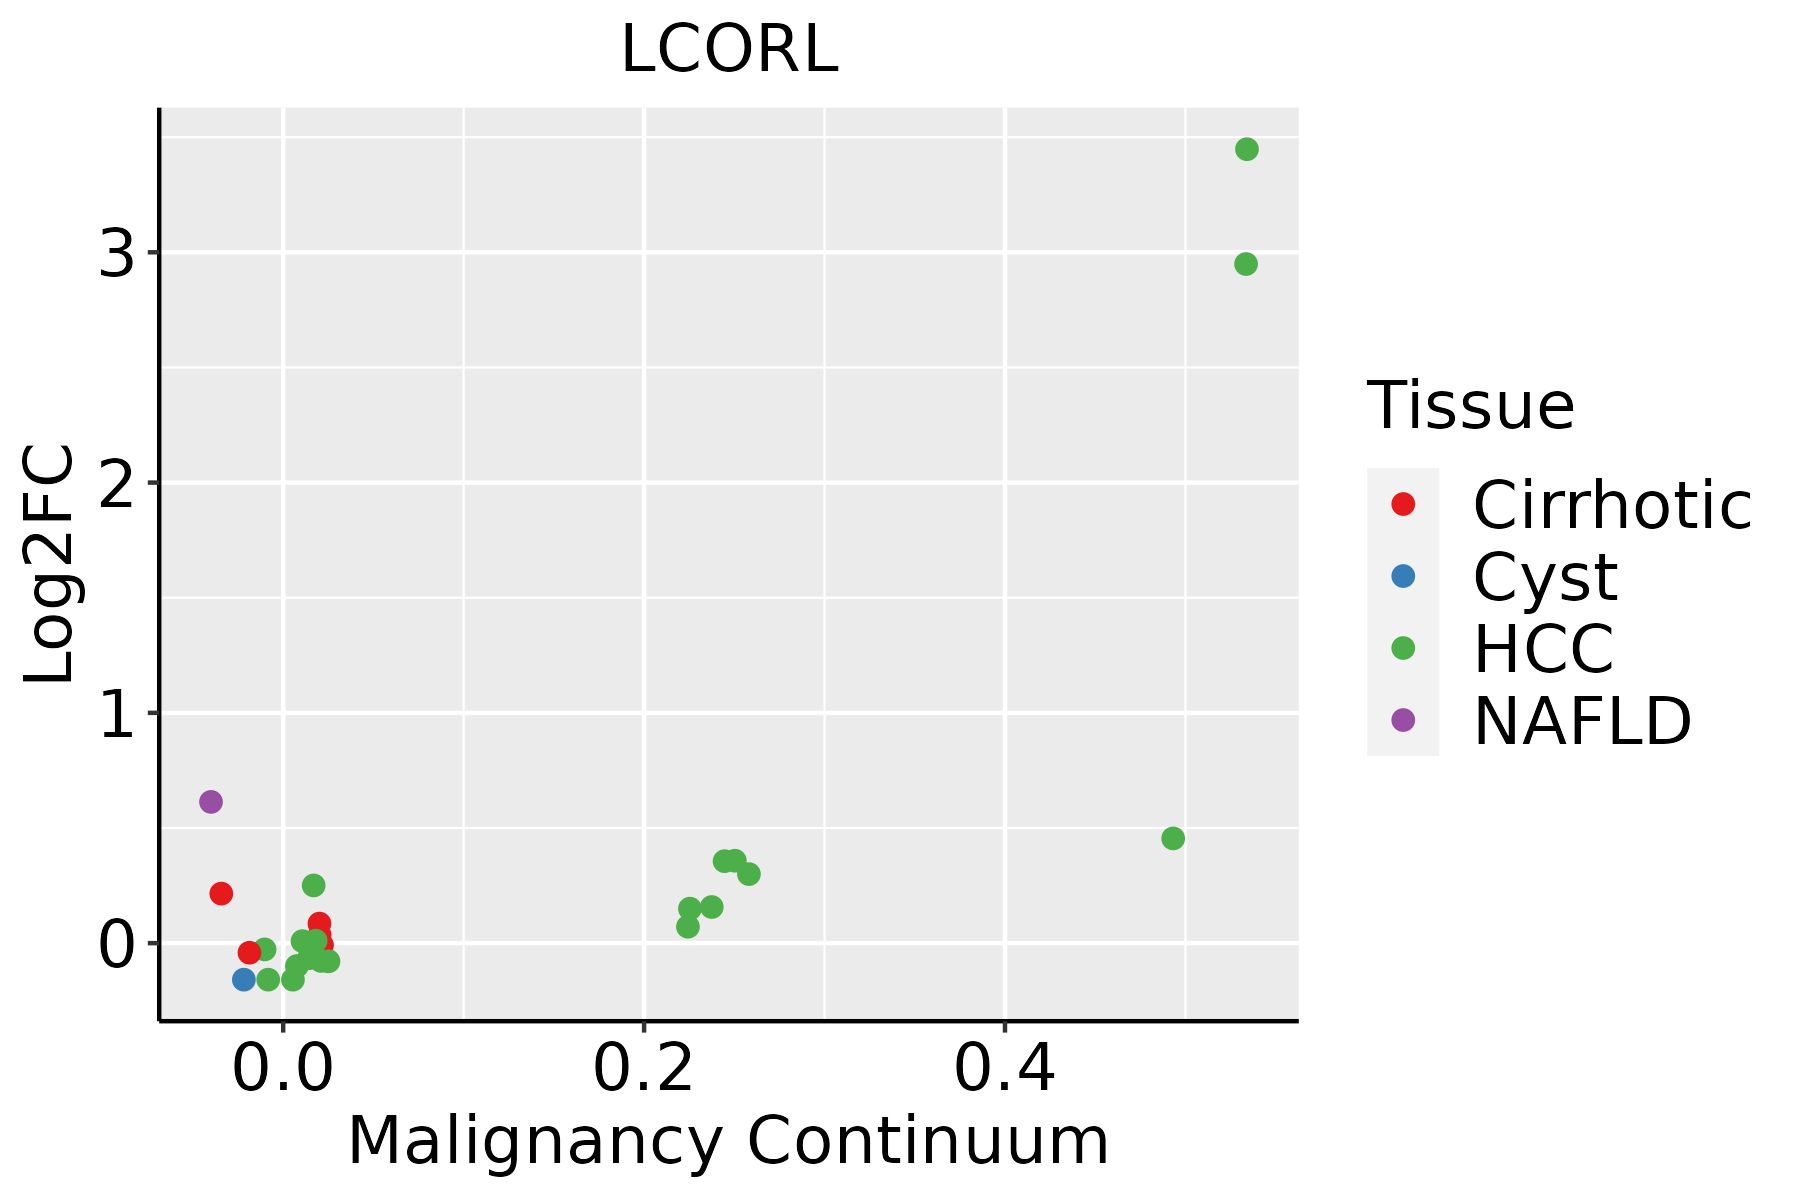 | HCC: Hepatocellular carcinoma |
| NAFLD: Non-alcoholic fatty liver disease | ||
| Lung | 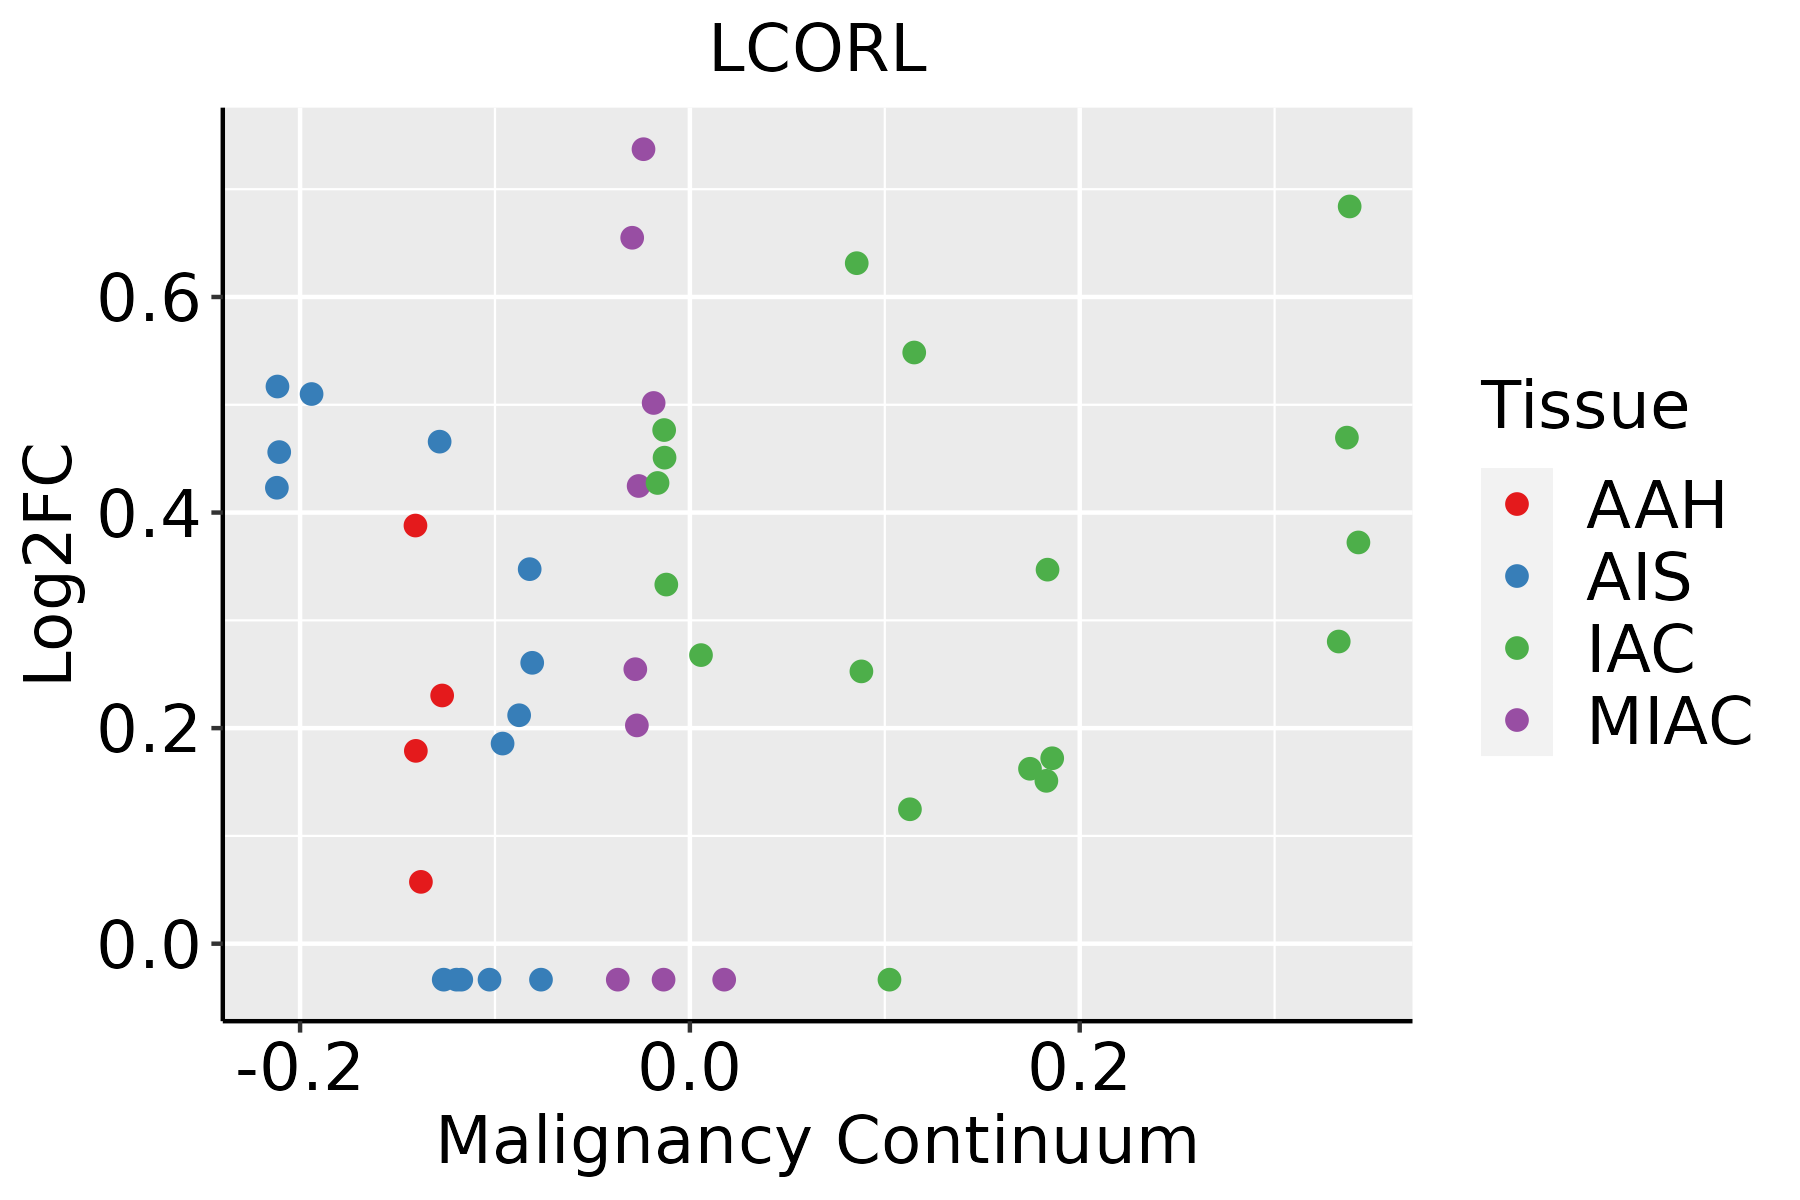 | AAH: Atypical adenomatous hyperplasia |
| AIS: Adenocarcinoma in situ | ||
| IAC: Invasive lung adenocarcinoma | ||
| MIA: Minimally invasive adenocarcinoma | ||
| Oral Cavity |  | EOLP: Erosive Oral lichen planus |
| LP: leukoplakia | ||
| NEOLP: Non-erosive oral lichen planus | ||
| OSCC: Oral squamous cell carcinoma | ||
| Thyroid | 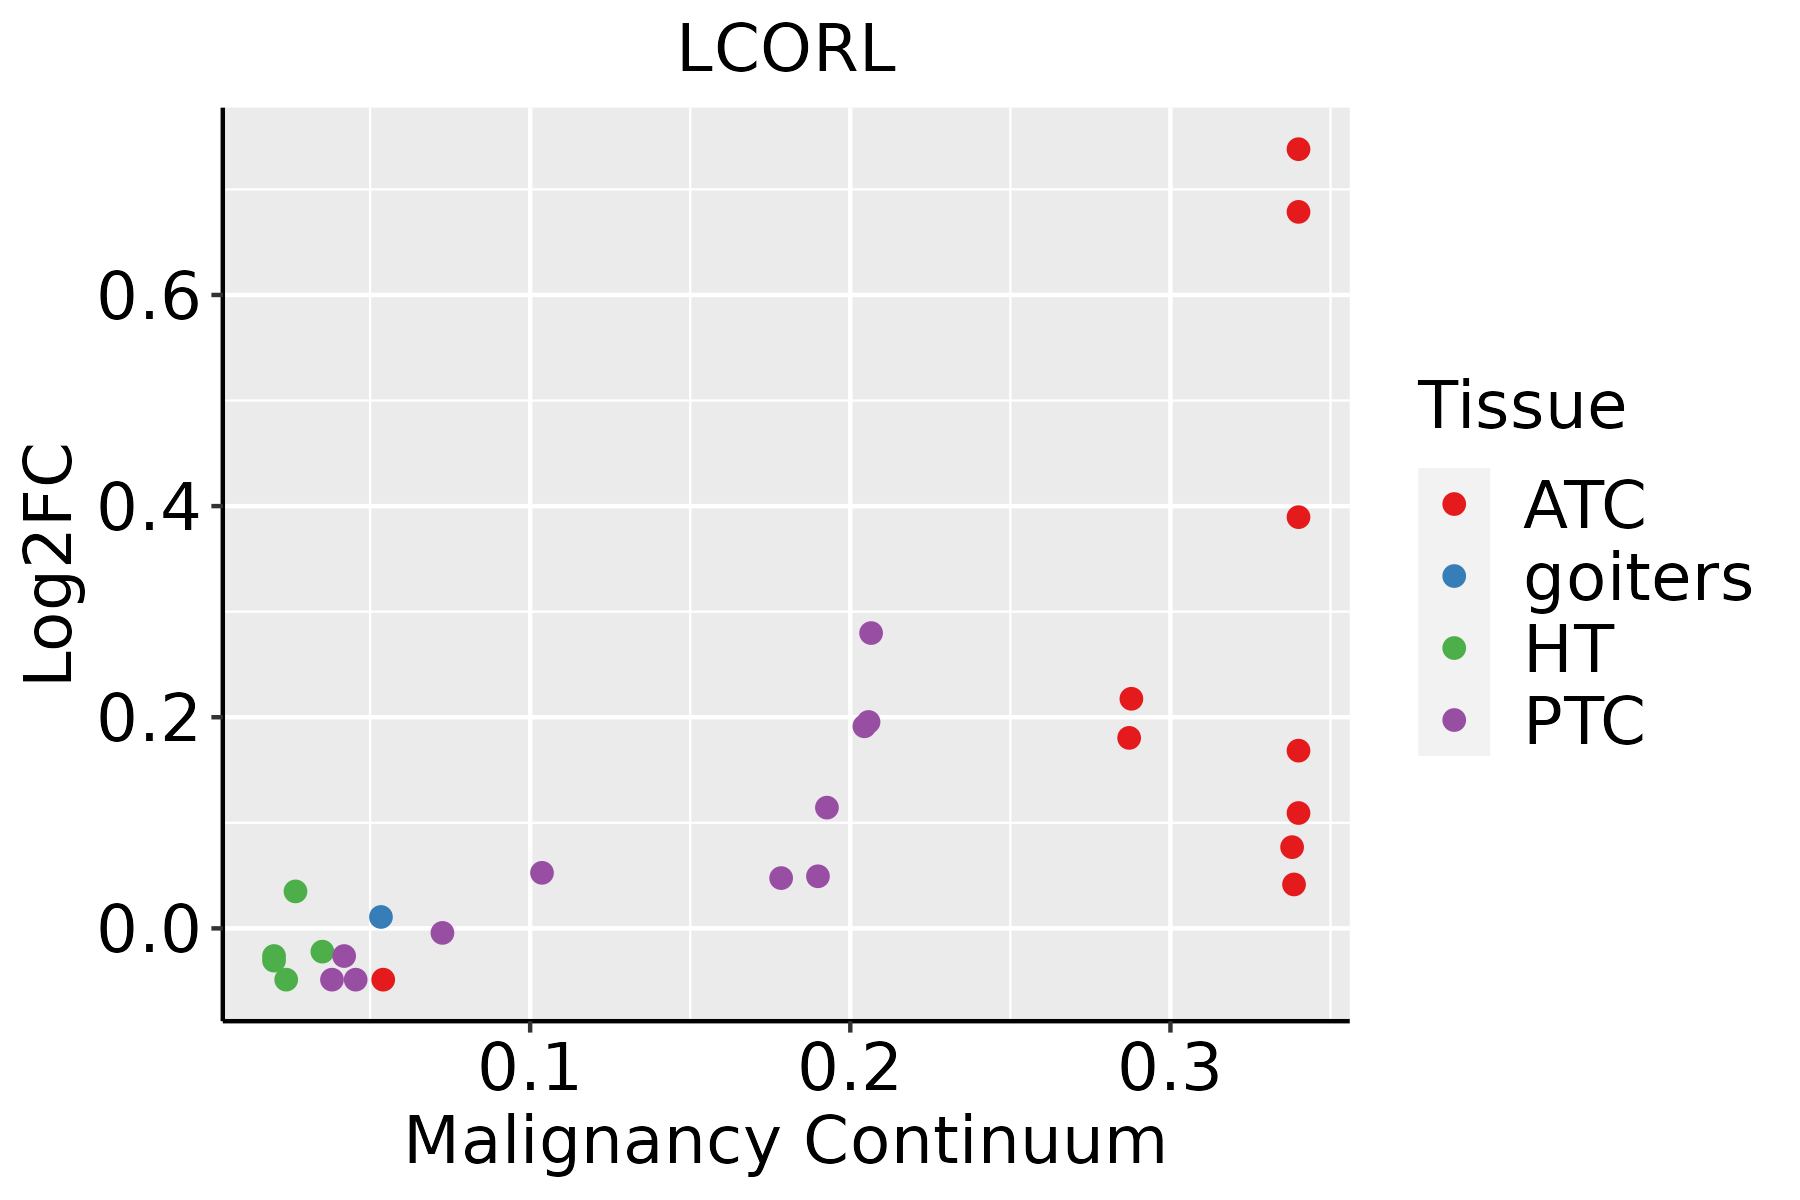 | ATC: Anaplastic thyroid cancer |
| HT: Hashimoto's thyroiditis | ||
| PTC: Papillary thyroid cancer |
| ∗log2FC in expression of this searched gene in stem-like cells from each diseased tissue sample relative to stem-like cells in normal samples in each tissue plotted against the malignancy continuum. Samples are colored based on if they are from different disease stage. |
Top |
Malignant transformation related pathway analysis |
| Find out the enriched GO biological processes and KEGG pathways involved in transition from healthy to precancer to cancer |
| Tissue | Disease Stage | Enriched GO biological Processes |
| Colorectum | AD |  |
| Colorectum | SER |  |
| Colorectum | MSS |  |
| Colorectum | MSI-H |  |
| Colorectum | FAP |  |
| ∗Top 15 enriched GO BP terms are showed in the bar plot of each disease state in each tissue. Each row represents a significant GO biological process which is colored according to the -log10(p.adjust). |
| Page: 1 2 3 4 5 6 7 8 9 |
| GO ID | Tissue | Disease Stage | Description | Gene Ratio | Bg Ratio | pvalue | p.adjust | Count |
| Page: 1 |
| Pathway ID | Tissue | Disease Stage | Description | Gene Ratio | Bg Ratio | pvalue | p.adjust | qvalue | Count |
| Page: 1 |
Top |
Cell-cell communication analysis |
| Identification of potential cell-cell interactions between two cell types and their ligand-receptor pairs for different disease states |
| Ligand | Receptor | LRpair | Pathway | Tissue | Disease Stage |
| Page: 1 |
Top |
Single-cell gene regulatory network inference analysis |
| Find out the significant the regulons (TFs) and the target genes of each regulon across cell types for different disease states |
| TF | Cell Type | Tissue | Disease Stage | Target Gene | RSS | Regulon Activity |
| ∗The dot plots of a searched regulon are shown for all cell subpopulations in each disease state of each tissue based on the regulon specific score inferred using pySCENIC and by calculating the average expression. |
| Page: 1 |
Top |
Somatic mutation of malignant transformation related genes |
| Annotation of somatic variants for genes involved in malignant transformation |
| Hugo Symbol | Variant Class | Variant Classification | dbSNP RS | HGVSc | HGVSp | HGVSp Short | SWISSPROT | BIOTYPE | SIFT | PolyPhen | Tumor Sample Barcode | Tissue | Histology | Sex | Age | Stage | Therapy Types | Drugs | Outcome |
| LCORL | SNV | Missense_Mutation | novel | c.4658N>C | p.Arg1553Thr | p.R1553T | protein_coding | deleterious(0) | probably_damaging(0.994) | TCGA-AC-A5XS-01 | Breast | breast invasive carcinoma | Female | >=65 | I/II | Hormone Therapy | femara | SD | |
| LCORL | SNV | Missense_Mutation | novel | c.4462N>A | p.Glu1488Lys | p.E1488K | protein_coding | deleterious(0.02) | probably_damaging(0.922) | TCGA-AC-A5XS-01 | Breast | breast invasive carcinoma | Female | >=65 | I/II | Hormone Therapy | femara | SD | |
| LCORL | SNV | Missense_Mutation | c.1535G>A | p.Ser512Asn | p.S512N | Q8N3X6 | protein_coding | tolerated(0.98) | benign(0) | TCGA-E9-A1N9-01 | Breast | breast invasive carcinoma | Female | <65 | I/II | Chemotherapy | doxorubicin | SD | |
| LCORL | SNV | Missense_Mutation | novel | c.4459N>T | p.Leu1487Phe | p.L1487F | protein_coding | tolerated(0.16) | benign(0.182) | TCGA-EW-A6SA-01 | Breast | breast invasive carcinoma | Male | <65 | I/II | Unknown | Unknown | SD | |
| LCORL | insertion | Frame_Shift_Ins | novel | c.456_457insGTAGGACTGAGTC | p.Ile153ValfsTer23 | p.I153Vfs*23 | Q8N3X6 | protein_coding | TCGA-AO-A0JJ-01 | Breast | breast invasive carcinoma | Female | <65 | I/II | Chemotherapy | cyclophospamide | SD | ||
| LCORL | insertion | Frame_Shift_Ins | novel | c.1506_1507insTTTTCAGTTTTTGGAGAGCTGATCCTTCTAGG | p.Thr503PhefsTer16 | p.T503Ffs*16 | Q8N3X6 | protein_coding | TCGA-BH-A0HQ-01 | Breast | breast invasive carcinoma | Female | <65 | I/II | Hormone Therapy | arimidex | SD | ||
| LCORL | SNV | Missense_Mutation | c.1769N>T | p.Ser590Leu | p.S590L | Q8N3X6 | protein_coding | deleterious_low_confidence(0) | possibly_damaging(0.598) | TCGA-JW-A5VL-01 | Cervix | cervical & endocervical cancer | Female | <65 | I/II | Unknown | Unknown | SD | |
| LCORL | SNV | Missense_Mutation | novel | c.1298T>C | p.Leu433Ser | p.L433S | Q8N3X6 | protein_coding | tolerated(0.25) | benign(0.398) | TCGA-MA-AA42-01 | Cervix | cervical & endocervical cancer | Female | >=65 | I/II | Unknown | Unknown | SD |
| LCORL | SNV | Missense_Mutation | rs765209311 | c.1253G>A | p.Arg418Gln | p.R418Q | Q8N3X6 | protein_coding | deleterious(0) | possibly_damaging(0.795) | TCGA-PN-A8MA-01 | Cervix | cervical & endocervical cancer | Female | <65 | I/II | Chemotherapy | cisplatin | SD |
| LCORL | SNV | Missense_Mutation | novel | c.4137N>C | p.Lys1379Asn | p.K1379N | protein_coding | tolerated(1) | benign(0.048) | TCGA-VS-A957-01 | Cervix | cervical & endocervical cancer | Female | <65 | I/II | Chemotherapy | cisplatin | CR |
| Page: 1 2 3 4 5 6 7 8 9 |
Top |
Related drugs of malignant transformation related genes |
| Identification of chemicals and drugs interact with genes involved in malignant transfromation |
| (DGIdb 4.0) |
| Entrez ID | Symbol | Category | Interaction Types | Drug Claim Name | Drug Name | PMIDs |
| Page: 1 |

Copyright 2023-Present -The University of Texas Health Science Center at Houston |