
|
|||||
|
 | |
| |
| |
| |
| |
| |
|
Gene: LCLAT1 |
Gene summary for LCLAT1 |
| Gene information | Species | Human | Gene symbol | LCLAT1 | Gene ID | 253558 |
| Gene name | lysocardiolipin acyltransferase 1 | |
| Gene Alias | 1AGPAT8 | |
| Cytomap | 2p23.1 | |
| Gene Type | protein-coding | GO ID | GO:0006629 | UniProtAcc | Q6UWP7 |
Top |
Malignant transformation analysis |
| Identification of the aberrant gene expression in precancerous and cancerous lesions by comparing the gene expression of stem-like cells in diseased tissues with normal stem cells |
| Entrez ID | Symbol | Replicates | Species | Organ | Tissue | Adj P-value | Log2FC | Malignancy |
| 253558 | LCLAT1 | LZE2T | Human | Esophagus | ESCC | 9.54e-06 | 4.52e-01 | 0.082 |
| 253558 | LCLAT1 | LZE4T | Human | Esophagus | ESCC | 9.56e-12 | 4.01e-01 | 0.0811 |
| 253558 | LCLAT1 | LZE7T | Human | Esophagus | ESCC | 6.33e-03 | 1.63e-01 | 0.0667 |
| 253558 | LCLAT1 | LZE24T | Human | Esophagus | ESCC | 5.64e-10 | 2.25e-01 | 0.0596 |
| 253558 | LCLAT1 | P1T-E | Human | Esophagus | ESCC | 5.20e-08 | 3.17e-01 | 0.0875 |
| 253558 | LCLAT1 | P2T-E | Human | Esophagus | ESCC | 4.49e-25 | 4.11e-01 | 0.1177 |
| 253558 | LCLAT1 | P4T-E | Human | Esophagus | ESCC | 2.81e-13 | 2.96e-01 | 0.1323 |
| 253558 | LCLAT1 | P5T-E | Human | Esophagus | ESCC | 7.39e-09 | 1.74e-01 | 0.1327 |
| 253558 | LCLAT1 | P8T-E | Human | Esophagus | ESCC | 5.56e-10 | 2.18e-01 | 0.0889 |
| 253558 | LCLAT1 | P9T-E | Human | Esophagus | ESCC | 4.72e-09 | 2.14e-01 | 0.1131 |
| 253558 | LCLAT1 | P10T-E | Human | Esophagus | ESCC | 9.64e-20 | 3.45e-01 | 0.116 |
| 253558 | LCLAT1 | P11T-E | Human | Esophagus | ESCC | 1.72e-04 | 1.94e-01 | 0.1426 |
| 253558 | LCLAT1 | P12T-E | Human | Esophagus | ESCC | 1.45e-15 | 3.66e-01 | 0.1122 |
| 253558 | LCLAT1 | P15T-E | Human | Esophagus | ESCC | 4.29e-21 | 4.30e-01 | 0.1149 |
| 253558 | LCLAT1 | P16T-E | Human | Esophagus | ESCC | 1.46e-14 | 2.82e-01 | 0.1153 |
| 253558 | LCLAT1 | P17T-E | Human | Esophagus | ESCC | 8.50e-05 | 1.77e-01 | 0.1278 |
| 253558 | LCLAT1 | P20T-E | Human | Esophagus | ESCC | 1.39e-16 | 3.39e-01 | 0.1124 |
| 253558 | LCLAT1 | P21T-E | Human | Esophagus | ESCC | 2.53e-18 | 3.78e-01 | 0.1617 |
| 253558 | LCLAT1 | P22T-E | Human | Esophagus | ESCC | 6.15e-20 | 3.11e-01 | 0.1236 |
| 253558 | LCLAT1 | P23T-E | Human | Esophagus | ESCC | 7.44e-14 | 2.90e-01 | 0.108 |
| Page: 1 2 3 4 5 6 |
| Tissue | Expression Dynamics | Abbreviation |
| Cervix |  | CC: Cervix cancer |
| HSIL_HPV: HPV-infected high-grade squamous intraepithelial lesions | ||
| N_HPV: HPV-infected normal cervix | ||
| Colorectum (GSE201348) |  | FAP: Familial adenomatous polyposis |
| CRC: Colorectal cancer | ||
| Colorectum (HTA11) |  | AD: Adenomas |
| SER: Sessile serrated lesions | ||
| MSI-H: Microsatellite-high colorectal cancer | ||
| MSS: Microsatellite stable colorectal cancer | ||
| Esophagus | 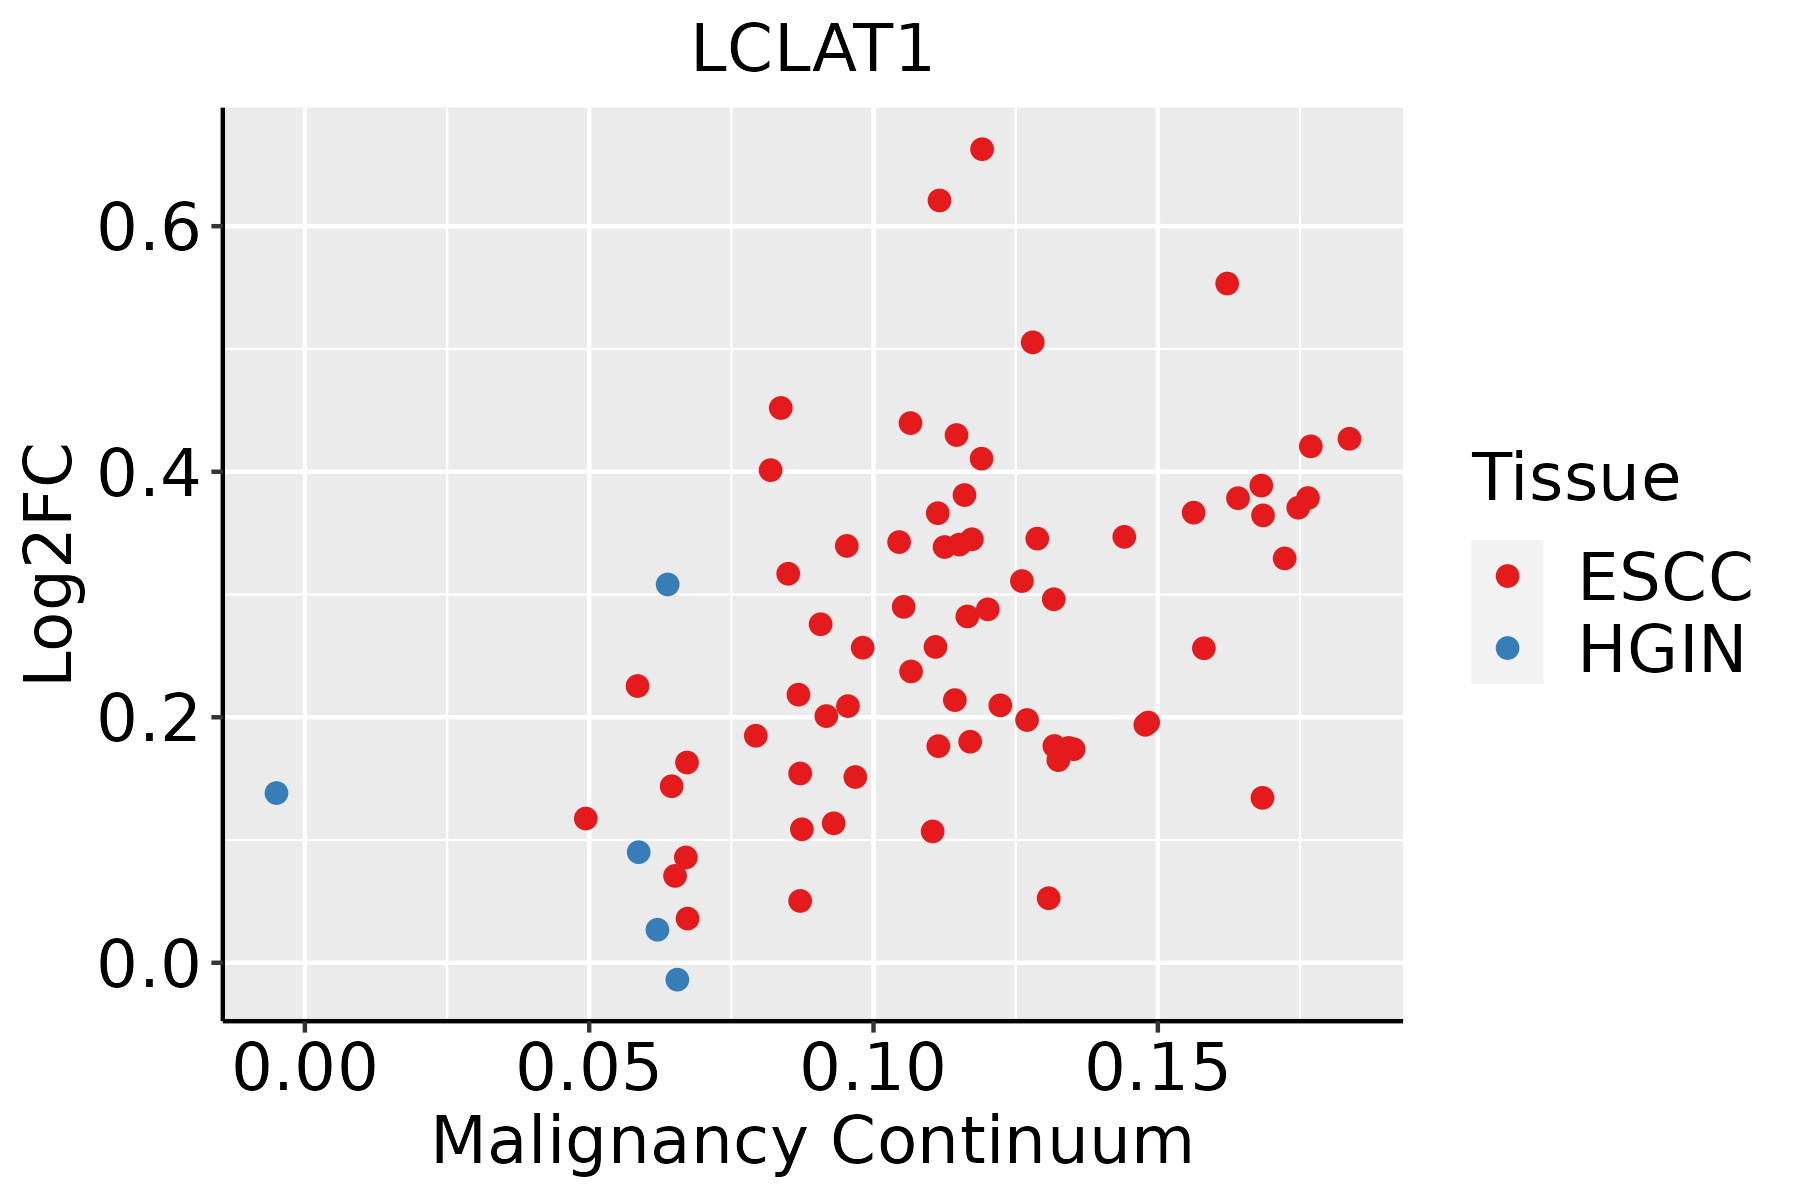 | ESCC: Esophageal squamous cell carcinoma |
| HGIN: High-grade intraepithelial neoplasias | ||
| LGIN: Low-grade intraepithelial neoplasias | ||
| Liver |  | HCC: Hepatocellular carcinoma |
| NAFLD: Non-alcoholic fatty liver disease |
| ∗log2FC in expression of this searched gene in stem-like cells from each diseased tissue sample relative to stem-like cells in normal samples in each tissue plotted against the malignancy continuum. Samples are colored based on if they are from different disease stage. |
Top |
Malignant transformation related pathway analysis |
| Find out the enriched GO biological processes and KEGG pathways involved in transition from healthy to precancer to cancer |
| Tissue | Disease Stage | Enriched GO biological Processes |
| Colorectum | AD |  |
| Colorectum | SER |  |
| Colorectum | MSS |  |
| Colorectum | MSI-H |  |
| Colorectum | FAP |  |
| ∗Top 15 enriched GO BP terms are showed in the bar plot of each disease state in each tissue. Each row represents a significant GO biological process which is colored according to the -log10(p.adjust). |
| Page: 1 2 3 4 5 6 7 8 9 |
| GO ID | Tissue | Disease Stage | Description | Gene Ratio | Bg Ratio | pvalue | p.adjust | Count |
| GO:0006650 | Colorectum | AD | glycerophospholipid metabolic process | 83/3918 | 306/18723 | 5.40e-03 | 3.55e-02 | 83 |
| GO:0006644 | Colorectum | AD | phospholipid metabolic process | 101/3918 | 383/18723 | 5.80e-03 | 3.67e-02 | 101 |
| GO:0045017 | Colorectum | AD | glycerolipid biosynthetic process | 69/3918 | 252/18723 | 8.33e-03 | 4.88e-02 | 69 |
| GO:0008654 | Colorectum | FAP | phospholipid biosynthetic process | 54/2622 | 253/18723 | 8.88e-04 | 9.08e-03 | 54 |
| GO:00066502 | Colorectum | FAP | glycerophospholipid metabolic process | 62/2622 | 306/18723 | 1.54e-03 | 1.38e-02 | 62 |
| GO:00066442 | Colorectum | FAP | phospholipid metabolic process | 74/2622 | 383/18723 | 2.24e-03 | 1.83e-02 | 74 |
| GO:0046473 | Colorectum | FAP | phosphatidic acid metabolic process | 12/2622 | 37/18723 | 3.43e-03 | 2.48e-02 | 12 |
| GO:0046474 | Colorectum | FAP | glycerophospholipid biosynthetic process | 44/2622 | 211/18723 | 3.98e-03 | 2.76e-02 | 44 |
| GO:00450172 | Colorectum | FAP | glycerolipid biosynthetic process | 50/2622 | 252/18723 | 6.32e-03 | 3.95e-02 | 50 |
| GO:00086541 | Colorectum | CRC | phospholipid biosynthetic process | 49/2078 | 253/18723 | 7.07e-05 | 1.51e-03 | 49 |
| GO:00066503 | Colorectum | CRC | glycerophospholipid metabolic process | 55/2078 | 306/18723 | 2.10e-04 | 3.55e-03 | 55 |
| GO:00450173 | Colorectum | CRC | glycerolipid biosynthetic process | 47/2078 | 252/18723 | 2.47e-04 | 4.06e-03 | 47 |
| GO:00066443 | Colorectum | CRC | phospholipid metabolic process | 65/2078 | 383/18723 | 3.21e-04 | 4.95e-03 | 65 |
| GO:00464741 | Colorectum | CRC | glycerophospholipid biosynthetic process | 40/2078 | 211/18723 | 4.91e-04 | 7.02e-03 | 40 |
| GO:00464861 | Colorectum | CRC | glycerolipid metabolic process | 64/2078 | 392/18723 | 1.01e-03 | 1.19e-02 | 64 |
| GO:00464731 | Colorectum | CRC | phosphatidic acid metabolic process | 10/2078 | 37/18723 | 5.78e-03 | 4.31e-02 | 10 |
| GO:00086544 | Esophagus | ESCC | phospholipid biosynthetic process | 162/8552 | 253/18723 | 2.59e-09 | 5.73e-08 | 162 |
| GO:00464744 | Esophagus | ESCC | glycerophospholipid biosynthetic process | 135/8552 | 211/18723 | 5.75e-08 | 1.02e-06 | 135 |
| GO:00450175 | Esophagus | ESCC | glycerolipid biosynthetic process | 154/8552 | 252/18723 | 5.20e-07 | 6.96e-06 | 154 |
| GO:00066446 | Esophagus | ESCC | phospholipid metabolic process | 218/8552 | 383/18723 | 5.37e-06 | 5.59e-05 | 218 |
| Page: 1 2 |
| Pathway ID | Tissue | Disease Stage | Description | Gene Ratio | Bg Ratio | pvalue | p.adjust | qvalue | Count |
| hsa00561 | Colorectum | AD | Glycerolipid metabolism | 24/2092 | 63/8465 | 1.25e-02 | 4.54e-02 | 2.90e-02 | 24 |
| hsa005611 | Colorectum | AD | Glycerolipid metabolism | 24/2092 | 63/8465 | 1.25e-02 | 4.54e-02 | 2.90e-02 | 24 |
| hsa005612 | Colorectum | MSS | Glycerolipid metabolism | 23/1875 | 63/8465 | 6.55e-03 | 2.64e-02 | 1.62e-02 | 23 |
| hsa005613 | Colorectum | MSS | Glycerolipid metabolism | 23/1875 | 63/8465 | 6.55e-03 | 2.64e-02 | 1.62e-02 | 23 |
| hsa005615 | Liver | HCC | Glycerolipid metabolism | 41/4020 | 63/8465 | 3.59e-03 | 1.12e-02 | 6.22e-03 | 41 |
| hsa0056112 | Liver | HCC | Glycerolipid metabolism | 41/4020 | 63/8465 | 3.59e-03 | 1.12e-02 | 6.22e-03 | 41 |
| Page: 1 |
Top |
Cell-cell communication analysis |
| Identification of potential cell-cell interactions between two cell types and their ligand-receptor pairs for different disease states |
| Ligand | Receptor | LRpair | Pathway | Tissue | Disease Stage |
| Page: 1 |
Top |
Single-cell gene regulatory network inference analysis |
| Find out the significant the regulons (TFs) and the target genes of each regulon across cell types for different disease states |
| TF | Cell Type | Tissue | Disease Stage | Target Gene | RSS | Regulon Activity |
| ∗The dot plots of a searched regulon are shown for all cell subpopulations in each disease state of each tissue based on the regulon specific score inferred using pySCENIC and by calculating the average expression. |
| Page: 1 |
Top |
Somatic mutation of malignant transformation related genes |
| Annotation of somatic variants for genes involved in malignant transformation |
| Hugo Symbol | Variant Class | Variant Classification | dbSNP RS | HGVSc | HGVSp | HGVSp Short | SWISSPROT | BIOTYPE | SIFT | PolyPhen | Tumor Sample Barcode | Tissue | Histology | Sex | Age | Stage | Therapy Types | Drugs | Outcome |
| LCLAT1 | SNV | Missense_Mutation | rs780206248 | c.547G>A | p.Glu183Lys | p.E183K | Q6UWP7 | protein_coding | tolerated(0.18) | benign(0.106) | TCGA-AA-3977-01 | Colorectum | colon adenocarcinoma | Male | >=65 | I/II | Unknown | Unknown | SD |
| LCLAT1 | SNV | Missense_Mutation | rs769660456 | c.778N>T | p.Ala260Ser | p.A260S | Q6UWP7 | protein_coding | deleterious(0.01) | possibly_damaging(0.889) | TCGA-AA-A010-01 | Colorectum | colon adenocarcinoma | Female | <65 | I/II | Chemotherapy | folinic | CR |
| LCLAT1 | SNV | Missense_Mutation | rs374373733 | c.946N>T | p.Arg316Cys | p.R316C | Q6UWP7 | protein_coding | deleterious(0.01) | benign(0.007) | TCGA-AZ-4315-01 | Colorectum | colon adenocarcinoma | Male | <65 | I/II | Unknown | Unknown | SD |
| LCLAT1 | SNV | Missense_Mutation | c.208N>T | p.Met70Leu | p.M70L | Q6UWP7 | protein_coding | tolerated(0.22) | benign(0.031) | TCGA-AG-3591-01 | Colorectum | rectum adenocarcinoma | Female | >=65 | I/II | Unspecific | Complete Response | ||
| LCLAT1 | SNV | Missense_Mutation | rs750655578 | c.452N>T | p.Ala151Val | p.A151V | Q6UWP7 | protein_coding | deleterious(0.04) | benign(0.196) | TCGA-A5-A0G2-01 | Endometrium | uterine corpus endometrioid carcinoma | Female | <65 | III/IV | Unknown | Unknown | SD |
| LCLAT1 | SNV | Missense_Mutation | novel | c.877C>A | p.Leu293Ile | p.L293I | Q6UWP7 | protein_coding | tolerated(0.22) | benign(0.122) | TCGA-A5-A1OF-01 | Endometrium | uterine corpus endometrioid carcinoma | Female | <65 | I/II | Unknown | Unknown | SD |
| LCLAT1 | SNV | Missense_Mutation | rs745720629 | c.1135N>A | p.Val379Ile | p.V379I | Q6UWP7 | protein_coding | tolerated(0.42) | benign(0) | TCGA-AJ-A3BH-01 | Endometrium | uterine corpus endometrioid carcinoma | Female | Unknown | I/II | Unknown | Unknown | SD |
| LCLAT1 | SNV | Missense_Mutation | novel | c.833N>T | p.Pro278Leu | p.P278L | Q6UWP7 | protein_coding | deleterious(0) | probably_damaging(0.981) | TCGA-AP-A05O-01 | Endometrium | uterine corpus endometrioid carcinoma | Female | >=65 | I/II | Chemotherapy | carboplatin | PD |
| LCLAT1 | SNV | Missense_Mutation | c.154N>C | p.Phe52Leu | p.F52L | Q6UWP7 | protein_coding | tolerated(0.07) | benign(0.018) | TCGA-AP-A0LM-01 | Endometrium | uterine corpus endometrioid carcinoma | Female | <65 | III/IV | Chemotherapy | cisplatin | SD | |
| LCLAT1 | SNV | Missense_Mutation | c.701N>T | p.Arg234Ile | p.R234I | Q6UWP7 | protein_coding | deleterious(0) | probably_damaging(0.995) | TCGA-AP-A0LM-01 | Endometrium | uterine corpus endometrioid carcinoma | Female | <65 | III/IV | Chemotherapy | cisplatin | SD |
| Page: 1 2 3 4 5 |
Top |
Related drugs of malignant transformation related genes |
| Identification of chemicals and drugs interact with genes involved in malignant transfromation |
| (DGIdb 4.0) |
| Entrez ID | Symbol | Category | Interaction Types | Drug Claim Name | Drug Name | PMIDs |
| Page: 1 |

Copyright 2023-Present -The University of Texas Health Science Center at Houston |