
|
|||||
|
 | |
| |
| |
| |
| |
| |
|
Gene: LAPTM4A |
Gene summary for LAPTM4A |
| Gene information | Species | Human | Gene symbol | LAPTM4A | Gene ID | 9741 |
| Gene name | lysosomal protein transmembrane 4 alpha | |
| Gene Alias | HUMORF13 | |
| Cytomap | 2p24.1 | |
| Gene Type | protein-coding | GO ID | GO:0000323 | UniProtAcc | Q15012 |
Top |
Malignant transformation analysis |
| Identification of the aberrant gene expression in precancerous and cancerous lesions by comparing the gene expression of stem-like cells in diseased tissues with normal stem cells |
| Entrez ID | Symbol | Replicates | Species | Organ | Tissue | Adj P-value | Log2FC | Malignancy |
| 9741 | LAPTM4A | CA_HPV_1 | Human | Cervix | CC | 6.66e-16 | -5.17e-01 | 0.0264 |
| 9741 | LAPTM4A | CA_HPV_3 | Human | Cervix | CC | 4.63e-03 | 1.52e-01 | 0.0414 |
| 9741 | LAPTM4A | N_HPV_2 | Human | Cervix | N_HPV | 4.50e-02 | -6.02e-02 | -0.0131 |
| 9741 | LAPTM4A | CCI_1 | Human | Cervix | CC | 5.85e-08 | -7.63e-01 | 0.528 |
| 9741 | LAPTM4A | CCI_3 | Human | Cervix | CC | 3.18e-11 | -7.75e-01 | 0.516 |
| 9741 | LAPTM4A | CCII_1 | Human | Cervix | CC | 1.85e-30 | -9.86e-01 | 0.3249 |
| 9741 | LAPTM4A | sample3 | Human | Cervix | CC | 1.59e-07 | 2.06e-01 | 0.1387 |
| 9741 | LAPTM4A | H2 | Human | Cervix | HSIL_HPV | 7.85e-07 | -4.17e-01 | 0.0632 |
| 9741 | LAPTM4A | L1 | Human | Cervix | CC | 1.39e-10 | -4.61e-01 | 0.0802 |
| 9741 | LAPTM4A | T1 | Human | Cervix | CC | 1.02e-07 | -4.47e-01 | 0.0918 |
| 9741 | LAPTM4A | T3 | Human | Cervix | CC | 8.35e-11 | 2.14e-01 | 0.1389 |
| 9741 | LAPTM4A | HTA11_1938_2000001011 | Human | Colorectum | AD | 8.29e-03 | 4.71e-01 | -0.0811 |
| 9741 | LAPTM4A | HTA11_78_2000001011 | Human | Colorectum | AD | 1.06e-09 | 6.35e-01 | -0.1088 |
| 9741 | LAPTM4A | HTA11_347_2000001011 | Human | Colorectum | AD | 9.80e-07 | 5.01e-01 | -0.1954 |
| 9741 | LAPTM4A | HTA11_2992_2000001011 | Human | Colorectum | SER | 2.90e-05 | 6.78e-01 | -0.1706 |
| 9741 | LAPTM4A | HTA11_5212_2000001011 | Human | Colorectum | AD | 2.91e-02 | 5.92e-01 | -0.2061 |
| 9741 | LAPTM4A | HTA11_866_3004761011 | Human | Colorectum | AD | 6.75e-04 | 3.75e-01 | 0.096 |
| 9741 | LAPTM4A | HTA11_6801_2000001011 | Human | Colorectum | SER | 3.47e-04 | 7.54e-01 | 0.0171 |
| 9741 | LAPTM4A | HTA11_7469_2000001011 | Human | Colorectum | AD | 3.08e-04 | 9.08e-01 | -0.0124 |
| 9741 | LAPTM4A | HTA11_99999970781_79442 | Human | Colorectum | MSS | 8.64e-34 | 9.18e-01 | 0.294 |
| Page: 1 2 3 4 5 6 7 8 9 10 11 12 13 14 15 |
| Tissue | Expression Dynamics | Abbreviation |
| Breast | 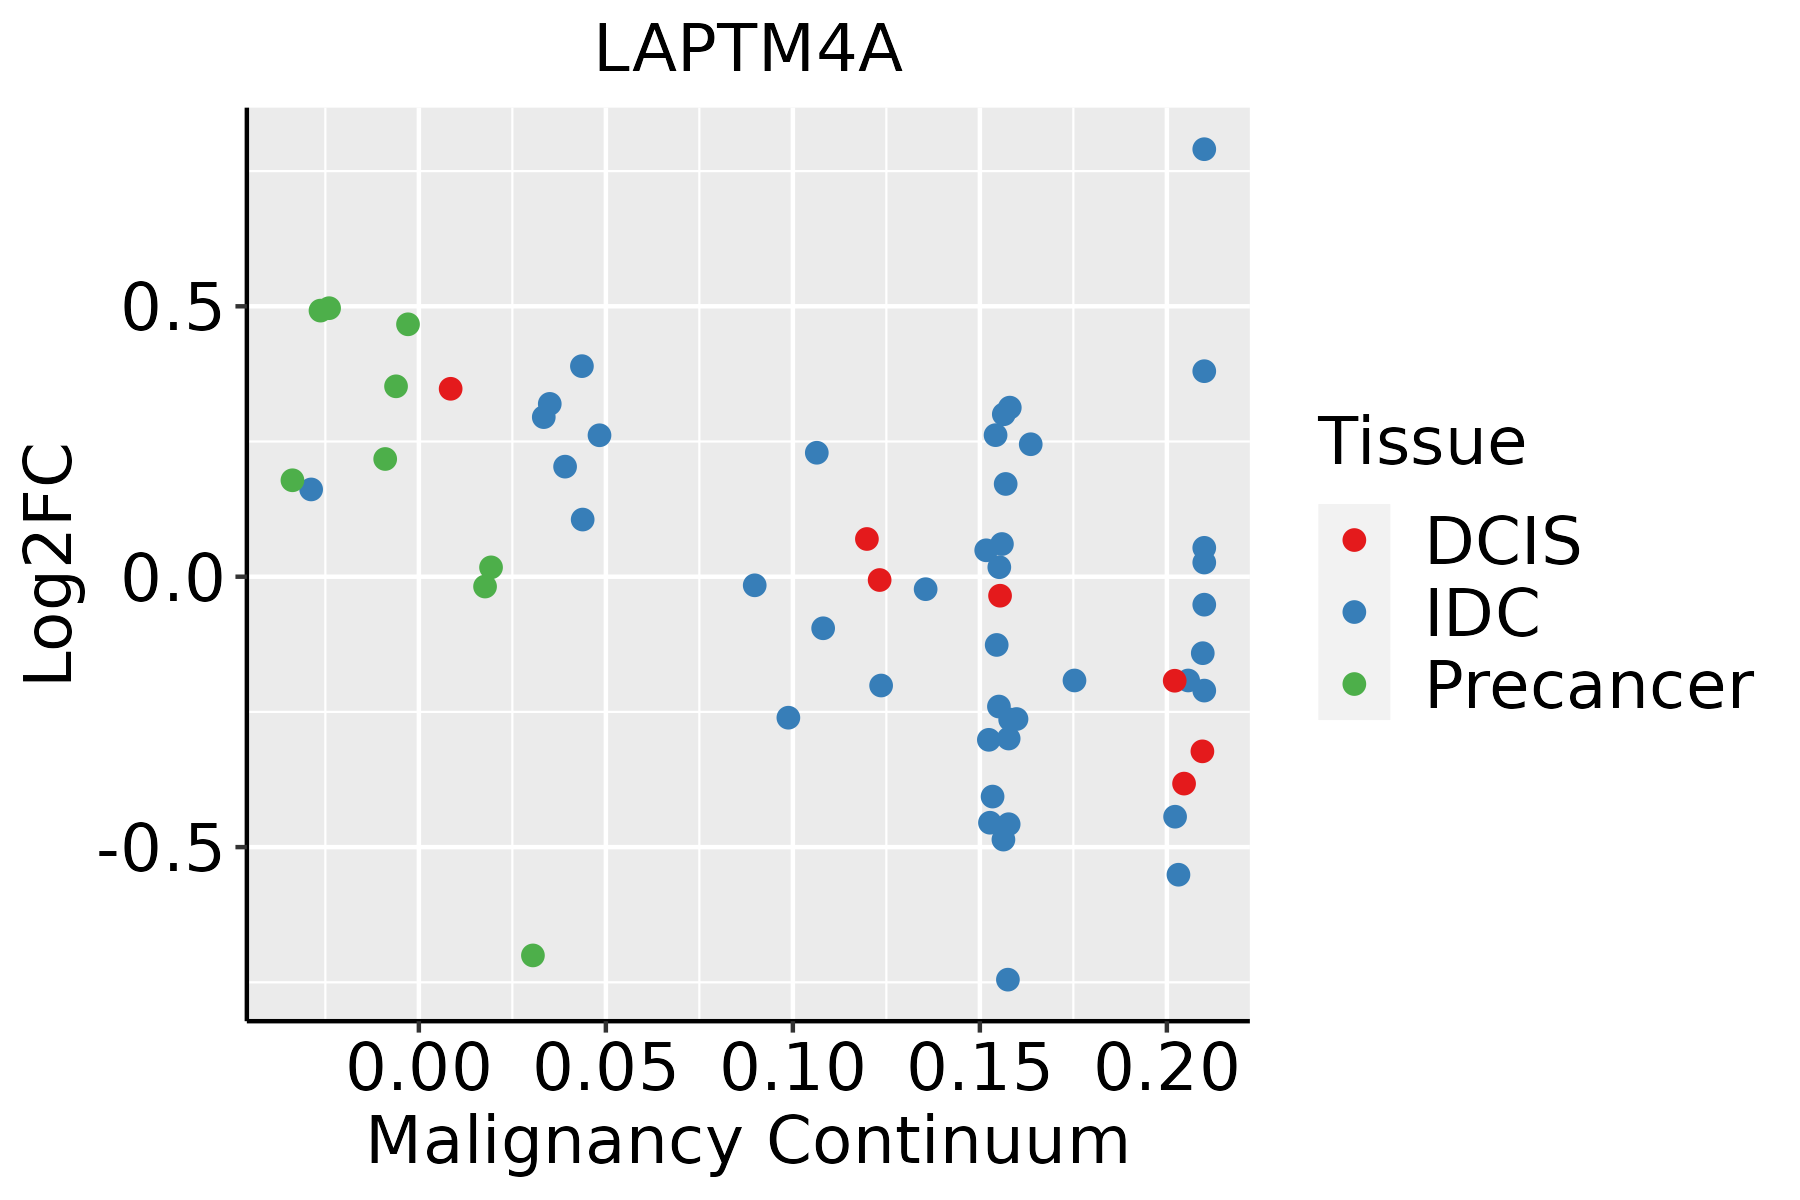 | IDC: Invasive ductal carcinoma |
| DCIS: Ductal carcinoma in situ | ||
| Precancer(BRCA1-mut): Precancerous lesion from BRCA1 mutation carriers | ||
| Cervix |  | CC: Cervix cancer |
| HSIL_HPV: HPV-infected high-grade squamous intraepithelial lesions | ||
| N_HPV: HPV-infected normal cervix | ||
| Colorectum (GSE201348) |  | FAP: Familial adenomatous polyposis |
| CRC: Colorectal cancer | ||
| Colorectum (HTA11) |  | AD: Adenomas |
| SER: Sessile serrated lesions | ||
| MSI-H: Microsatellite-high colorectal cancer | ||
| MSS: Microsatellite stable colorectal cancer | ||
| Endometrium | 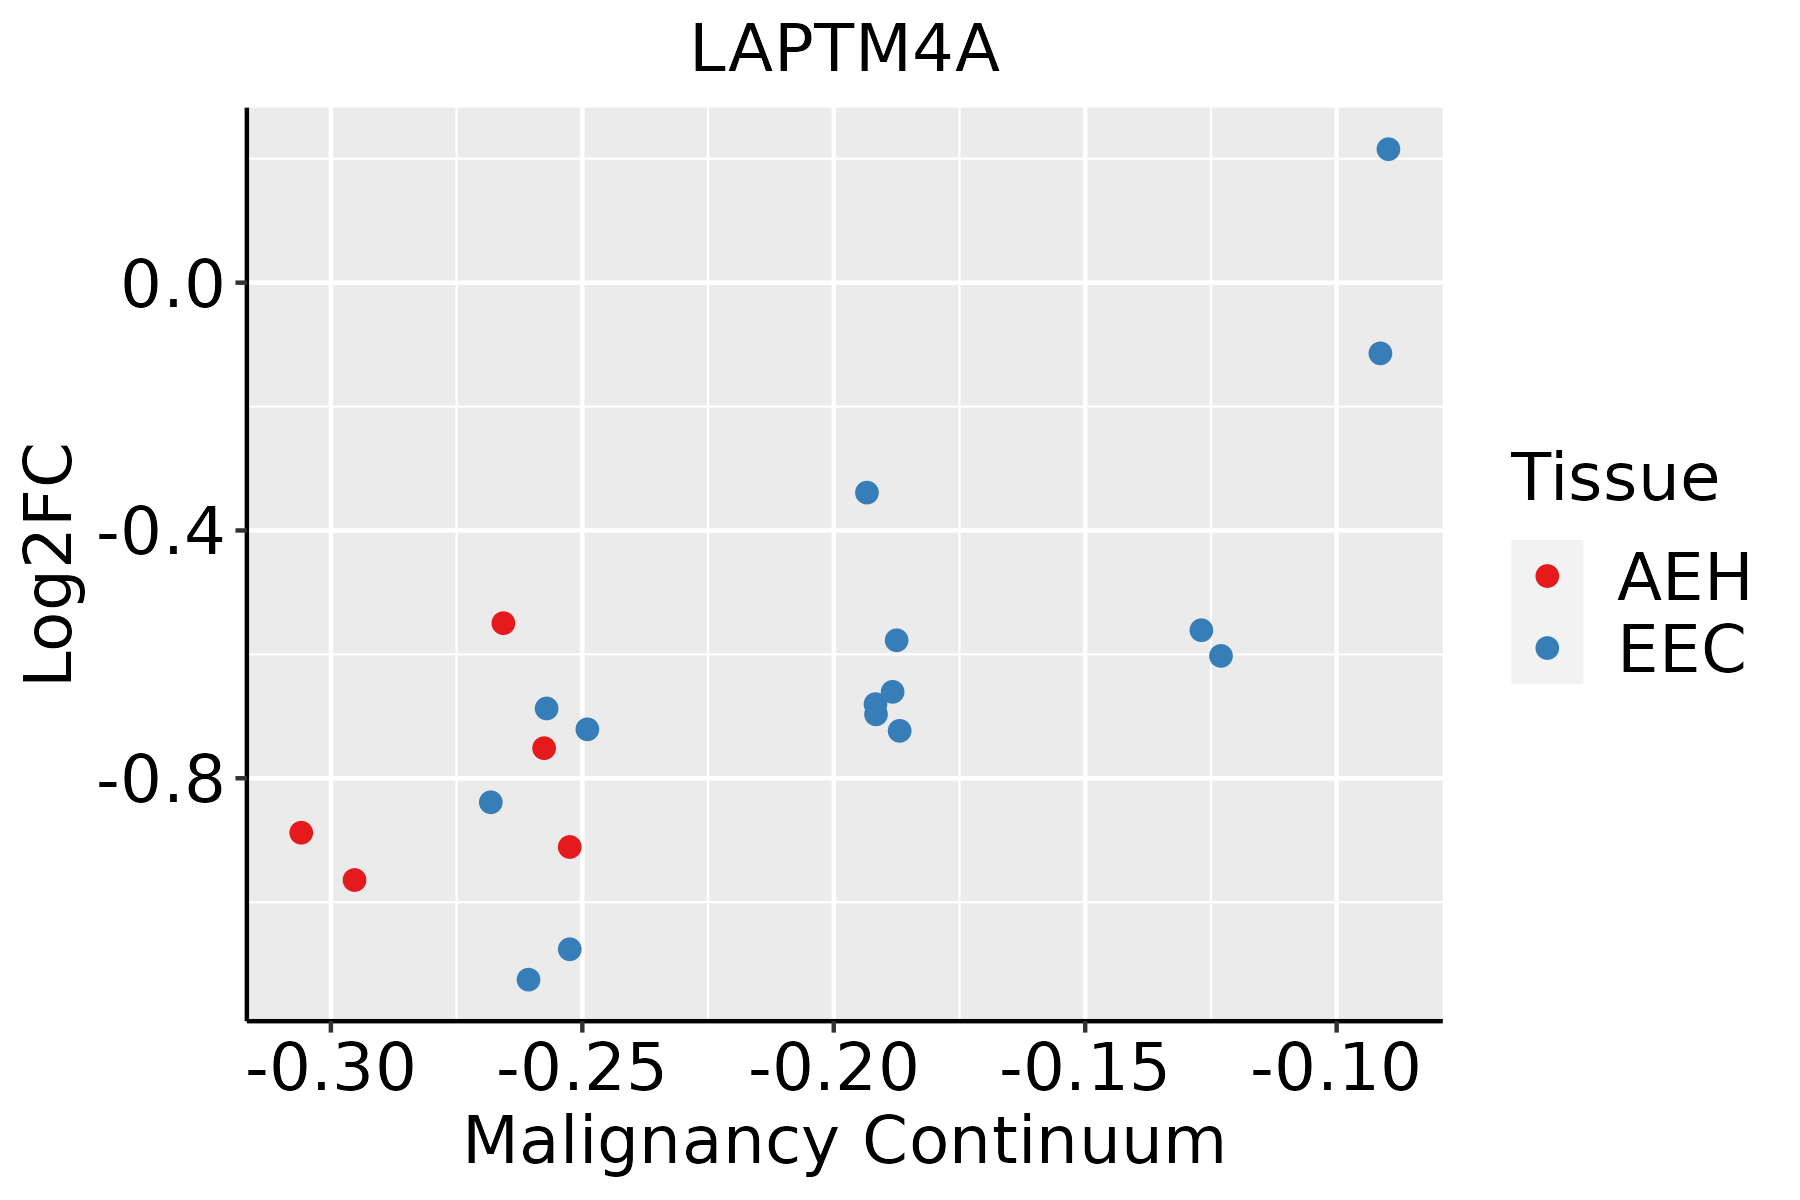 | AEH: Atypical endometrial hyperplasia |
| EEC: Endometrioid Cancer | ||
| Esophagus | 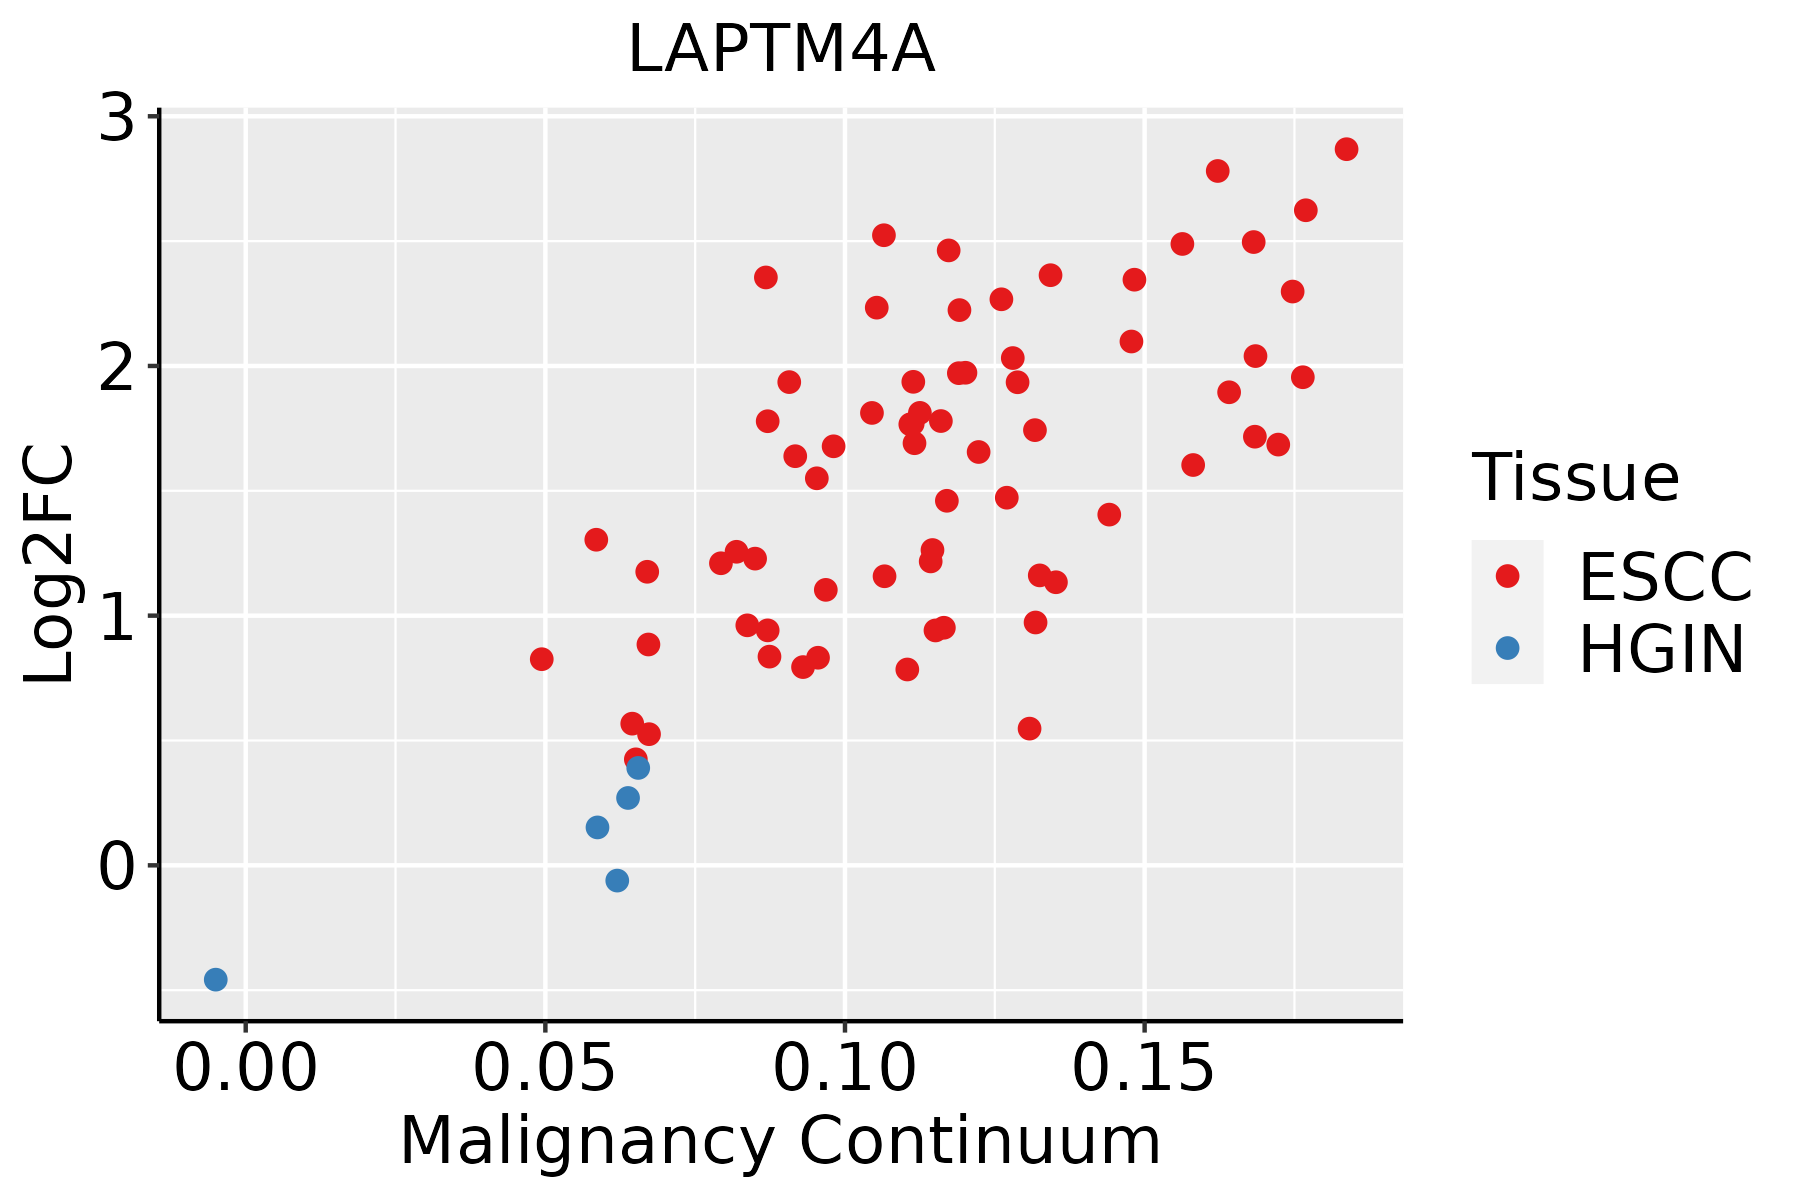 | ESCC: Esophageal squamous cell carcinoma |
| HGIN: High-grade intraepithelial neoplasias | ||
| LGIN: Low-grade intraepithelial neoplasias | ||
| Liver | 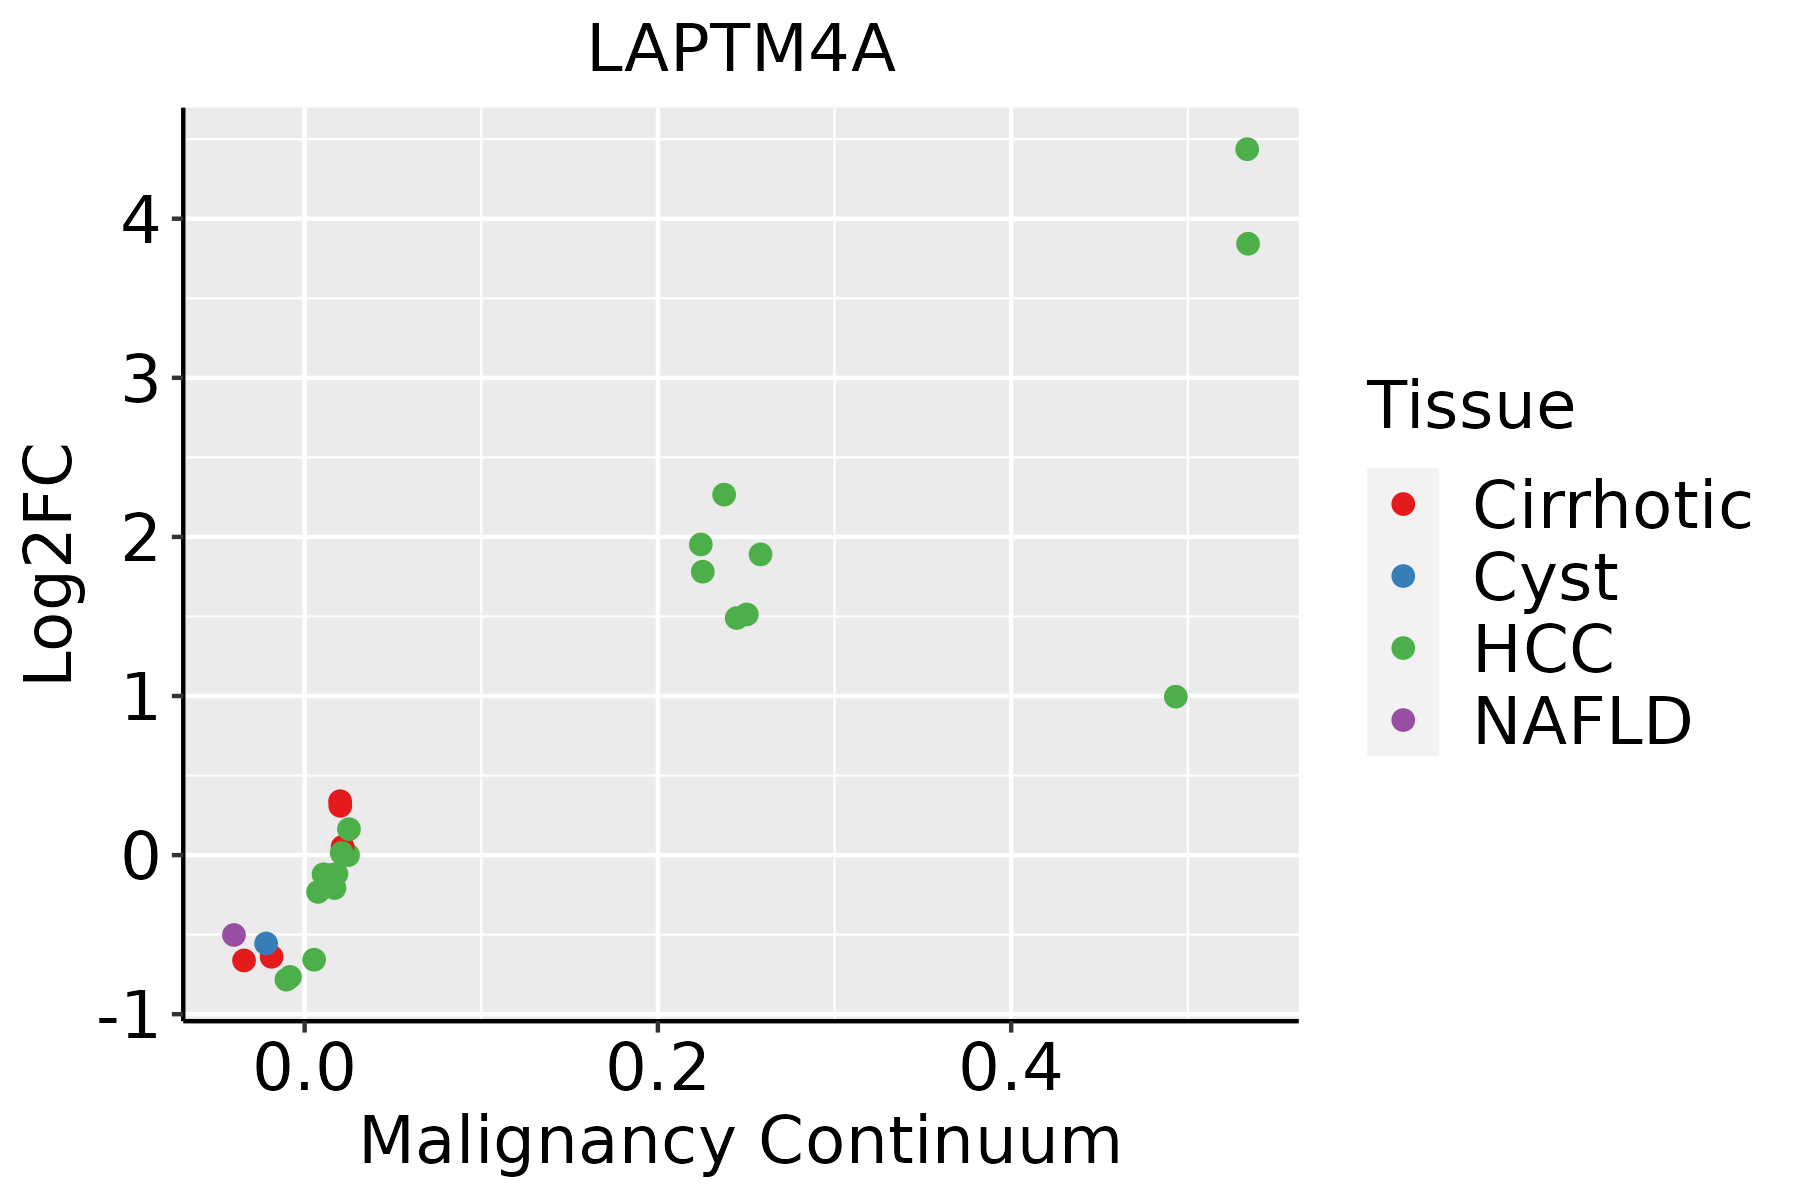 | HCC: Hepatocellular carcinoma |
| NAFLD: Non-alcoholic fatty liver disease | ||
| Lung | 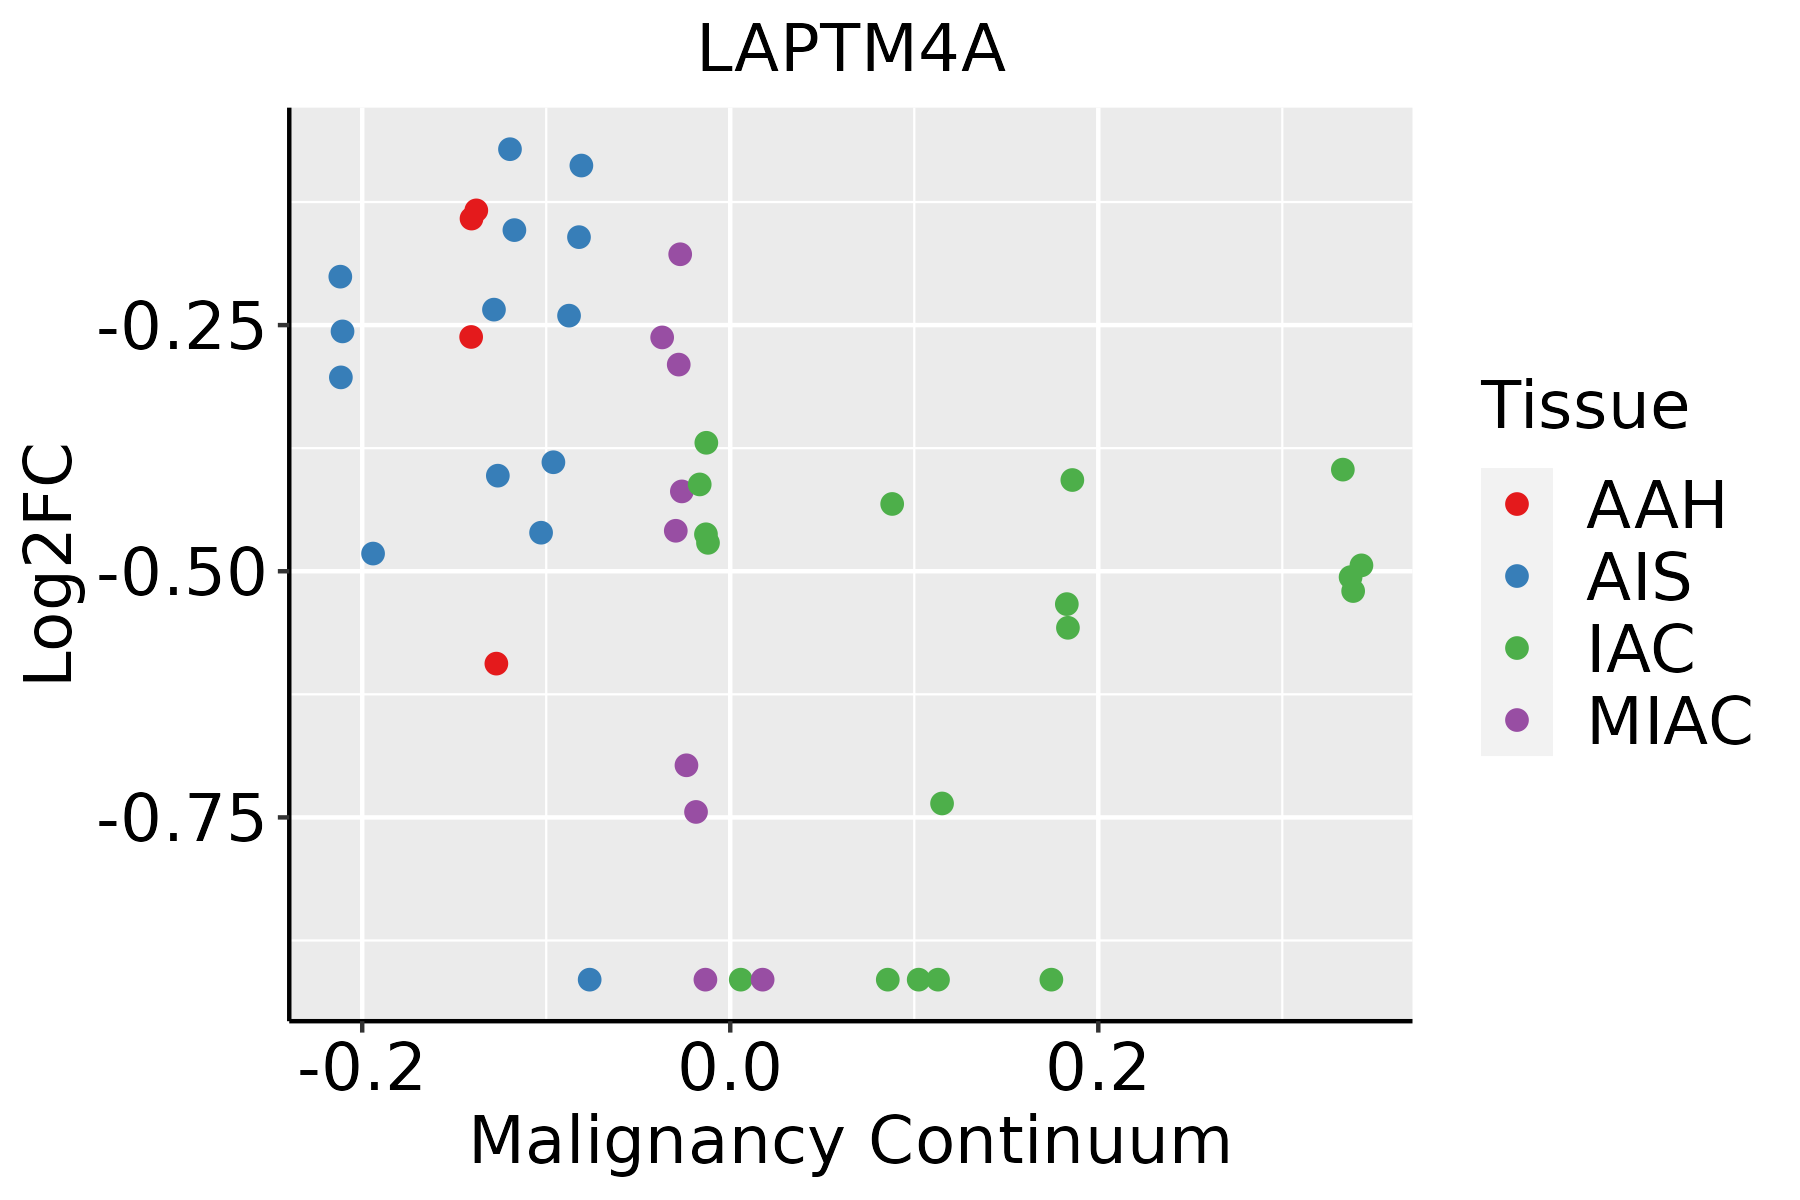 | AAH: Atypical adenomatous hyperplasia |
| AIS: Adenocarcinoma in situ | ||
| IAC: Invasive lung adenocarcinoma | ||
| MIA: Minimally invasive adenocarcinoma | ||
| Oral Cavity | 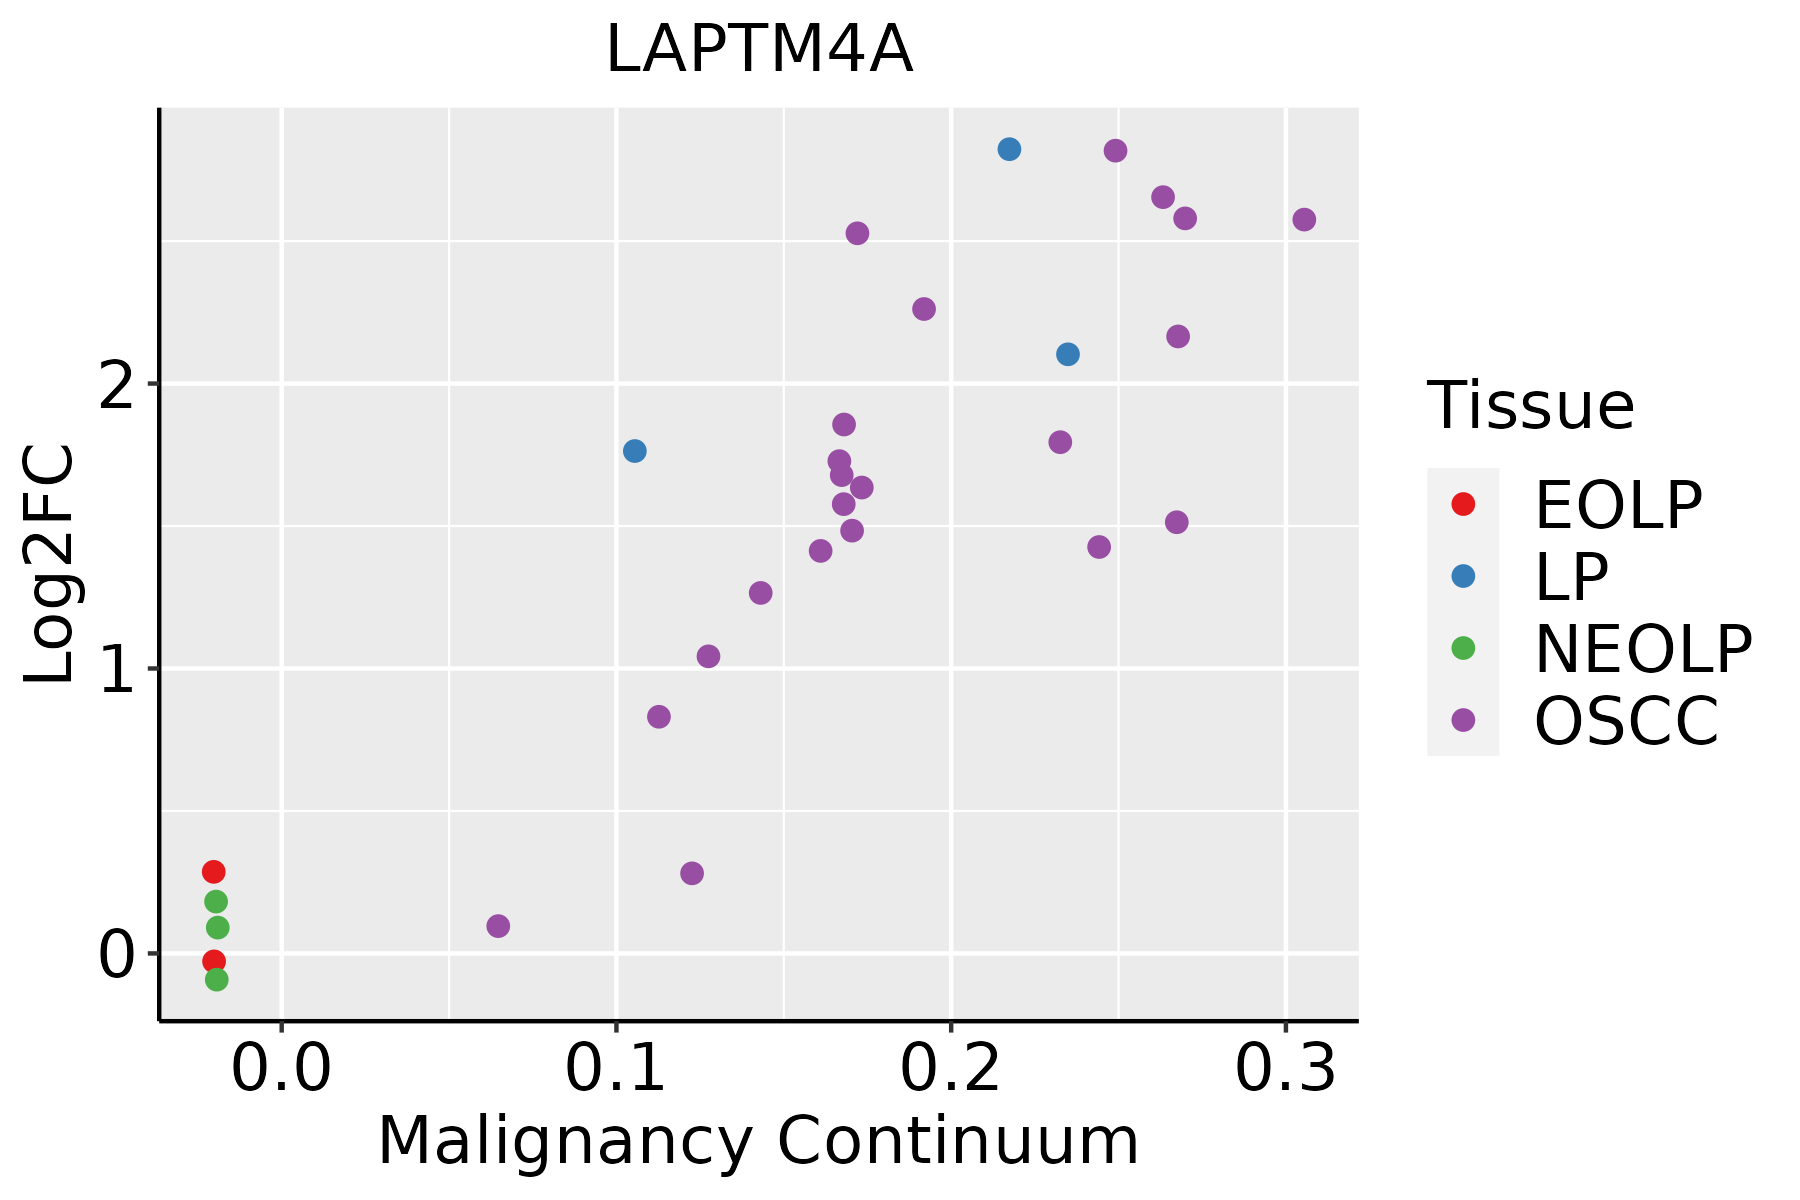 | EOLP: Erosive Oral lichen planus |
| LP: leukoplakia | ||
| NEOLP: Non-erosive oral lichen planus | ||
| OSCC: Oral squamous cell carcinoma | ||
| Prostate | 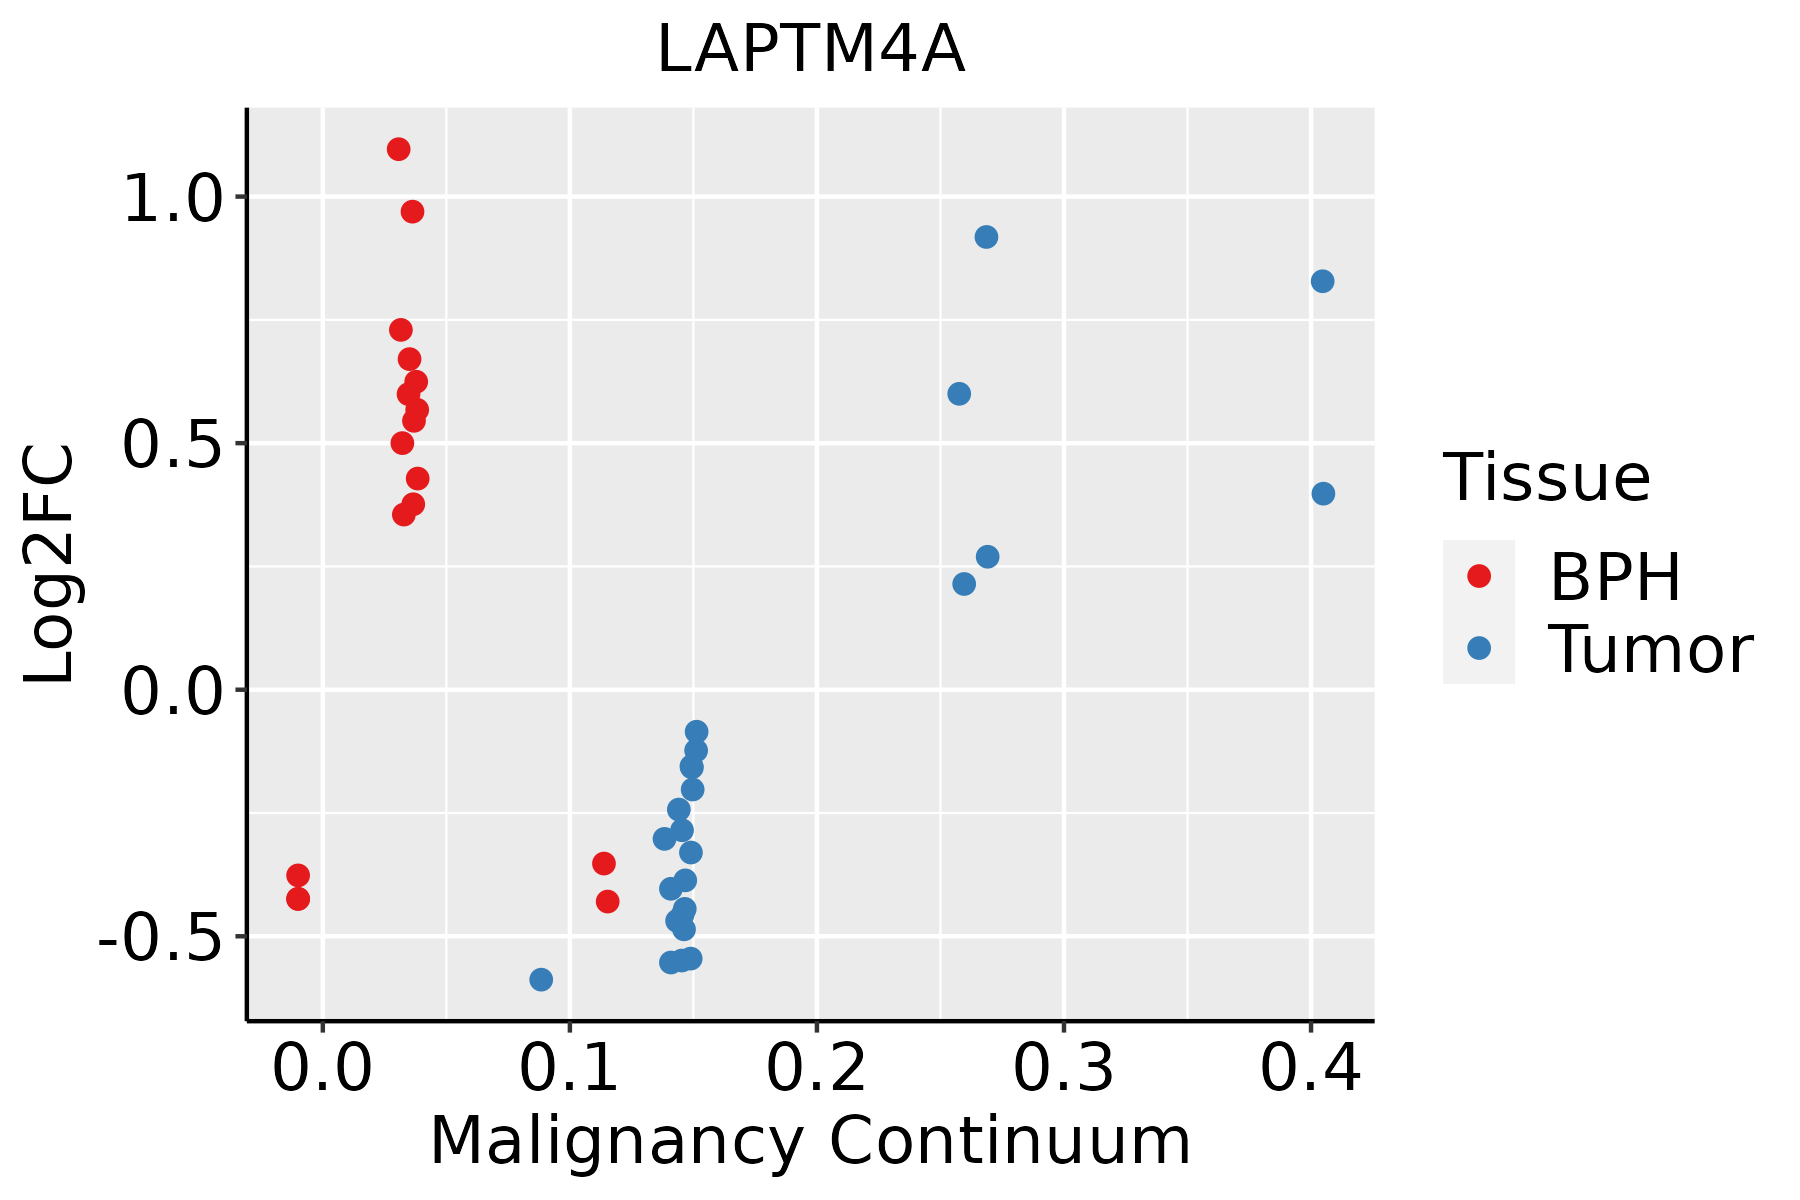 | BPH: Benign Prostatic Hyperplasia |
| Skin |  | AK: Actinic keratosis |
| cSCC: Cutaneous squamous cell carcinoma | ||
| SCCIS:squamous cell carcinoma in situ | ||
| Thyroid |  | ATC: Anaplastic thyroid cancer |
| HT: Hashimoto's thyroiditis | ||
| PTC: Papillary thyroid cancer |
| ∗log2FC in expression of this searched gene in stem-like cells from each diseased tissue sample relative to stem-like cells in normal samples in each tissue plotted against the malignancy continuum. Samples are colored based on if they are from different disease stage. |
Top |
Malignant transformation related pathway analysis |
| Find out the enriched GO biological processes and KEGG pathways involved in transition from healthy to precancer to cancer |
| Tissue | Disease Stage | Enriched GO biological Processes |
| Colorectum | AD |  |
| Colorectum | SER |  |
| Colorectum | MSS |  |
| Colorectum | MSI-H |  |
| Colorectum | FAP |  |
| ∗Top 15 enriched GO BP terms are showed in the bar plot of each disease state in each tissue. Each row represents a significant GO biological process which is colored according to the -log10(p.adjust). |
| Page: 1 2 3 4 5 6 7 8 9 |
| GO ID | Tissue | Disease Stage | Description | Gene Ratio | Bg Ratio | pvalue | p.adjust | Count |
| Page: 1 |
| Pathway ID | Tissue | Disease Stage | Description | Gene Ratio | Bg Ratio | pvalue | p.adjust | qvalue | Count |
| hsa04142 | Colorectum | SER | Lysosome | 38/1580 | 132/8465 | 2.87e-03 | 2.03e-02 | 1.47e-02 | 38 |
| hsa041421 | Colorectum | SER | Lysosome | 38/1580 | 132/8465 | 2.87e-03 | 2.03e-02 | 1.47e-02 | 38 |
| hsa041426 | Esophagus | HGIN | Lysosome | 33/1383 | 132/8465 | 6.65e-03 | 4.37e-02 | 3.47e-02 | 33 |
| hsa0414213 | Esophagus | HGIN | Lysosome | 33/1383 | 132/8465 | 6.65e-03 | 4.37e-02 | 3.47e-02 | 33 |
| hsa0414222 | Esophagus | ESCC | Lysosome | 102/4205 | 132/8465 | 5.11e-11 | 7.13e-10 | 3.65e-10 | 102 |
| hsa0414232 | Esophagus | ESCC | Lysosome | 102/4205 | 132/8465 | 5.11e-11 | 7.13e-10 | 3.65e-10 | 102 |
| hsa041424 | Liver | Cirrhotic | Lysosome | 68/2530 | 132/8465 | 1.34e-07 | 1.97e-06 | 1.21e-06 | 68 |
| hsa0414211 | Liver | Cirrhotic | Lysosome | 68/2530 | 132/8465 | 1.34e-07 | 1.97e-06 | 1.21e-06 | 68 |
| hsa041422 | Liver | HCC | Lysosome | 100/4020 | 132/8465 | 2.32e-11 | 4.31e-10 | 2.40e-10 | 100 |
| hsa041423 | Liver | HCC | Lysosome | 100/4020 | 132/8465 | 2.32e-11 | 4.31e-10 | 2.40e-10 | 100 |
| hsa041425 | Oral cavity | OSCC | Lysosome | 87/3704 | 132/8465 | 1.97e-07 | 1.35e-06 | 6.86e-07 | 87 |
| hsa0414212 | Oral cavity | OSCC | Lysosome | 87/3704 | 132/8465 | 1.97e-07 | 1.35e-06 | 6.86e-07 | 87 |
| hsa0414221 | Oral cavity | LP | Lysosome | 67/2418 | 132/8465 | 5.13e-08 | 7.77e-07 | 5.01e-07 | 67 |
| hsa0414231 | Oral cavity | LP | Lysosome | 67/2418 | 132/8465 | 5.13e-08 | 7.77e-07 | 5.01e-07 | 67 |
| Page: 1 |
Top |
Cell-cell communication analysis |
| Identification of potential cell-cell interactions between two cell types and their ligand-receptor pairs for different disease states |
| Ligand | Receptor | LRpair | Pathway | Tissue | Disease Stage |
| Page: 1 |
Top |
Single-cell gene regulatory network inference analysis |
| Find out the significant the regulons (TFs) and the target genes of each regulon across cell types for different disease states |
| TF | Cell Type | Tissue | Disease Stage | Target Gene | RSS | Regulon Activity |
| ∗The dot plots of a searched regulon are shown for all cell subpopulations in each disease state of each tissue based on the regulon specific score inferred using pySCENIC and by calculating the average expression. |
| Page: 1 |
Top |
Somatic mutation of malignant transformation related genes |
| Annotation of somatic variants for genes involved in malignant transformation |
| Hugo Symbol | Variant Class | Variant Classification | dbSNP RS | HGVSc | HGVSp | HGVSp Short | SWISSPROT | BIOTYPE | SIFT | PolyPhen | Tumor Sample Barcode | Tissue | Histology | Sex | Age | Stage | Therapy Types | Drugs | Outcome |
| LAPTM4A | SNV | Missense_Mutation | novel | c.502T>C | p.Phe168Leu | p.F168L | Q15012 | protein_coding | tolerated(0.06) | benign(0.228) | TCGA-AA-3984-01 | Colorectum | colon adenocarcinoma | Female | <65 | I/II | Unknown | Unknown | SD |
| LAPTM4A | SNV | Missense_Mutation | rs142563595 | c.520N>G | p.Ile174Val | p.I174V | Q15012 | protein_coding | tolerated(0.85) | benign(0.005) | TCGA-A5-A0VP-01 | Endometrium | uterine corpus endometrioid carcinoma | Female | >=65 | I/II | Unknown | Unknown | SD |
| LAPTM4A | SNV | Missense_Mutation | novel | c.260N>A | p.Ser87Tyr | p.S87Y | Q15012 | protein_coding | deleterious(0) | probably_damaging(0.913) | TCGA-AP-A1DK-01 | Endometrium | uterine corpus endometrioid carcinoma | Female | <65 | I/II | Unknown | Unknown | SD |
| LAPTM4A | SNV | Missense_Mutation | novel | c.563N>G | p.Lys188Arg | p.K188R | Q15012 | protein_coding | tolerated(1) | probably_damaging(0.963) | TCGA-AX-A1CE-01 | Endometrium | uterine corpus endometrioid carcinoma | Female | <65 | I/II | Unspecific | Paclitaxel | SD |
| LAPTM4A | SNV | Missense_Mutation | c.481N>G | p.Leu161Val | p.L161V | Q15012 | protein_coding | tolerated(0.05) | probably_damaging(0.998) | TCGA-B5-A0K2-01 | Endometrium | uterine corpus endometrioid carcinoma | Female | <65 | III/IV | Hormone Therapy | megace | SD | |
| LAPTM4A | SNV | Missense_Mutation | novel | c.620N>A | p.Pro207His | p.P207H | Q15012 | protein_coding | tolerated(0.05) | probably_damaging(0.911) | TCGA-B5-A3FA-01 | Endometrium | uterine corpus endometrioid carcinoma | Female | >=65 | I/II | Unknown | Unknown | SD |
| LAPTM4A | SNV | Missense_Mutation | c.187N>A | p.Gln63Lys | p.Q63K | Q15012 | protein_coding | tolerated(0.31) | benign(0.294) | TCGA-BG-A0M6-01 | Endometrium | uterine corpus endometrioid carcinoma | Female | >=65 | III/IV | Chemotherapy | paclitaxel | SD | |
| LAPTM4A | SNV | Missense_Mutation | rs143469937 | c.578G>A | p.Arg193Gln | p.R193Q | Q15012 | protein_coding | deleterious(0.01) | possibly_damaging(0.736) | TCGA-D1-A17Q-01 | Endometrium | uterine corpus endometrioid carcinoma | Female | <65 | I/II | Unknown | Unknown | SD |
| LAPTM4A | SNV | Missense_Mutation | novel | c.504N>A | p.Phe168Leu | p.F168L | Q15012 | protein_coding | tolerated(0.06) | benign(0.228) | TCGA-EO-A3AV-01 | Endometrium | uterine corpus endometrioid carcinoma | Female | <65 | III/IV | Chemotherapy | carboplatin | CR |
| LAPTM4A | SNV | Missense_Mutation | novel | c.229G>T | p.Ala77Ser | p.A77S | Q15012 | protein_coding | tolerated(1) | benign(0.038) | TCGA-QF-A5YS-01 | Endometrium | uterine corpus endometrioid carcinoma | Female | <65 | I/II | Chemotherapy | carboplatin | CR |
| Page: 1 2 |
Top |
Related drugs of malignant transformation related genes |
| Identification of chemicals and drugs interact with genes involved in malignant transfromation |
| (DGIdb 4.0) |
| Entrez ID | Symbol | Category | Interaction Types | Drug Claim Name | Drug Name | PMIDs |
| Page: 1 |

Copyright 2023-Present -The University of Texas Health Science Center at Houston |