
|
|||||
|
 | |
| |
| |
| |
| |
| |
|
Gene: LAMTOR1 |
Gene summary for LAMTOR1 |
| Gene information | Species | Human | Gene symbol | LAMTOR1 | Gene ID | 55004 |
| Gene name | late endosomal/lysosomal adaptor, MAPK and MTOR activator 1 | |
| Gene Alias | C11orf59 | |
| Cytomap | 11q13.4 | |
| Gene Type | protein-coding | GO ID | GO:0000165 | UniProtAcc | Q6IAA8 |
Top |
Malignant transformation analysis |
| Identification of the aberrant gene expression in precancerous and cancerous lesions by comparing the gene expression of stem-like cells in diseased tissues with normal stem cells |
| Entrez ID | Symbol | Replicates | Species | Organ | Tissue | Adj P-value | Log2FC | Malignancy |
| 55004 | LAMTOR1 | AEH-subject4 | Human | Endometrium | AEH | 3.97e-17 | -4.71e-01 | -0.2657 |
| 55004 | LAMTOR1 | AEH-subject5 | Human | Endometrium | AEH | 5.73e-14 | -4.19e-01 | -0.2953 |
| 55004 | LAMTOR1 | EEC-subject1 | Human | Endometrium | EEC | 3.38e-21 | -4.21e-01 | -0.2682 |
| 55004 | LAMTOR1 | EEC-subject2 | Human | Endometrium | EEC | 1.30e-17 | -4.17e-01 | -0.2607 |
| 55004 | LAMTOR1 | EEC-subject3 | Human | Endometrium | EEC | 4.13e-55 | -5.52e-01 | -0.2525 |
| 55004 | LAMTOR1 | EEC-subject4 | Human | Endometrium | EEC | 8.39e-07 | -2.76e-01 | -0.2571 |
| 55004 | LAMTOR1 | EEC-subject5 | Human | Endometrium | EEC | 4.39e-06 | -1.86e-01 | -0.249 |
| 55004 | LAMTOR1 | GSM5276934 | Human | Endometrium | EEC | 9.56e-03 | -2.66e-01 | -0.0913 |
| 55004 | LAMTOR1 | GSM6177620_NYU_UCEC1_lib1_lib1 | Human | Endometrium | EEC | 1.29e-34 | -2.37e-01 | -0.1869 |
| 55004 | LAMTOR1 | GSM6177620_NYU_UCEC1_lib2_lib2 | Human | Endometrium | EEC | 8.10e-32 | -1.52e-01 | -0.1875 |
| 55004 | LAMTOR1 | GSM6177620_NYU_UCEC1_lib3_lib3 | Human | Endometrium | EEC | 2.93e-35 | -3.74e-01 | -0.1883 |
| 55004 | LAMTOR1 | GSM6177621_NYU_UCEC2_lib1_lib1 | Human | Endometrium | EEC | 1.32e-29 | -2.22e-01 | -0.1934 |
| 55004 | LAMTOR1 | GSM6177622_NYU_UCEC3_lib1_lib1 | Human | Endometrium | EEC | 2.49e-47 | -9.78e-02 | -0.1917 |
| 55004 | LAMTOR1 | GSM6177622_NYU_UCEC3_lib2_lib2 | Human | Endometrium | EEC | 7.91e-48 | -1.86e-01 | -0.1916 |
| 55004 | LAMTOR1 | GSM6177623_NYU_UCEC3_Vis | Human | Endometrium | EEC | 7.55e-04 | -1.01e-01 | -0.1269 |
| 55004 | LAMTOR1 | LZE2D | Human | Esophagus | HGIN | 1.39e-03 | 3.39e-01 | 0.0642 |
| 55004 | LAMTOR1 | LZE2T | Human | Esophagus | ESCC | 2.05e-03 | 8.21e-01 | 0.082 |
| 55004 | LAMTOR1 | LZE4T | Human | Esophagus | ESCC | 4.86e-26 | 6.22e-01 | 0.0811 |
| 55004 | LAMTOR1 | LZE5T | Human | Esophagus | ESCC | 2.32e-07 | 5.11e-01 | 0.0514 |
| 55004 | LAMTOR1 | LZE7T | Human | Esophagus | ESCC | 4.33e-09 | 5.88e-01 | 0.0667 |
| Page: 1 2 3 4 5 6 7 8 9 10 |
| Tissue | Expression Dynamics | Abbreviation |
| Breast | 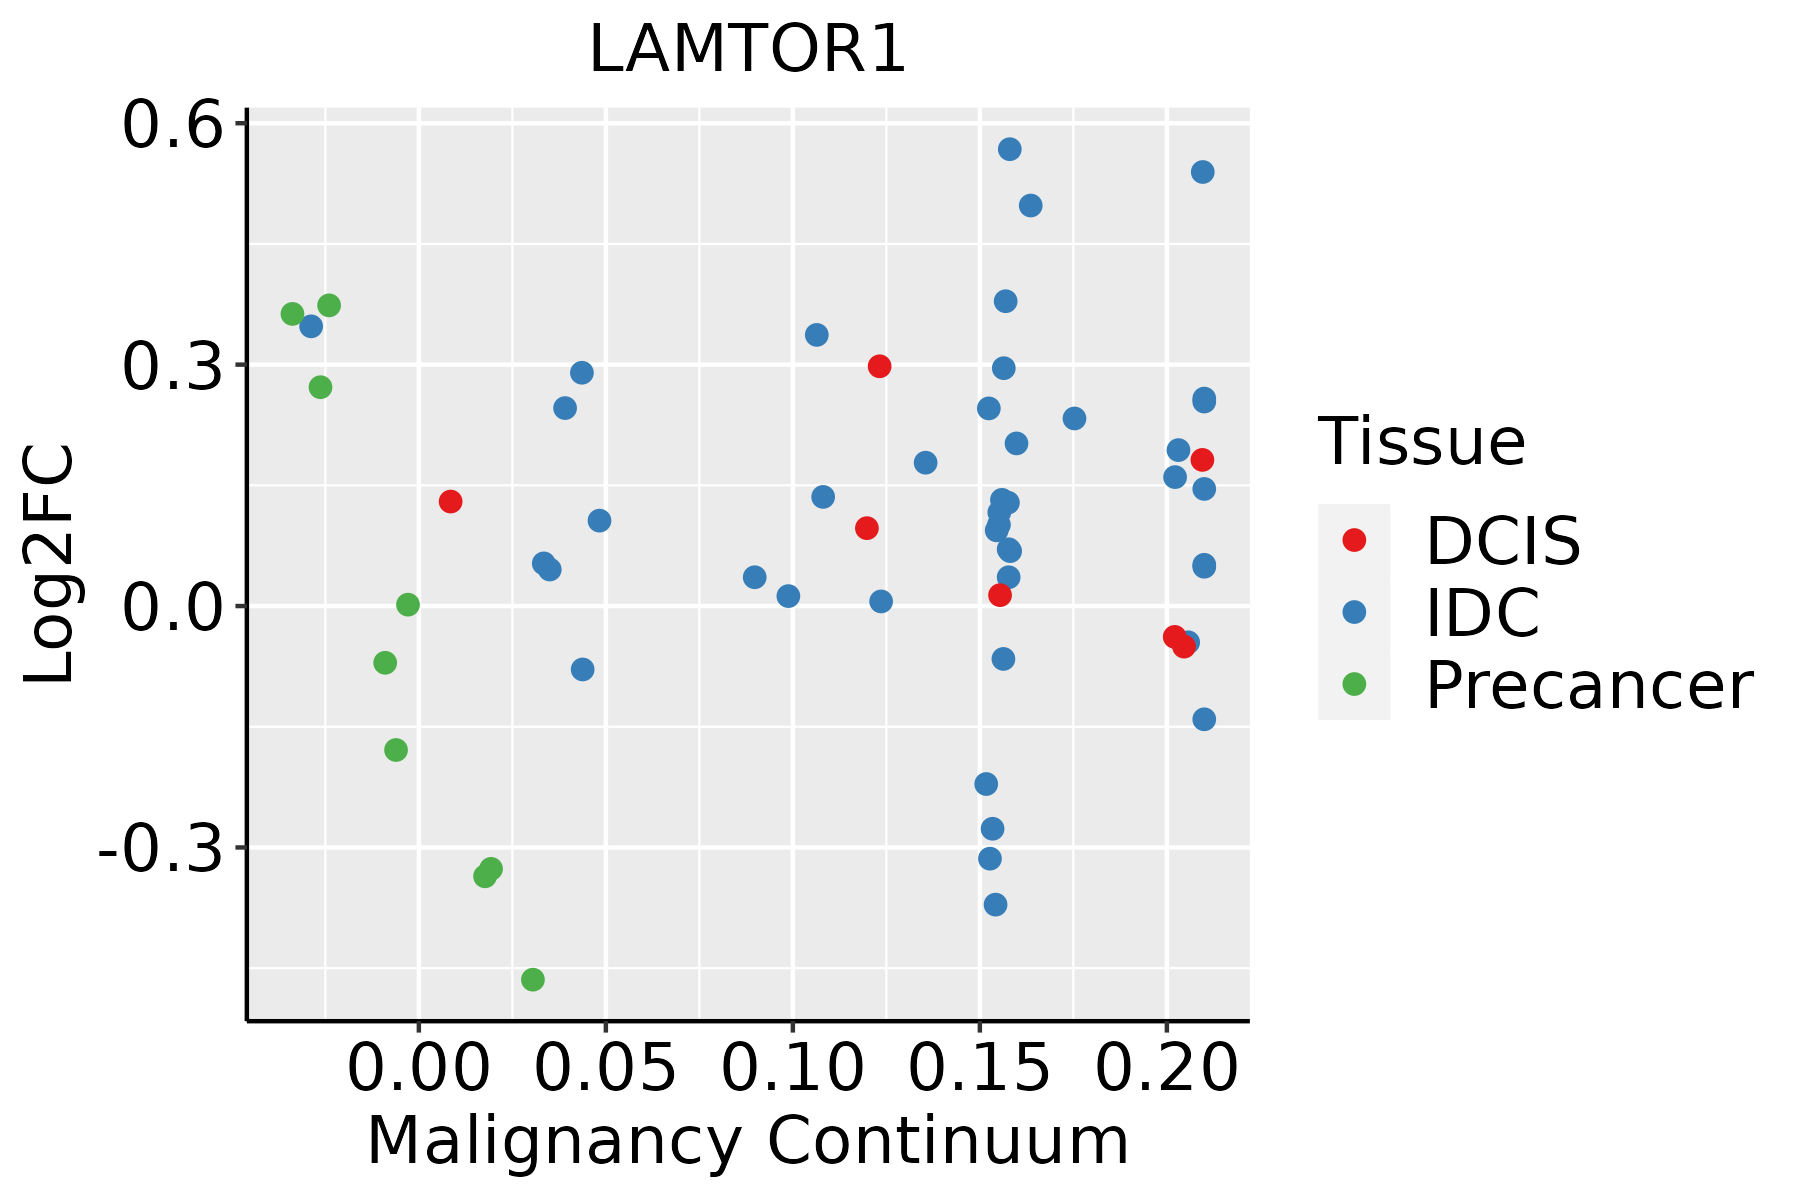 | IDC: Invasive ductal carcinoma |
| DCIS: Ductal carcinoma in situ | ||
| Precancer(BRCA1-mut): Precancerous lesion from BRCA1 mutation carriers | ||
| Colorectum (GSE201348) | 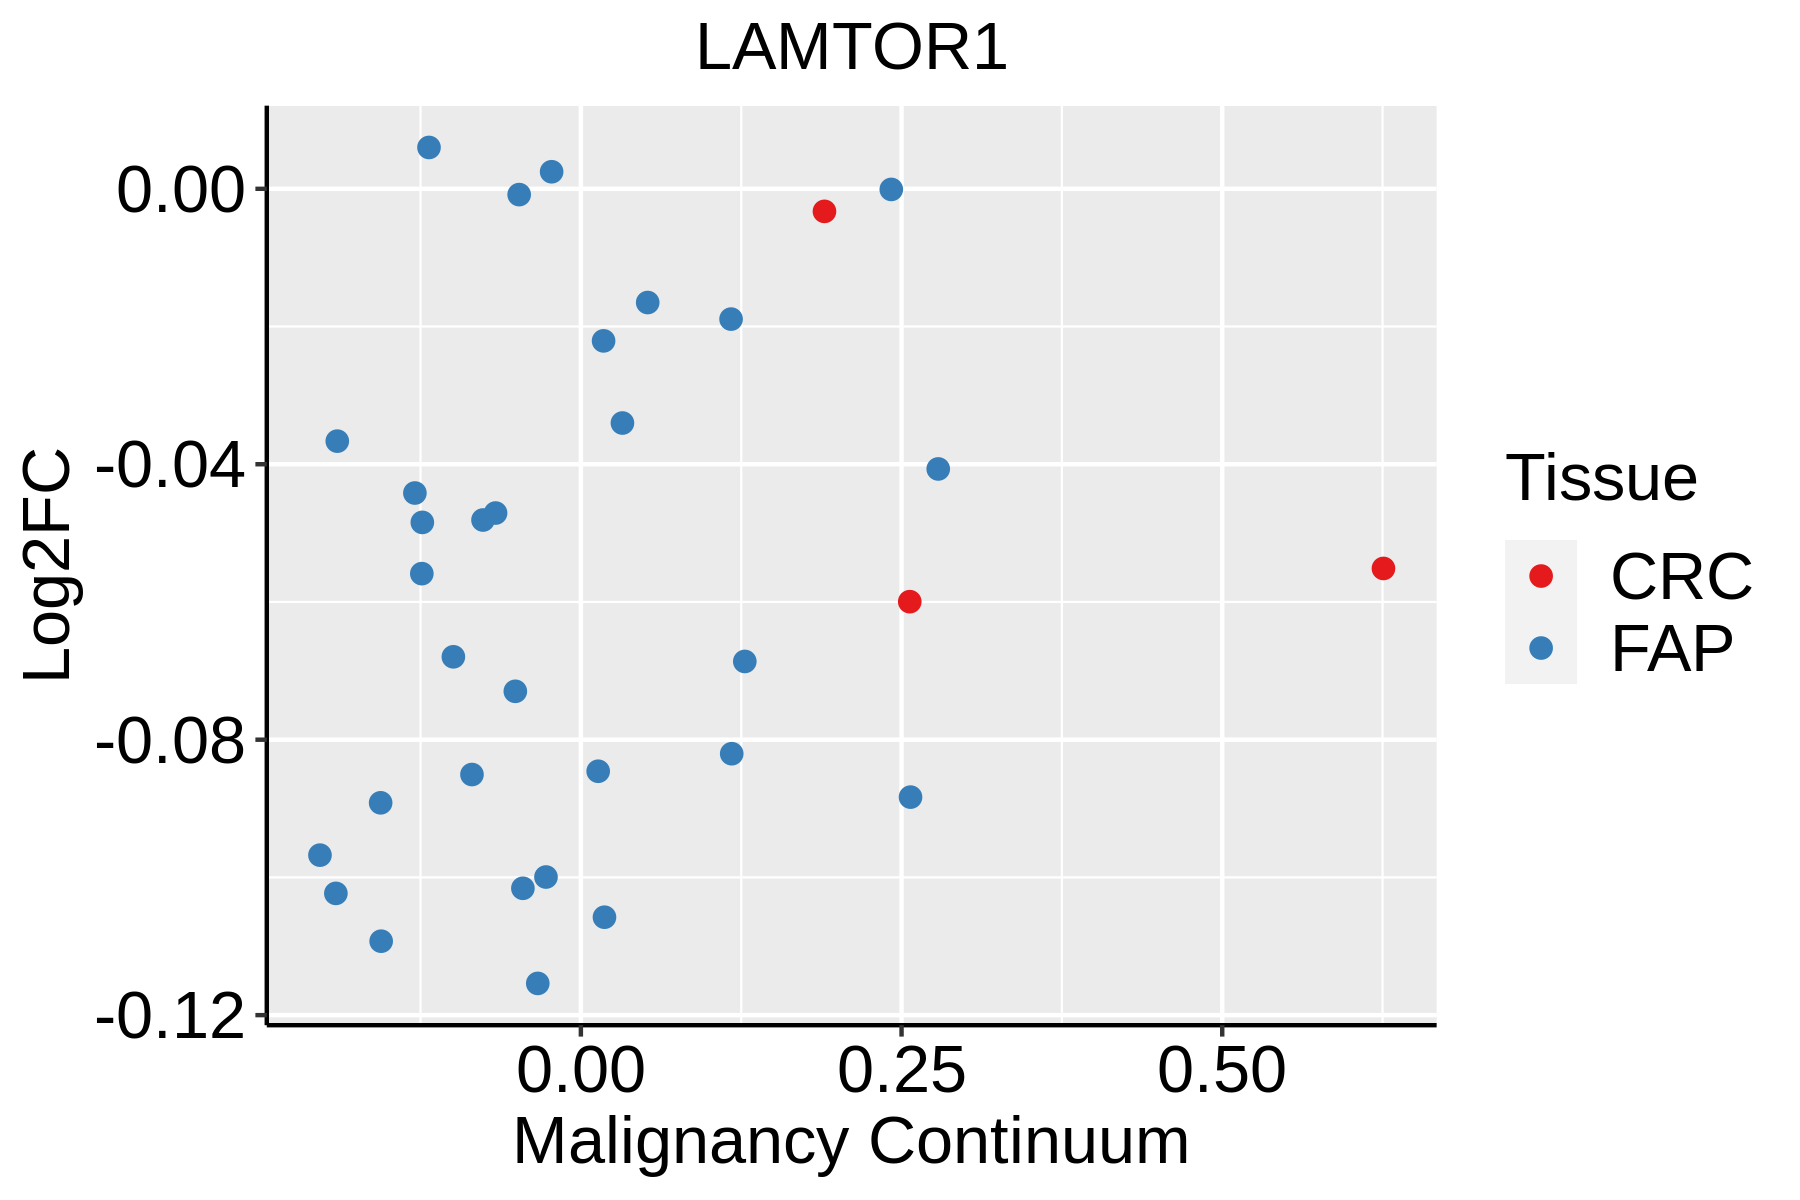 | FAP: Familial adenomatous polyposis |
| CRC: Colorectal cancer | ||
| Colorectum (HTA11) |  | AD: Adenomas |
| SER: Sessile serrated lesions | ||
| MSI-H: Microsatellite-high colorectal cancer | ||
| MSS: Microsatellite stable colorectal cancer | ||
| Endometrium | 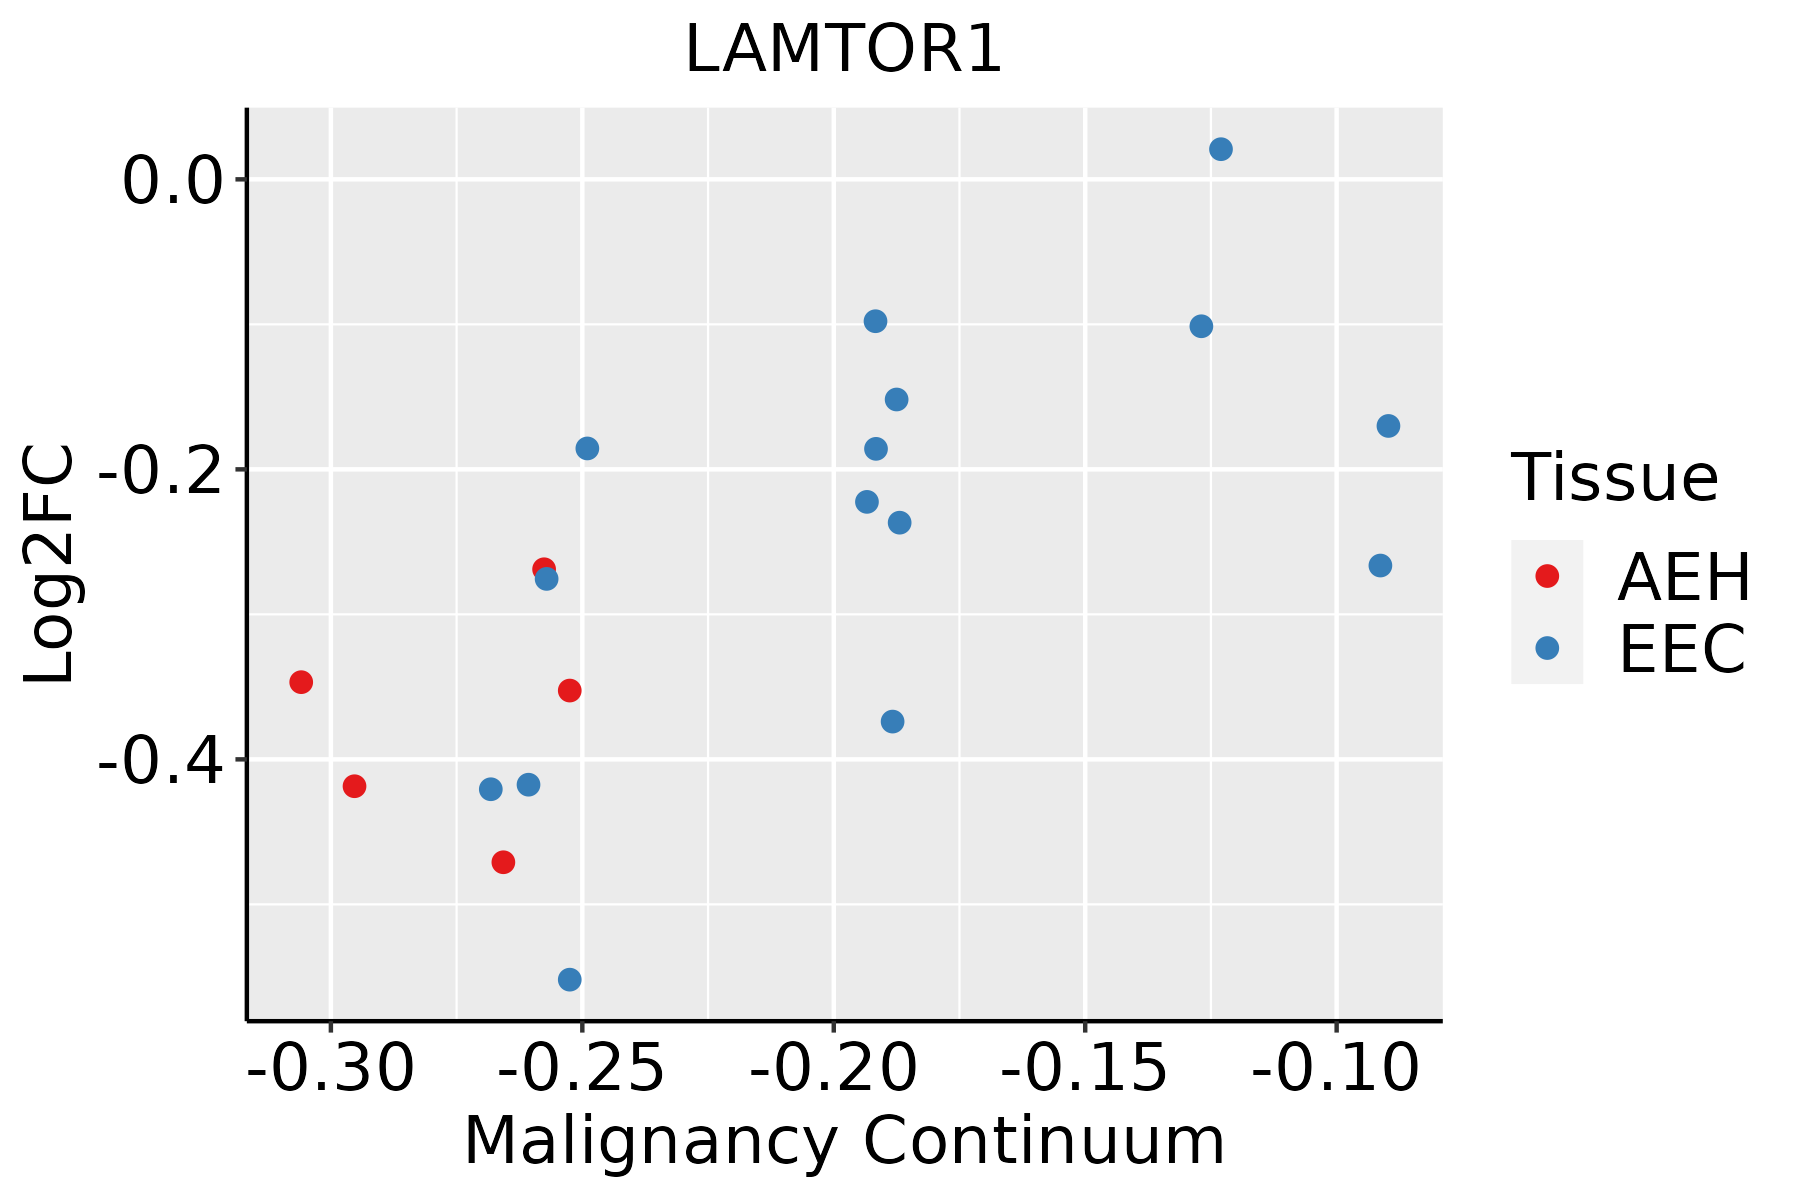 | AEH: Atypical endometrial hyperplasia |
| EEC: Endometrioid Cancer | ||
| Esophagus |  | ESCC: Esophageal squamous cell carcinoma |
| HGIN: High-grade intraepithelial neoplasias | ||
| LGIN: Low-grade intraepithelial neoplasias | ||
| Liver |  | HCC: Hepatocellular carcinoma |
| NAFLD: Non-alcoholic fatty liver disease | ||
| Oral Cavity | 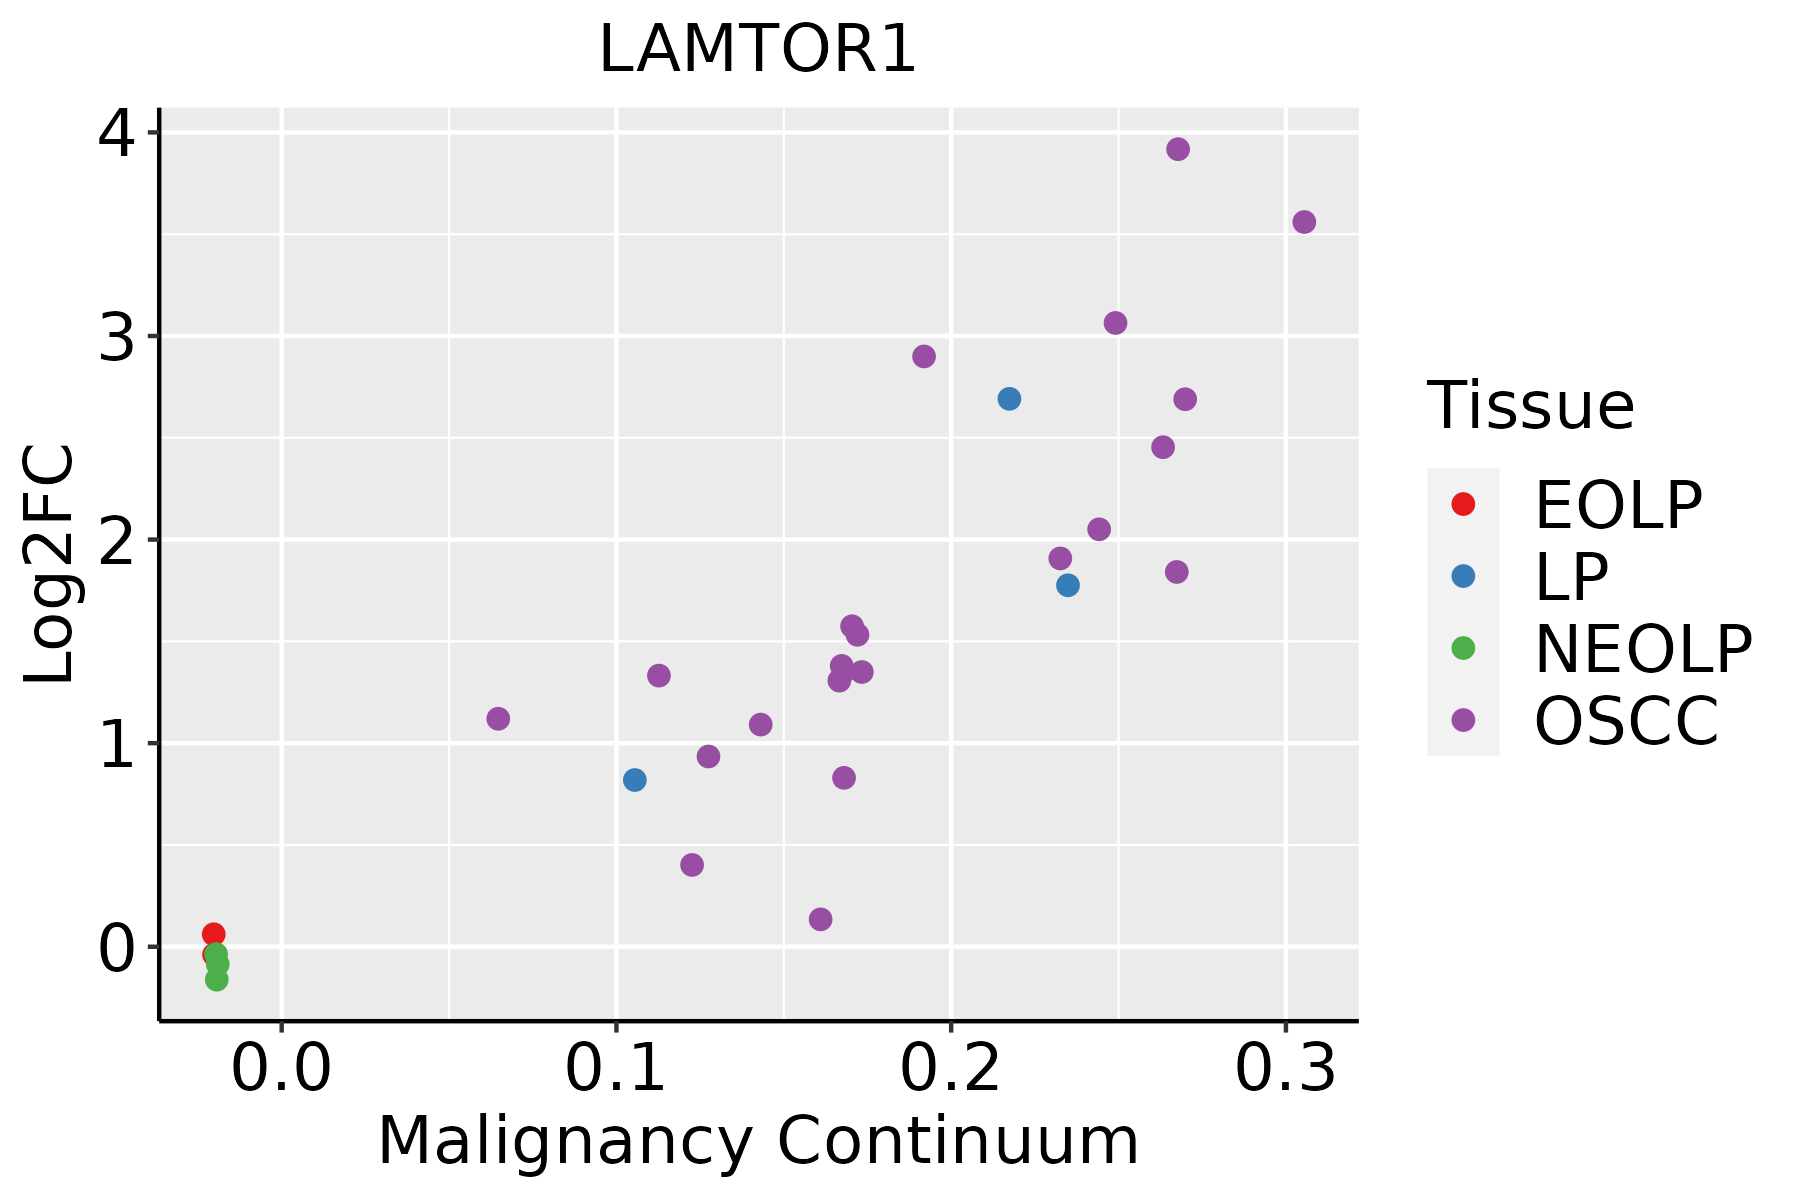 | EOLP: Erosive Oral lichen planus |
| LP: leukoplakia | ||
| NEOLP: Non-erosive oral lichen planus | ||
| OSCC: Oral squamous cell carcinoma | ||
| Prostate | 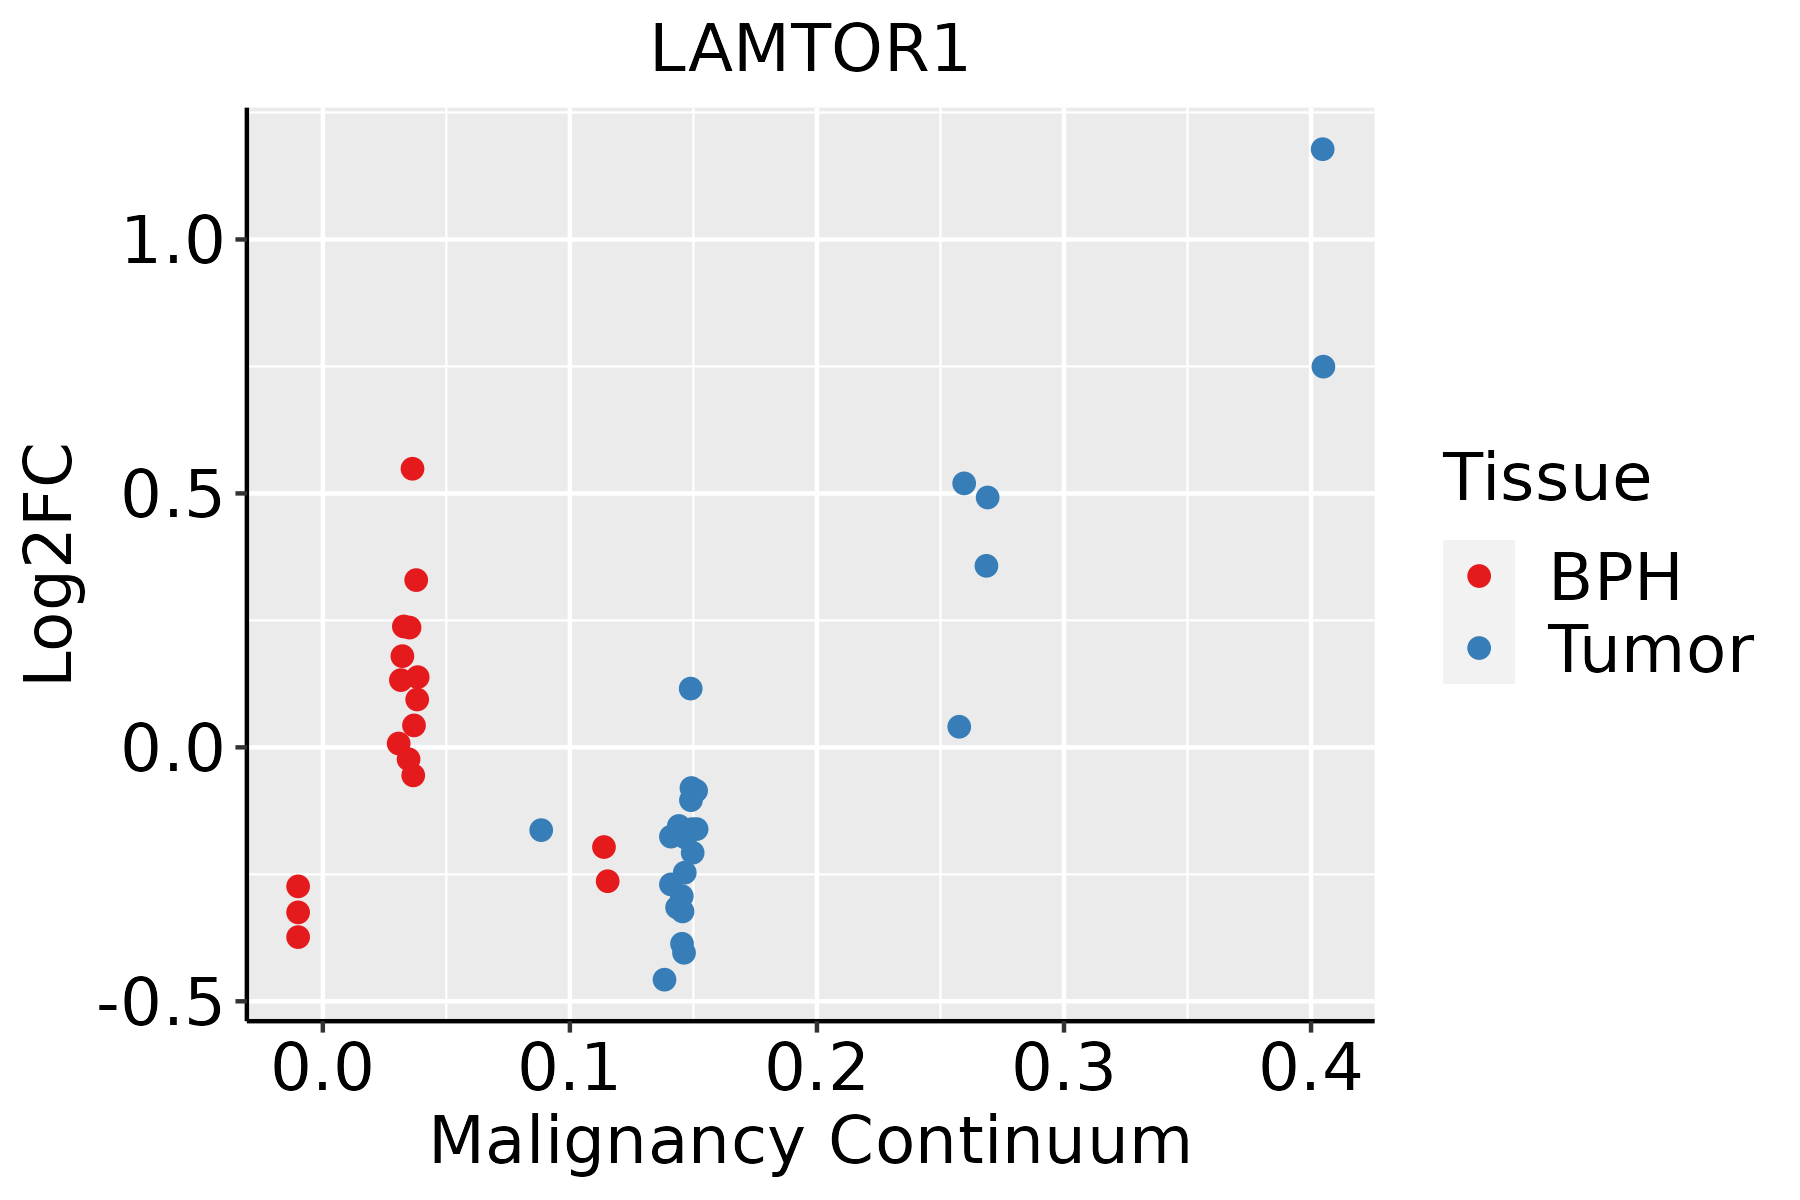 | BPH: Benign Prostatic Hyperplasia |
| Skin | 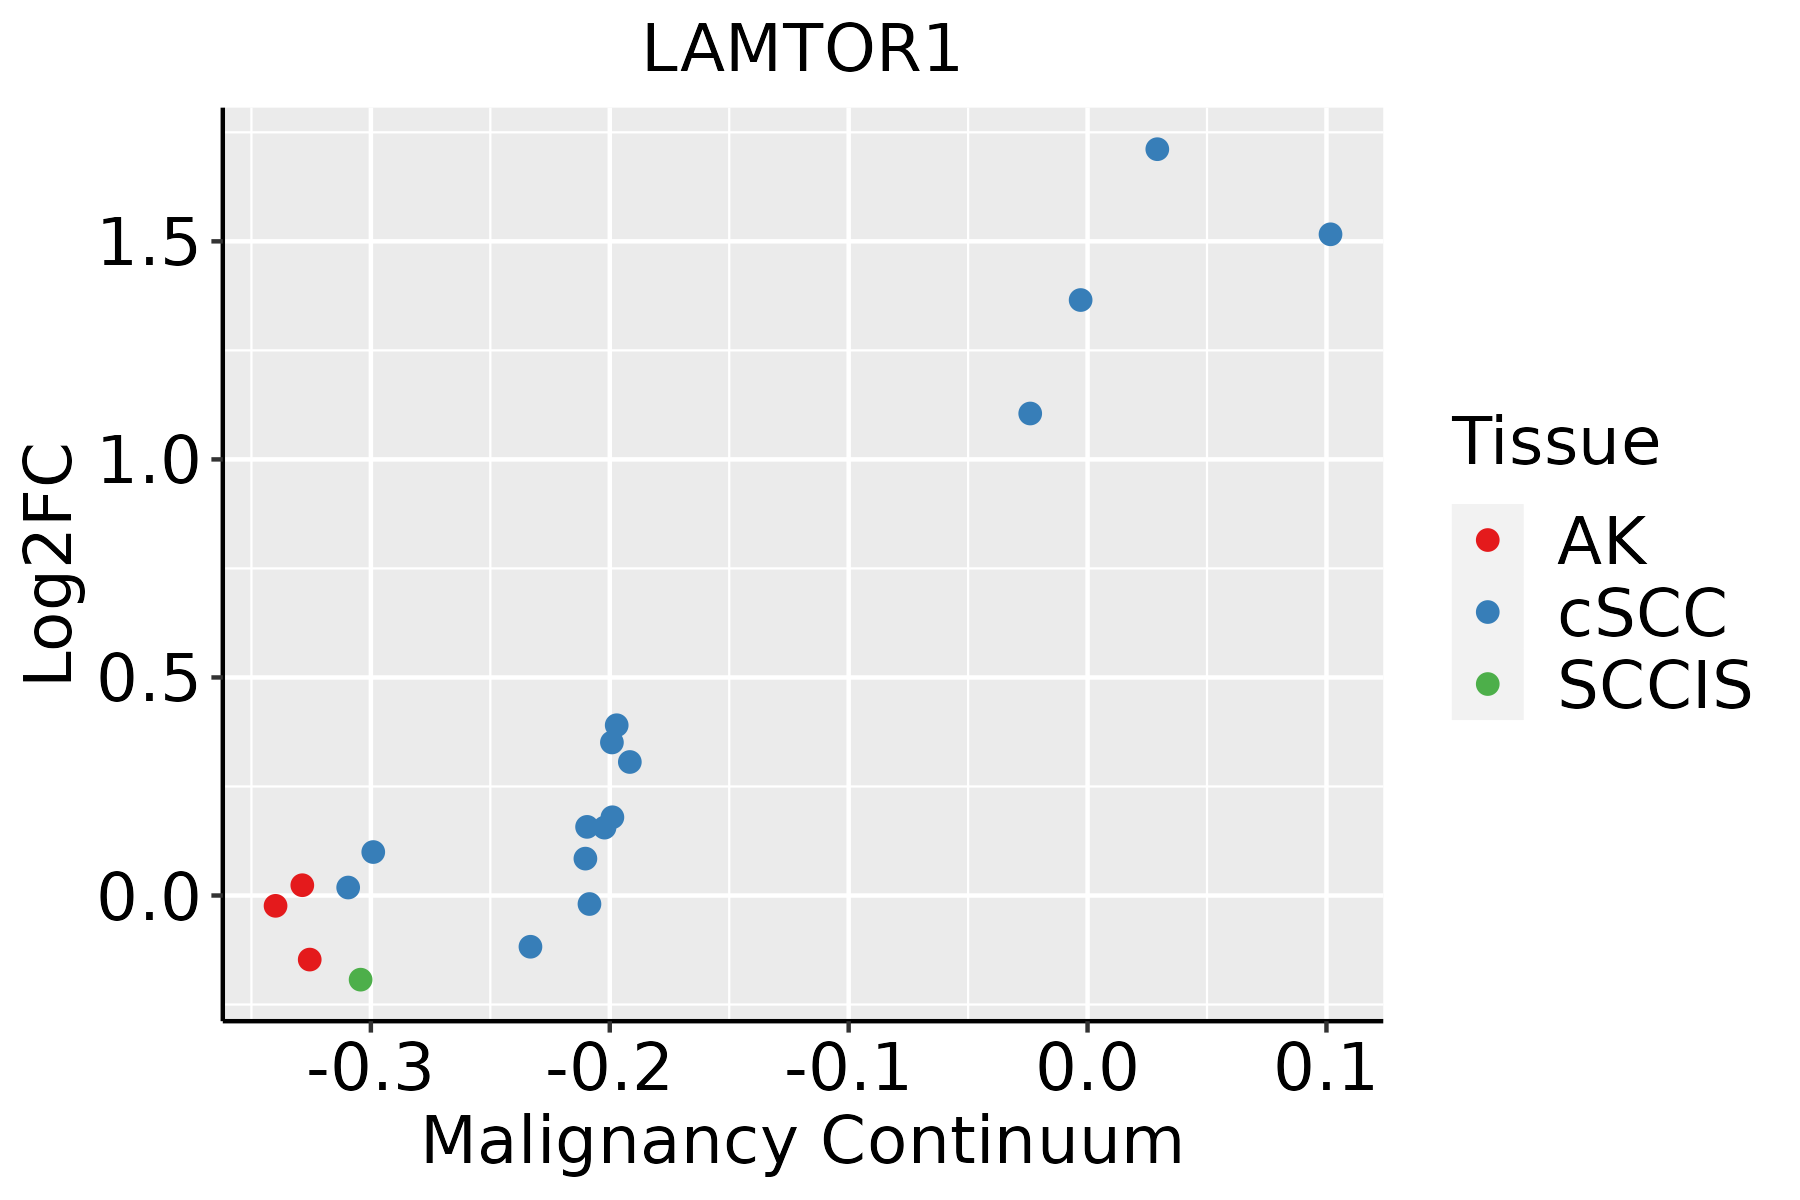 | AK: Actinic keratosis |
| cSCC: Cutaneous squamous cell carcinoma | ||
| SCCIS:squamous cell carcinoma in situ | ||
| Thyroid |  | ATC: Anaplastic thyroid cancer |
| HT: Hashimoto's thyroiditis | ||
| PTC: Papillary thyroid cancer |
| ∗log2FC in expression of this searched gene in stem-like cells from each diseased tissue sample relative to stem-like cells in normal samples in each tissue plotted against the malignancy continuum. Samples are colored based on if they are from different disease stage. |
Top |
Malignant transformation related pathway analysis |
| Find out the enriched GO biological processes and KEGG pathways involved in transition from healthy to precancer to cancer |
| Tissue | Disease Stage | Enriched GO biological Processes |
| Colorectum | AD |  |
| Colorectum | SER |  |
| Colorectum | MSS |  |
| Colorectum | MSI-H |  |
| Colorectum | FAP |  |
| ∗Top 15 enriched GO BP terms are showed in the bar plot of each disease state in each tissue. Each row represents a significant GO biological process which is colored according to the -log10(p.adjust). |
| Page: 1 2 3 4 5 6 7 8 9 |
| GO ID | Tissue | Disease Stage | Description | Gene Ratio | Bg Ratio | pvalue | p.adjust | Count |
| GO:00160497 | Breast | Precancer | cell growth | 46/1080 | 482/18723 | 5.63e-04 | 7.16e-03 | 46 |
| GO:00192164 | Breast | Precancer | regulation of lipid metabolic process | 34/1080 | 331/18723 | 8.14e-04 | 9.55e-03 | 34 |
| GO:00015587 | Breast | Precancer | regulation of cell growth | 39/1080 | 414/18723 | 1.81e-03 | 1.78e-02 | 39 |
| GO:00011015 | Breast | Precancer | response to acid chemical | 16/1080 | 135/18723 | 4.85e-03 | 3.67e-02 | 16 |
| GO:001921612 | Breast | IDC | regulation of lipid metabolic process | 45/1434 | 331/18723 | 1.21e-04 | 2.24e-03 | 45 |
| GO:00192184 | Breast | IDC | regulation of steroid metabolic process | 18/1434 | 100/18723 | 5.40e-04 | 6.96e-03 | 18 |
| GO:001604913 | Breast | IDC | cell growth | 56/1434 | 482/18723 | 1.16e-03 | 1.26e-02 | 56 |
| GO:000155813 | Breast | IDC | regulation of cell growth | 49/1434 | 414/18723 | 1.55e-03 | 1.55e-02 | 49 |
| GO:000110112 | Breast | IDC | response to acid chemical | 20/1434 | 135/18723 | 3.28e-03 | 2.75e-02 | 20 |
| GO:00431126 | Breast | IDC | receptor metabolic process | 23/1434 | 166/18723 | 4.04e-03 | 3.25e-02 | 23 |
| GO:00432003 | Breast | IDC | response to amino acid | 17/1434 | 116/18723 | 7.13e-03 | 4.92e-02 | 17 |
| GO:001921621 | Breast | DCIS | regulation of lipid metabolic process | 43/1390 | 331/18723 | 2.37e-04 | 3.71e-03 | 43 |
| GO:001604923 | Breast | DCIS | cell growth | 54/1390 | 482/18723 | 1.60e-03 | 1.59e-02 | 54 |
| GO:000155822 | Breast | DCIS | regulation of cell growth | 47/1390 | 414/18723 | 2.39e-03 | 2.16e-02 | 47 |
| GO:004311213 | Breast | DCIS | receptor metabolic process | 23/1390 | 166/18723 | 2.75e-03 | 2.41e-02 | 23 |
| GO:001921811 | Breast | DCIS | regulation of steroid metabolic process | 16/1390 | 100/18723 | 2.77e-03 | 2.42e-02 | 16 |
| GO:000110121 | Breast | DCIS | response to acid chemical | 19/1390 | 135/18723 | 5.17e-03 | 3.81e-02 | 19 |
| GO:0016197 | Colorectum | AD | endosomal transport | 90/3918 | 230/18723 | 1.88e-10 | 1.73e-08 | 90 |
| GO:0016050 | Colorectum | AD | vesicle organization | 101/3918 | 300/18723 | 1.65e-07 | 7.17e-06 | 101 |
| GO:0043112 | Colorectum | AD | receptor metabolic process | 62/3918 | 166/18723 | 8.18e-07 | 2.85e-05 | 62 |
| Page: 1 2 3 4 5 6 7 8 9 10 11 12 13 |
| Pathway ID | Tissue | Disease Stage | Description | Gene Ratio | Bg Ratio | pvalue | p.adjust | qvalue | Count |
| hsa04150 | Colorectum | MSS | mTOR signaling pathway | 47/1875 | 156/8465 | 1.19e-02 | 3.99e-02 | 2.44e-02 | 47 |
| hsa041501 | Colorectum | MSS | mTOR signaling pathway | 47/1875 | 156/8465 | 1.19e-02 | 3.99e-02 | 2.44e-02 | 47 |
| hsa041505 | Esophagus | ESCC | mTOR signaling pathway | 98/4205 | 156/8465 | 5.81e-04 | 1.95e-03 | 9.97e-04 | 98 |
| hsa0415013 | Esophagus | ESCC | mTOR signaling pathway | 98/4205 | 156/8465 | 5.81e-04 | 1.95e-03 | 9.97e-04 | 98 |
| hsa041502 | Liver | HCC | mTOR signaling pathway | 95/4020 | 156/8465 | 4.70e-04 | 1.99e-03 | 1.11e-03 | 95 |
| hsa0415011 | Liver | HCC | mTOR signaling pathway | 95/4020 | 156/8465 | 4.70e-04 | 1.99e-03 | 1.11e-03 | 95 |
| hsa041504 | Oral cavity | OSCC | mTOR signaling pathway | 90/3704 | 156/8465 | 2.87e-04 | 9.15e-04 | 4.66e-04 | 90 |
| hsa0415012 | Oral cavity | OSCC | mTOR signaling pathway | 90/3704 | 156/8465 | 2.87e-04 | 9.15e-04 | 4.66e-04 | 90 |
| Page: 1 |
Top |
Cell-cell communication analysis |
| Identification of potential cell-cell interactions between two cell types and their ligand-receptor pairs for different disease states |
| Ligand | Receptor | LRpair | Pathway | Tissue | Disease Stage |
| Page: 1 |
Top |
Single-cell gene regulatory network inference analysis |
| Find out the significant the regulons (TFs) and the target genes of each regulon across cell types for different disease states |
| TF | Cell Type | Tissue | Disease Stage | Target Gene | RSS | Regulon Activity |
| ∗The dot plots of a searched regulon are shown for all cell subpopulations in each disease state of each tissue based on the regulon specific score inferred using pySCENIC and by calculating the average expression. |
| Page: 1 |
Top |
Somatic mutation of malignant transformation related genes |
| Annotation of somatic variants for genes involved in malignant transformation |
| Hugo Symbol | Variant Class | Variant Classification | dbSNP RS | HGVSc | HGVSp | HGVSp Short | SWISSPROT | BIOTYPE | SIFT | PolyPhen | Tumor Sample Barcode | Tissue | Histology | Sex | Age | Stage | Therapy Types | Drugs | Outcome |
| LAMTOR1 | SNV | Missense_Mutation | c.24N>C | p.Glu8Asp | p.E8D | Q6IAA8 | protein_coding | tolerated(0.53) | benign(0) | TCGA-DR-A0ZM-01 | Cervix | cervical & endocervical cancer | Female | <65 | III/IV | Unspecific | Cisplatin | SD | |
| LAMTOR1 | SNV | Missense_Mutation | c.55N>T | p.Arg19Trp | p.R19W | Q6IAA8 | protein_coding | tolerated(0.2) | benign(0.047) | TCGA-CM-6162-01 | Colorectum | colon adenocarcinoma | Female | <65 | III/IV | Chemotherapy | oxaliplatin | SD | |
| LAMTOR1 | SNV | Missense_Mutation | rs761347517 | c.271N>T | p.Arg91Cys | p.R91C | Q6IAA8 | protein_coding | tolerated(0.09) | benign(0.018) | TCGA-WS-AB45-01 | Colorectum | colon adenocarcinoma | Female | <65 | I/II | Unknown | Unknown | SD |
| LAMTOR1 | insertion | Frame_Shift_Ins | novel | c.86dupC | p.Thr30TyrfsTer20 | p.T30Yfs*20 | Q6IAA8 | protein_coding | TCGA-AA-3947-01 | Colorectum | colon adenocarcinoma | Female | <65 | I/II | Unknown | Unknown | SD | ||
| LAMTOR1 | SNV | Missense_Mutation | c.272N>A | p.Arg91His | p.R91H | Q6IAA8 | protein_coding | tolerated(0.07) | benign(0.018) | TCGA-AP-A059-01 | Endometrium | uterine corpus endometrioid carcinoma | Female | >=65 | I/II | Unknown | Unknown | SD | |
| LAMTOR1 | SNV | Missense_Mutation | novel | c.98N>C | p.Leu33Pro | p.L33P | Q6IAA8 | protein_coding | tolerated(0.28) | benign(0) | TCGA-AP-A1DK-01 | Endometrium | uterine corpus endometrioid carcinoma | Female | <65 | I/II | Unknown | Unknown | SD |
| LAMTOR1 | SNV | Missense_Mutation | rs370533903 | c.251N>A | p.Arg84His | p.R84H | Q6IAA8 | protein_coding | deleterious(0) | probably_damaging(0.984) | TCGA-B5-A11E-01 | Endometrium | uterine corpus endometrioid carcinoma | Female | <65 | I/II | Unknown | Unknown | SD |
| LAMTOR1 | SNV | Missense_Mutation | rs564426310 | c.136N>A | p.Ala46Thr | p.A46T | Q6IAA8 | protein_coding | tolerated(0.72) | benign(0) | TCGA-B5-A3FC-01 | Endometrium | uterine corpus endometrioid carcinoma | Female | <65 | I/II | Unknown | Unknown | SD |
| LAMTOR1 | SNV | Missense_Mutation | c.272N>A | p.Arg91His | p.R91H | Q6IAA8 | protein_coding | tolerated(0.07) | benign(0.018) | TCGA-EO-A22R-01 | Endometrium | uterine corpus endometrioid carcinoma | Female | <65 | I/II | Unknown | Unknown | SD | |
| LAMTOR1 | SNV | Missense_Mutation | rs564426310 | c.136G>A | p.Ala46Thr | p.A46T | Q6IAA8 | protein_coding | tolerated(0.72) | benign(0) | TCGA-EO-A22U-01 | Endometrium | uterine corpus endometrioid carcinoma | Female | >=65 | I/II | Unknown | Unknown | SD |
| Page: 1 2 |
Top |
Related drugs of malignant transformation related genes |
| Identification of chemicals and drugs interact with genes involved in malignant transfromation |
| (DGIdb 4.0) |
| Entrez ID | Symbol | Category | Interaction Types | Drug Claim Name | Drug Name | PMIDs |
| Page: 1 |

Copyright 2023-Present -The University of Texas Health Science Center at Houston |