
|
|||||
|
 | |
| |
| |
| |
| |
| |
|
Gene: KLK10 |
Gene summary for KLK10 |
| Gene information | Species | Human | Gene symbol | KLK10 | Gene ID | 5655 |
| Gene name | kallikrein related peptidase 10 | |
| Gene Alias | NES1 | |
| Cytomap | 19q13.41 | |
| Gene Type | protein-coding | GO ID | GO:0006508 | UniProtAcc | O43240 |
Top |
Malignant transformation analysis |
| Identification of the aberrant gene expression in precancerous and cancerous lesions by comparing the gene expression of stem-like cells in diseased tissues with normal stem cells |
| Entrez ID | Symbol | Replicates | Species | Organ | Tissue | Adj P-value | Log2FC | Malignancy |
| 5655 | KLK10 | P47T-E | Human | Esophagus | ESCC | 1.24e-33 | 1.46e+00 | 0.1067 |
| 5655 | KLK10 | P48T-E | Human | Esophagus | ESCC | 4.98e-09 | 3.94e-01 | 0.0959 |
| 5655 | KLK10 | P49T-E | Human | Esophagus | ESCC | 3.17e-10 | 2.39e+00 | 0.1768 |
| 5655 | KLK10 | P52T-E | Human | Esophagus | ESCC | 1.65e-17 | 9.81e-01 | 0.1555 |
| 5655 | KLK10 | P61T-E | Human | Esophagus | ESCC | 3.33e-22 | 1.04e+00 | 0.099 |
| 5655 | KLK10 | P62T-E | Human | Esophagus | ESCC | 3.99e-21 | 1.23e+00 | 0.1302 |
| 5655 | KLK10 | P65T-E | Human | Esophagus | ESCC | 4.10e-02 | 5.56e-01 | 0.0978 |
| 5655 | KLK10 | P74T-E | Human | Esophagus | ESCC | 6.74e-49 | 2.65e+00 | 0.1479 |
| 5655 | KLK10 | P80T-E | Human | Esophagus | ESCC | 6.16e-20 | 1.29e+00 | 0.155 |
| 5655 | KLK10 | P82T-E | Human | Esophagus | ESCC | 2.73e-11 | 1.78e+00 | 0.1072 |
| 5655 | KLK10 | P84T-E | Human | Esophagus | ESCC | 4.30e-11 | 2.18e+00 | 0.0933 |
| 5655 | KLK10 | P89T-E | Human | Esophagus | ESCC | 3.47e-09 | 1.16e+00 | 0.1752 |
| 5655 | KLK10 | P91T-E | Human | Esophagus | ESCC | 4.44e-10 | 2.42e+00 | 0.1828 |
| 5655 | KLK10 | P107T-E | Human | Esophagus | ESCC | 7.99e-04 | 5.70e-01 | 0.171 |
| 5655 | KLK10 | P127T-E | Human | Esophagus | ESCC | 3.23e-17 | 9.31e-01 | 0.0826 |
| 5655 | KLK10 | P128T-E | Human | Esophagus | ESCC | 3.33e-04 | 4.51e-01 | 0.1241 |
| 5655 | KLK10 | C04 | Human | Oral cavity | OSCC | 7.73e-22 | 2.33e+00 | 0.2633 |
| 5655 | KLK10 | C21 | Human | Oral cavity | OSCC | 2.58e-37 | 2.29e+00 | 0.2678 |
| 5655 | KLK10 | C30 | Human | Oral cavity | OSCC | 9.16e-33 | 1.76e+00 | 0.3055 |
| 5655 | KLK10 | C38 | Human | Oral cavity | OSCC | 2.04e-03 | 7.74e-01 | 0.172 |
| Page: 1 2 3 4 |
| Tissue | Expression Dynamics | Abbreviation |
| Breast | 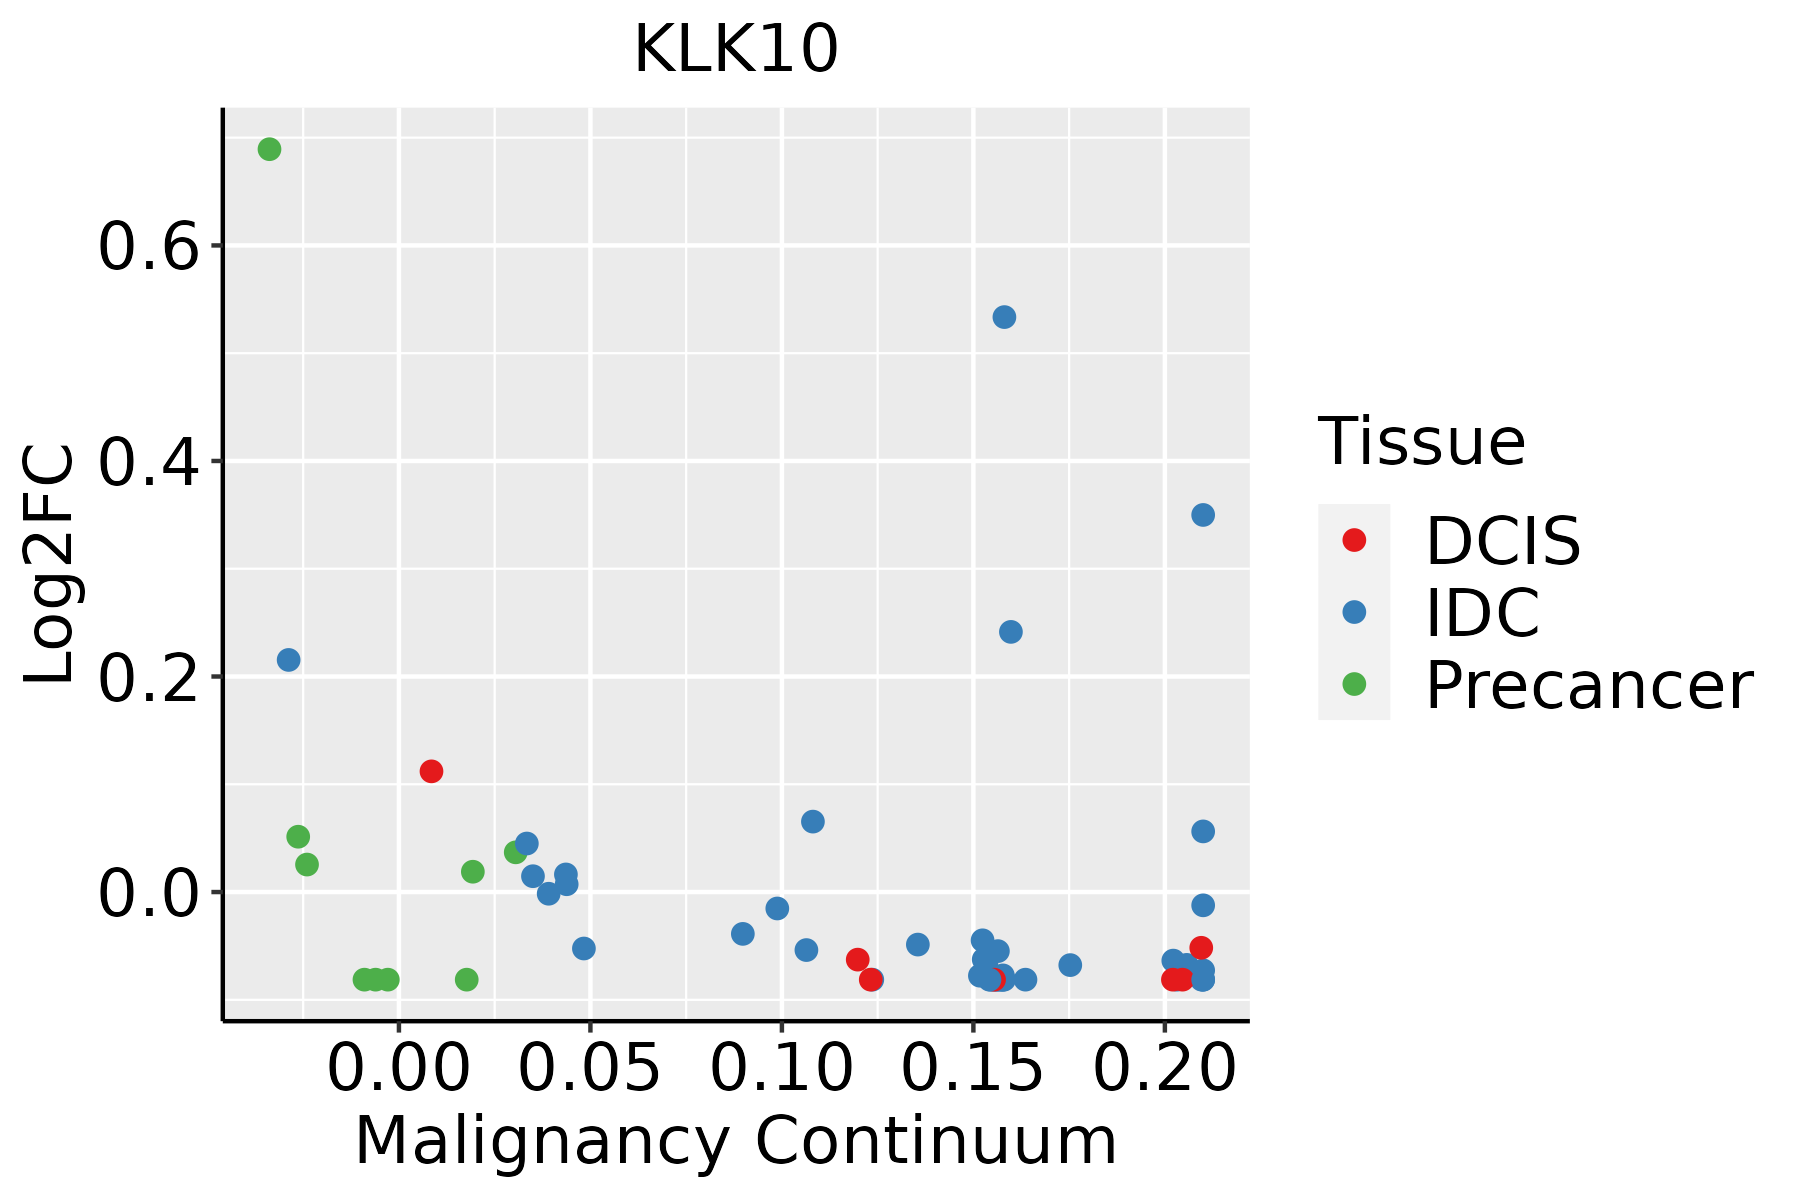 | IDC: Invasive ductal carcinoma |
| DCIS: Ductal carcinoma in situ | ||
| Precancer(BRCA1-mut): Precancerous lesion from BRCA1 mutation carriers | ||
| Cervix | 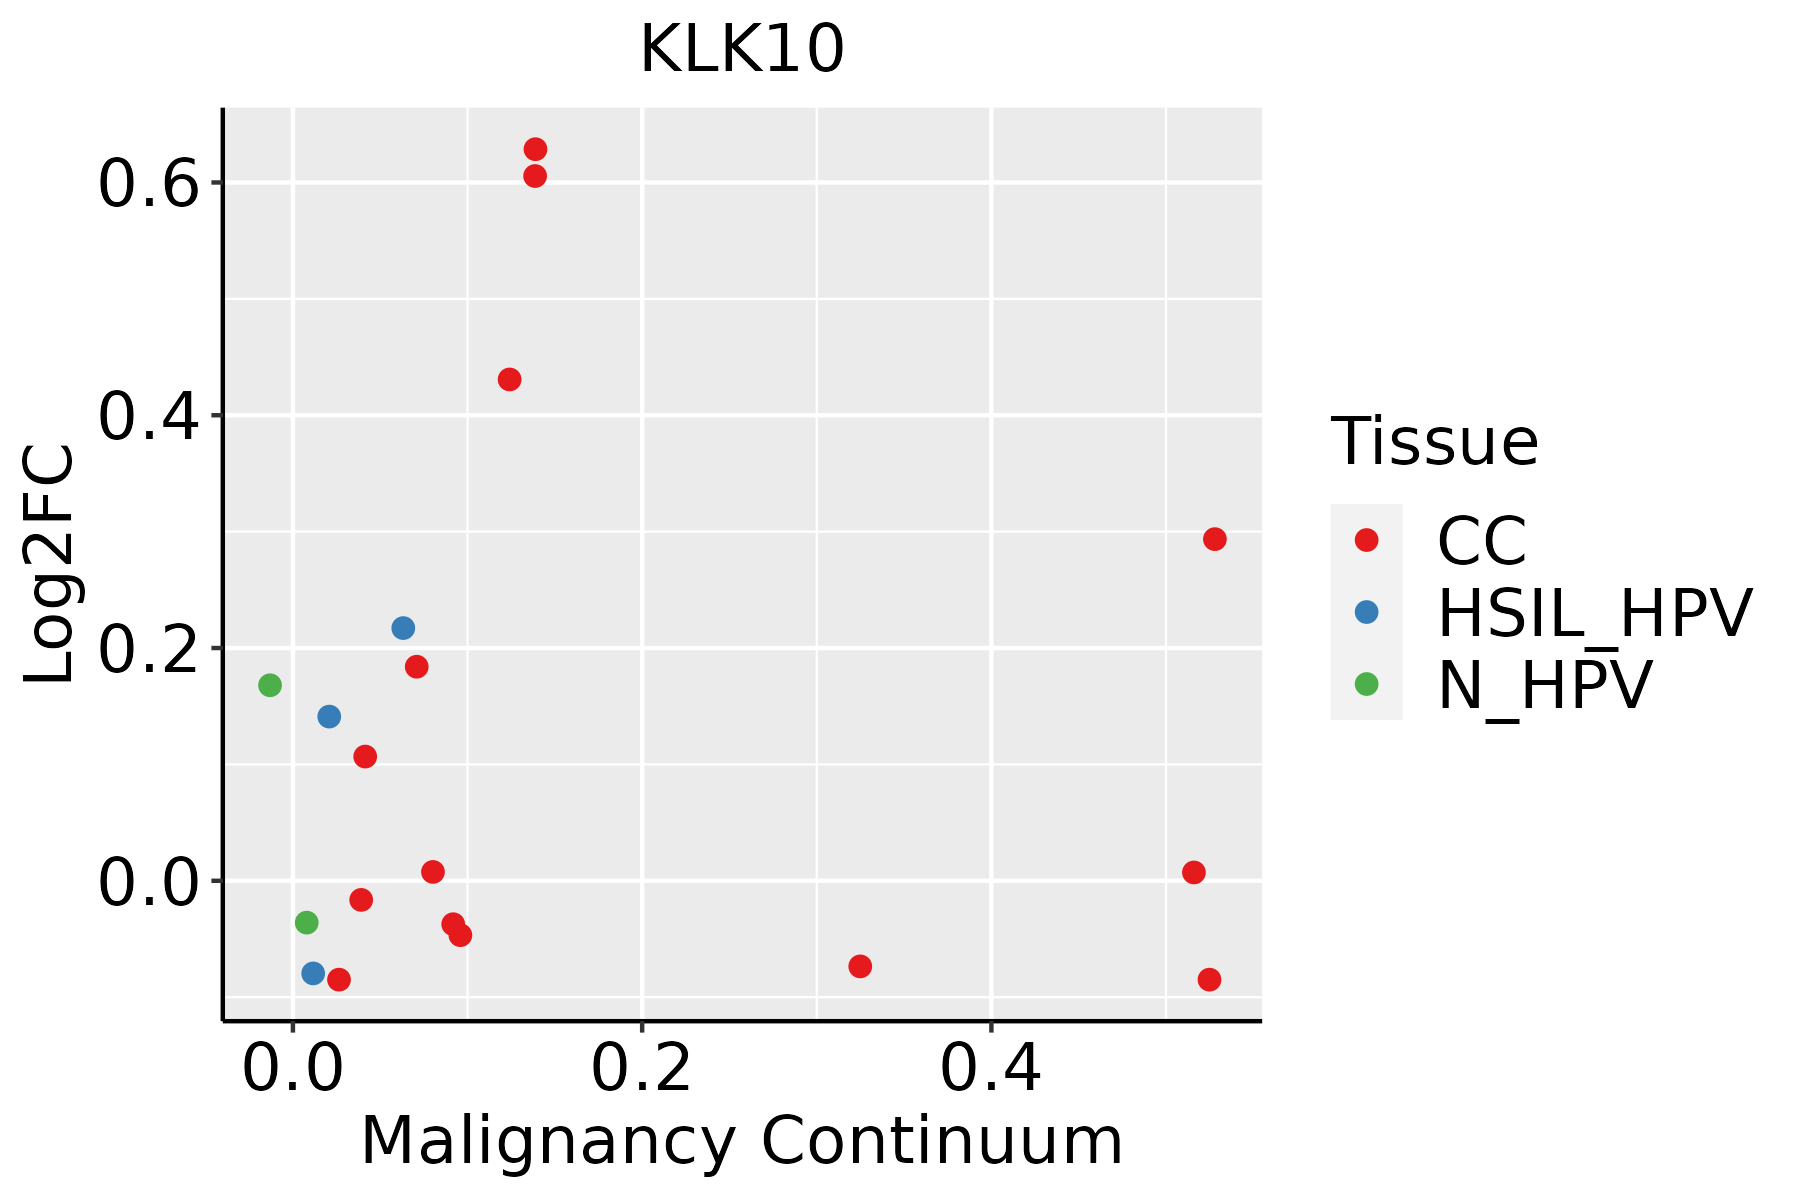 | CC: Cervix cancer |
| HSIL_HPV: HPV-infected high-grade squamous intraepithelial lesions | ||
| N_HPV: HPV-infected normal cervix | ||
| Esophagus |  | ESCC: Esophageal squamous cell carcinoma |
| HGIN: High-grade intraepithelial neoplasias | ||
| LGIN: Low-grade intraepithelial neoplasias | ||
| GC | 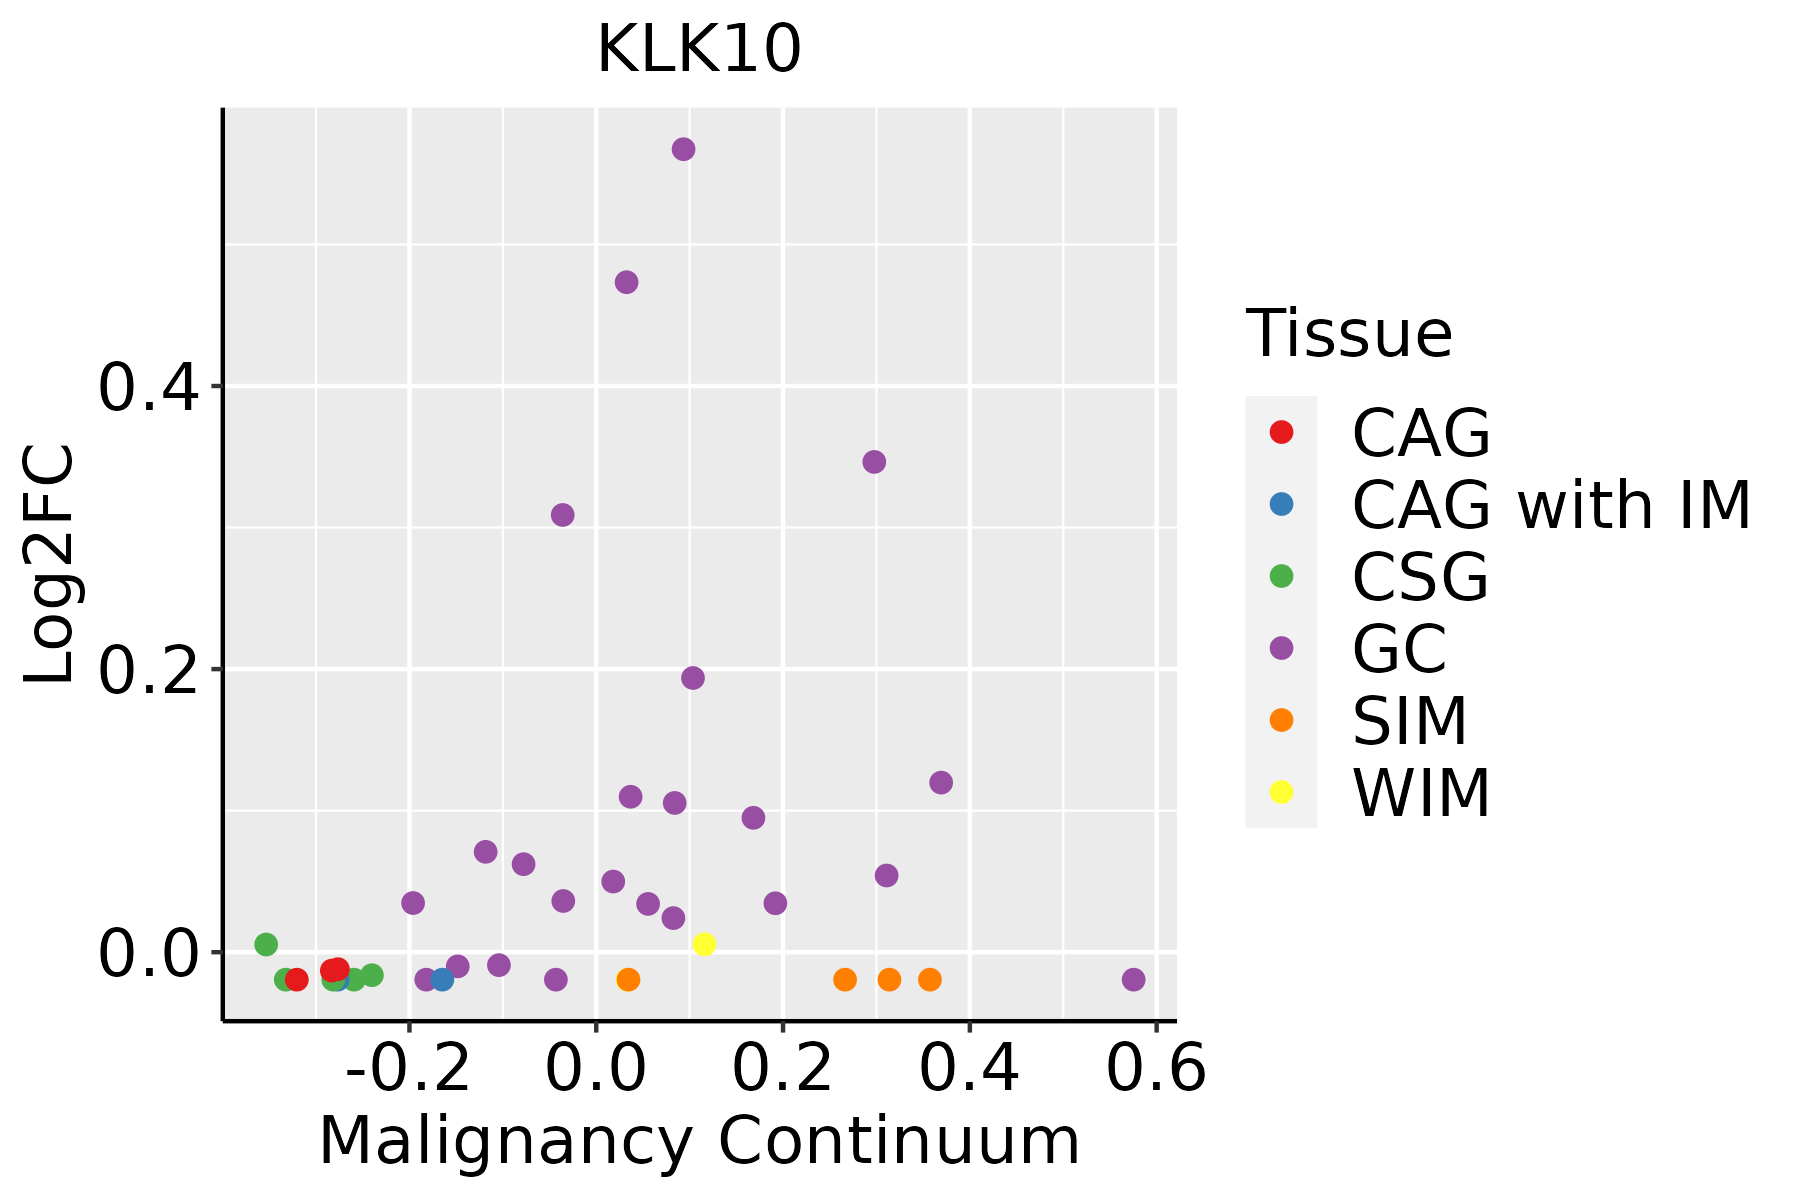 | CAG: Chronic atrophic gastritis |
| CAG with IM: Chronic atrophic gastritis with intestinal metaplasia | ||
| CSG: Chronic superficial gastritis | ||
| GC: Gastric cancer | ||
| SIM: Severe intestinal metaplasia | ||
| WIM: Wild intestinal metaplasia | ||
| Oral Cavity | 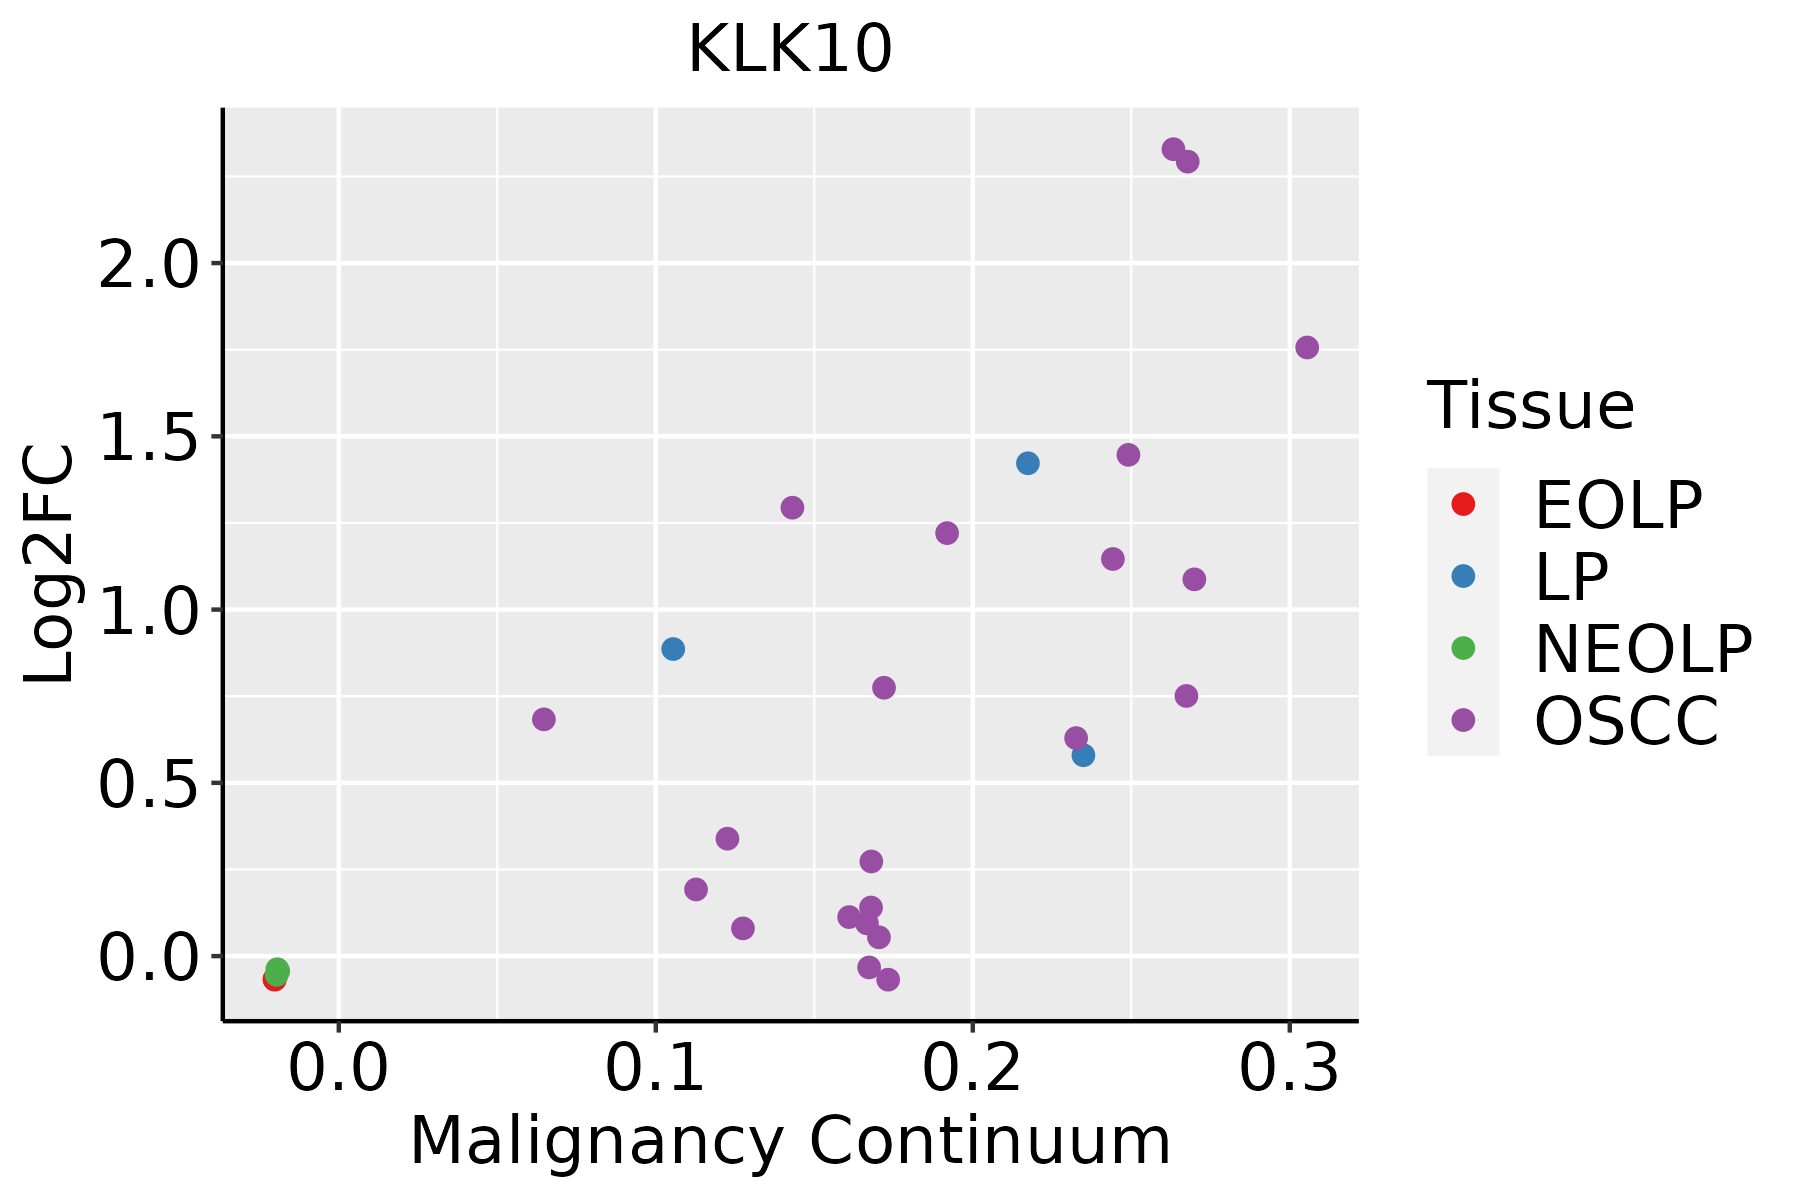 | EOLP: Erosive Oral lichen planus |
| LP: leukoplakia | ||
| NEOLP: Non-erosive oral lichen planus | ||
| OSCC: Oral squamous cell carcinoma | ||
| Thyroid |  | ATC: Anaplastic thyroid cancer |
| HT: Hashimoto's thyroiditis | ||
| PTC: Papillary thyroid cancer |
| ∗log2FC in expression of this searched gene in stem-like cells from each diseased tissue sample relative to stem-like cells in normal samples in each tissue plotted against the malignancy continuum. Samples are colored based on if they are from different disease stage. |
Top |
Malignant transformation related pathway analysis |
| Find out the enriched GO biological processes and KEGG pathways involved in transition from healthy to precancer to cancer |
| Tissue | Disease Stage | Enriched GO biological Processes |
| Colorectum | AD |  |
| Colorectum | SER |  |
| Colorectum | MSS |  |
| Colorectum | MSI-H |  |
| Colorectum | FAP |  |
| ∗Top 15 enriched GO BP terms are showed in the bar plot of each disease state in each tissue. Each row represents a significant GO biological process which is colored according to the -log10(p.adjust). |
| Page: 1 2 3 4 5 6 7 8 9 |
| GO ID | Tissue | Disease Stage | Description | Gene Ratio | Bg Ratio | pvalue | p.adjust | Count |
| Page: 1 |
| Pathway ID | Tissue | Disease Stage | Description | Gene Ratio | Bg Ratio | pvalue | p.adjust | qvalue | Count |
| Page: 1 |
Top |
Cell-cell communication analysis |
| Identification of potential cell-cell interactions between two cell types and their ligand-receptor pairs for different disease states |
| Ligand | Receptor | LRpair | Pathway | Tissue | Disease Stage |
| Page: 1 |
Top |
Single-cell gene regulatory network inference analysis |
| Find out the significant the regulons (TFs) and the target genes of each regulon across cell types for different disease states |
| TF | Cell Type | Tissue | Disease Stage | Target Gene | RSS | Regulon Activity |
| ∗The dot plots of a searched regulon are shown for all cell subpopulations in each disease state of each tissue based on the regulon specific score inferred using pySCENIC and by calculating the average expression. |
| Page: 1 |
Top |
Somatic mutation of malignant transformation related genes |
| Annotation of somatic variants for genes involved in malignant transformation |
| Hugo Symbol | Variant Class | Variant Classification | dbSNP RS | HGVSc | HGVSp | HGVSp Short | SWISSPROT | BIOTYPE | SIFT | PolyPhen | Tumor Sample Barcode | Tissue | Histology | Sex | Age | Stage | Therapy Types | Drugs | Outcome |
| KLK10 | SNV | Missense_Mutation | c.682N>A | p.Asp228Asn | p.D228N | O43240 | protein_coding | deleterious(0) | probably_damaging(1) | TCGA-D8-A1J9-01 | Breast | breast invasive carcinoma | Female | <65 | I/II | Unknown | Unknown | SD | |
| KLK10 | SNV | Missense_Mutation | novel | c.368A>G | p.Gln123Arg | p.Q123R | O43240 | protein_coding | tolerated(0.52) | benign(0.003) | TCGA-E9-A3HO-01 | Breast | breast invasive carcinoma | Female | <65 | I/II | Chemotherapy | cyclophosphamide | CR |
| KLK10 | SNV | Missense_Mutation | novel | c.395N>A | p.Arg132Gln | p.R132Q | O43240 | protein_coding | tolerated(0.15) | benign(0.216) | TCGA-ZJ-AAXN-01 | Cervix | cervical & endocervical cancer | Female | <65 | I/II | Unknown | Unknown | SD |
| KLK10 | SNV | Missense_Mutation | novel | c.94G>A | p.Glu32Lys | p.E32K | O43240 | protein_coding | tolerated(0.08) | benign(0.114) | TCGA-ZJ-AAXT-01 | Cervix | cervical & endocervical cancer | Female | <65 | III/IV | Unknown | Unknown | SD |
| KLK10 | SNV | Missense_Mutation | rs781235008 | c.329N>A | p.Arg110His | p.R110H | O43240 | protein_coding | deleterious(0.03) | probably_damaging(0.976) | TCGA-AZ-6601-01 | Colorectum | colon adenocarcinoma | Male | >=65 | I/II | Unknown | Unknown | PD |
| KLK10 | SNV | Missense_Mutation | novel | c.607G>A | p.Val203Ile | p.V203I | O43240 | protein_coding | tolerated(0.19) | benign(0.007) | TCGA-A5-A0G2-01 | Endometrium | uterine corpus endometrioid carcinoma | Female | <65 | III/IV | Unknown | Unknown | SD |
| KLK10 | SNV | Missense_Mutation | c.762G>T | p.Gln254His | p.Q254H | O43240 | protein_coding | tolerated(0.09) | benign(0.041) | TCGA-AJ-A3EK-01 | Endometrium | uterine corpus endometrioid carcinoma | Female | <65 | I/II | Chemotherapy | carboplatin | CR | |
| KLK10 | SNV | Missense_Mutation | rs146426256 | c.341G>A | p.Arg114His | p.R114H | O43240 | protein_coding | tolerated(0.2) | benign(0.068) | TCGA-B5-A3FC-01 | Endometrium | uterine corpus endometrioid carcinoma | Female | <65 | I/II | Unknown | Unknown | SD |
| KLK10 | SNV | Missense_Mutation | c.805A>G | p.Ile269Val | p.I269V | O43240 | protein_coding | deleterious(0.03) | probably_damaging(0.933) | TCGA-BS-A0UV-01 | Endometrium | uterine corpus endometrioid carcinoma | Female | <65 | III/IV | Unknown | Unknown | SD | |
| KLK10 | SNV | Missense_Mutation | rs146426256 | c.341G>A | p.Arg114His | p.R114H | O43240 | protein_coding | tolerated(0.2) | benign(0.068) | TCGA-BS-A0UV-01 | Endometrium | uterine corpus endometrioid carcinoma | Female | <65 | III/IV | Unknown | Unknown | SD |
| Page: 1 2 |
Top |
Related drugs of malignant transformation related genes |
| Identification of chemicals and drugs interact with genes involved in malignant transfromation |
| (DGIdb 4.0) |
| Entrez ID | Symbol | Category | Interaction Types | Drug Claim Name | Drug Name | PMIDs |
| Page: 1 |

Copyright 2023-Present -The University of Texas Health Science Center at Houston |