
|
|||||
|
 | |
| |
| |
| |
| |
| |
|
Gene: KLF11 |
Gene summary for KLF11 |
| Gene information | Species | Human | Gene symbol | KLF11 | Gene ID | 8462 |
| Gene name | Kruppel like factor 11 | |
| Gene Alias | FKLF | |
| Cytomap | 2p25.1 | |
| Gene Type | protein-coding | GO ID | GO:0000082 | UniProtAcc | B7ZAX4 |
Top |
Malignant transformation analysis |
| Identification of the aberrant gene expression in precancerous and cancerous lesions by comparing the gene expression of stem-like cells in diseased tissues with normal stem cells |
| Entrez ID | Symbol | Replicates | Species | Organ | Tissue | Adj P-value | Log2FC | Malignancy |
| 8462 | KLF11 | P80T-E | Human | Esophagus | ESCC | 1.49e-20 | 7.44e-01 | 0.155 |
| 8462 | KLF11 | P82T-E | Human | Esophagus | ESCC | 1.47e-02 | 1.18e-01 | 0.1072 |
| 8462 | KLF11 | P83T-E | Human | Esophagus | ESCC | 2.32e-14 | 3.22e-01 | 0.1738 |
| 8462 | KLF11 | P84T-E | Human | Esophagus | ESCC | 8.01e-03 | 9.03e-02 | 0.0933 |
| 8462 | KLF11 | P107T-E | Human | Esophagus | ESCC | 7.58e-08 | 3.13e-01 | 0.171 |
| 8462 | KLF11 | P126T-E | Human | Esophagus | ESCC | 2.43e-04 | 6.82e-01 | 0.1125 |
| 8462 | KLF11 | P127T-E | Human | Esophagus | ESCC | 8.90e-15 | 2.18e-01 | 0.0826 |
| 8462 | KLF11 | P128T-E | Human | Esophagus | ESCC | 1.10e-13 | 5.33e-01 | 0.1241 |
| 8462 | KLF11 | P130T-E | Human | Esophagus | ESCC | 1.08e-15 | 3.38e-01 | 0.1676 |
| 8462 | KLF11 | C43 | Human | Oral cavity | OSCC | 2.70e-22 | 5.69e-01 | 0.1704 |
| 8462 | KLF11 | C46 | Human | Oral cavity | OSCC | 2.08e-28 | 8.85e-01 | 0.1673 |
| 8462 | KLF11 | C57 | Human | Oral cavity | OSCC | 8.65e-12 | 3.96e-01 | 0.1679 |
| 8462 | KLF11 | C08 | Human | Oral cavity | OSCC | 1.53e-11 | 5.04e-01 | 0.1919 |
| 8462 | KLF11 | LN46 | Human | Oral cavity | OSCC | 4.55e-26 | 1.10e+00 | 0.1666 |
| 8462 | KLF11 | NEOLP-2 | Human | Oral cavity | NEOLP | 5.52e-03 | 1.89e-01 | -0.0196 |
| 8462 | KLF11 | SYSMH3 | Human | Oral cavity | OSCC | 5.61e-04 | 1.49e-01 | 0.2442 |
| 8462 | KLF11 | P5_S10_cSCC | Human | Skin | cSCC | 4.49e-02 | -2.03e-02 | -0.299 |
| 8462 | KLF11 | P1_cSCC | Human | Skin | cSCC | 4.50e-04 | 3.20e-01 | 0.0292 |
| 8462 | KLF11 | P4_cSCC | Human | Skin | cSCC | 2.25e-02 | 9.75e-02 | -0.00290000000000005 |
| 8462 | KLF11 | cSCC_p4 | Human | Skin | cSCC | 6.27e-03 | 6.29e-02 | -0.2022 |
| Page: 1 2 3 |
| Tissue | Expression Dynamics | Abbreviation |
| Esophagus | 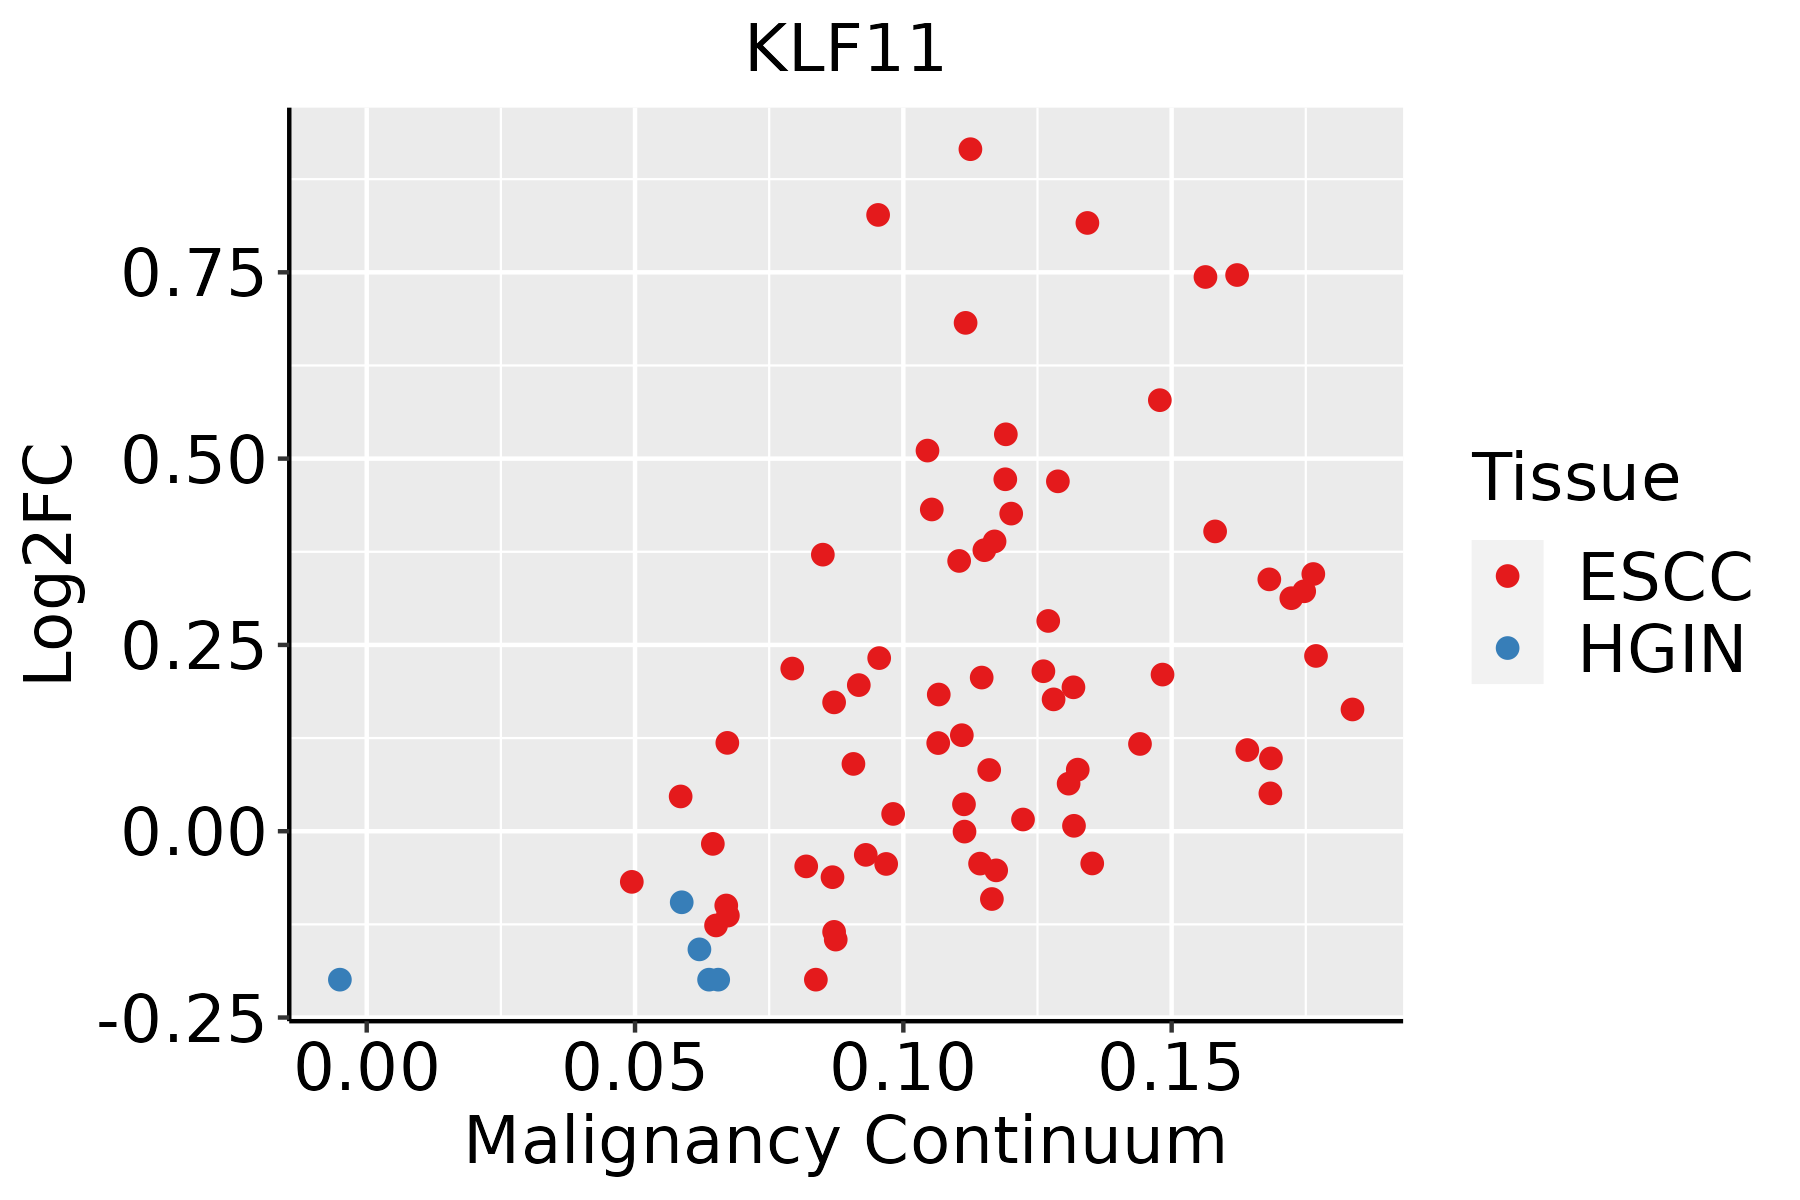 | ESCC: Esophageal squamous cell carcinoma |
| HGIN: High-grade intraepithelial neoplasias | ||
| LGIN: Low-grade intraepithelial neoplasias | ||
| Oral Cavity | 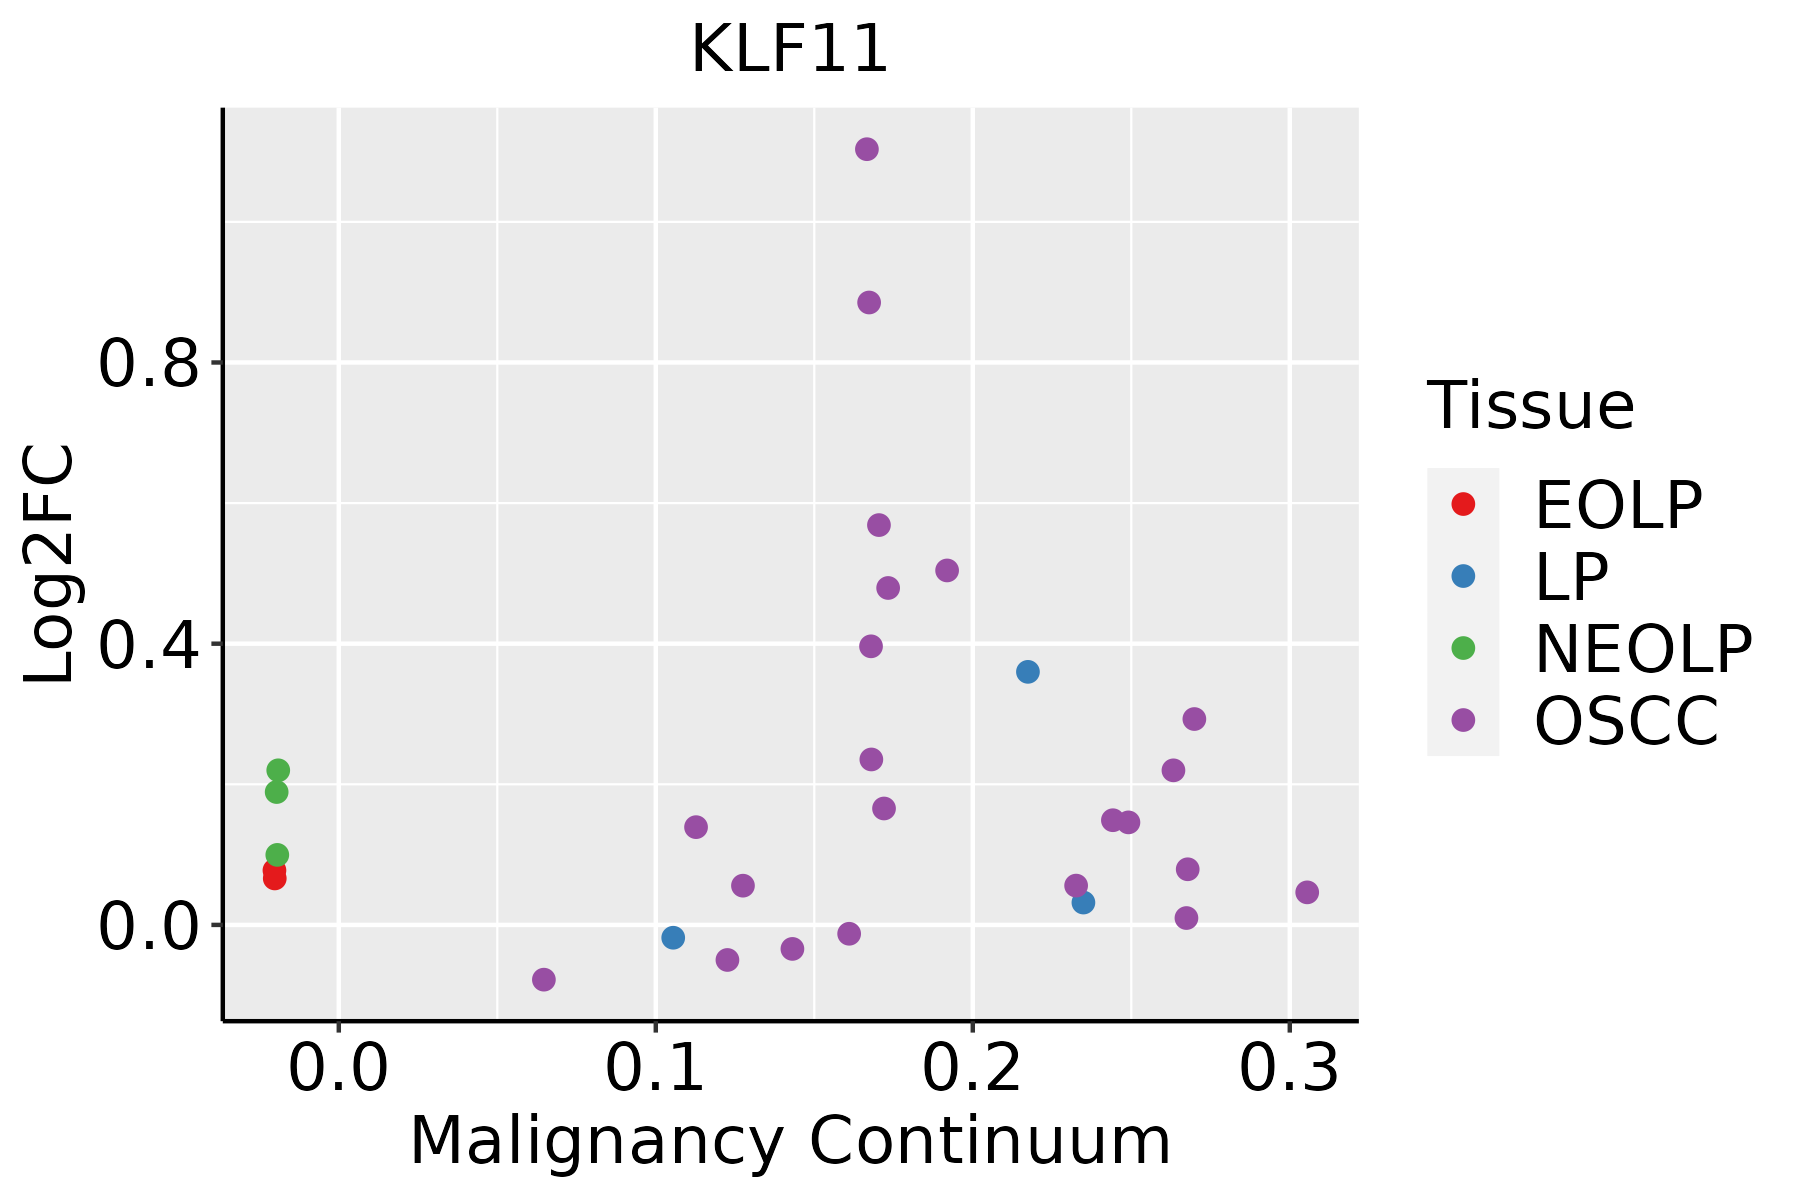 | EOLP: Erosive Oral lichen planus |
| LP: leukoplakia | ||
| NEOLP: Non-erosive oral lichen planus | ||
| OSCC: Oral squamous cell carcinoma | ||
| Skin | 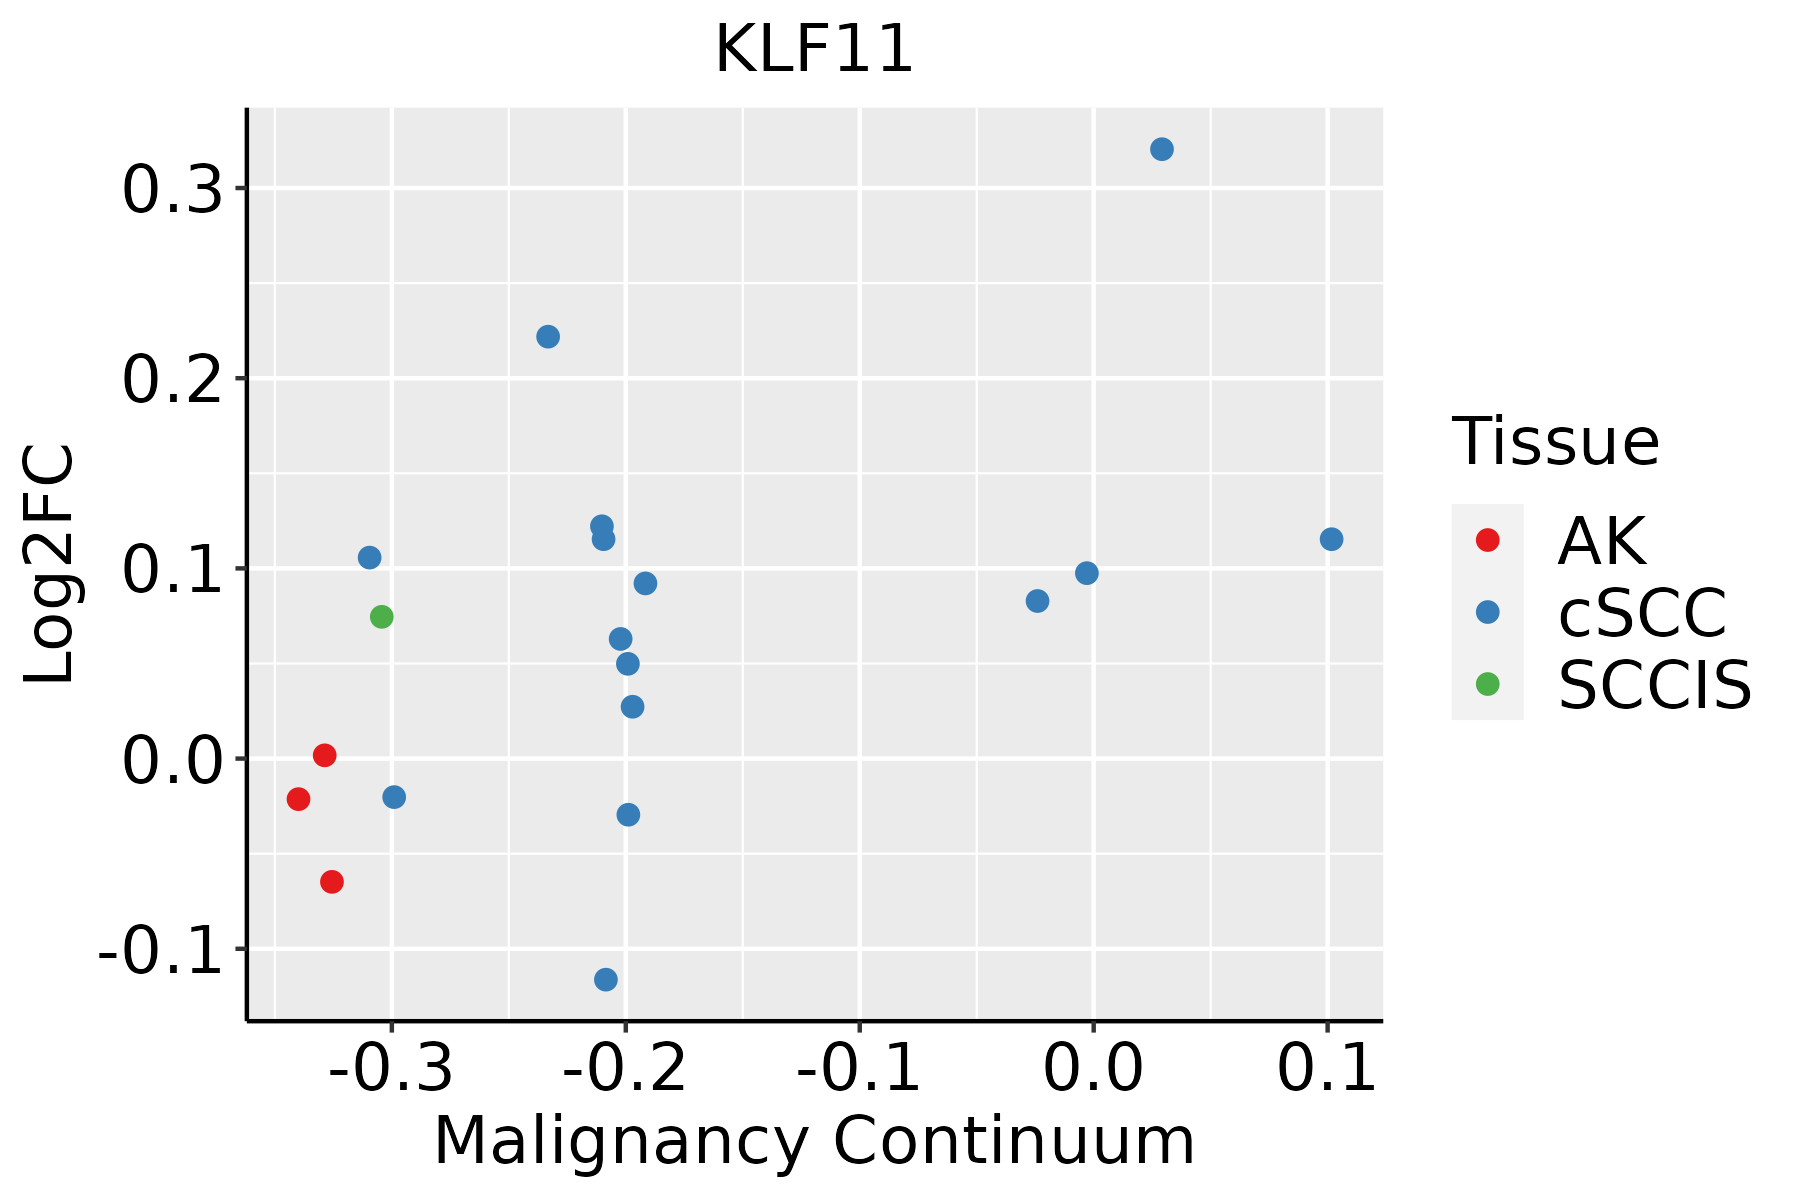 | AK: Actinic keratosis |
| cSCC: Cutaneous squamous cell carcinoma | ||
| SCCIS:squamous cell carcinoma in situ |
| ∗log2FC in expression of this searched gene in stem-like cells from each diseased tissue sample relative to stem-like cells in normal samples in each tissue plotted against the malignancy continuum. Samples are colored based on if they are from different disease stage. |
Top |
Malignant transformation related pathway analysis |
| Find out the enriched GO biological processes and KEGG pathways involved in transition from healthy to precancer to cancer |
| Tissue | Disease Stage | Enriched GO biological Processes |
| Colorectum | AD |  |
| Colorectum | SER |  |
| Colorectum | MSS |  |
| Colorectum | MSI-H |  |
| Colorectum | FAP |  |
| ∗Top 15 enriched GO BP terms are showed in the bar plot of each disease state in each tissue. Each row represents a significant GO biological process which is colored according to the -log10(p.adjust). |
| Page: 1 2 3 4 5 6 7 8 9 |
| GO ID | Tissue | Disease Stage | Description | Gene Ratio | Bg Ratio | pvalue | p.adjust | Count |
| GO:004477216 | Esophagus | ESCC | mitotic cell cycle phase transition | 281/8552 | 424/18723 | 4.63e-18 | 4.45e-16 | 281 |
| GO:000008214 | Esophagus | ESCC | G1/S transition of mitotic cell cycle | 134/8552 | 214/18723 | 4.04e-07 | 5.55e-06 | 134 |
| GO:004484314 | Esophagus | ESCC | cell cycle G1/S phase transition | 148/8552 | 241/18723 | 5.68e-07 | 7.48e-06 | 148 |
| GO:190165319 | Esophagus | ESCC | cellular response to peptide | 208/8552 | 359/18723 | 1.68e-06 | 2.01e-05 | 208 |
| GO:00447728 | Oral cavity | OSCC | mitotic cell cycle phase transition | 255/7305 | 424/18723 | 5.29e-19 | 6.98e-17 | 255 |
| GO:190165316 | Oral cavity | OSCC | cellular response to peptide | 194/7305 | 359/18723 | 4.31e-09 | 9.57e-08 | 194 |
| GO:00000826 | Oral cavity | OSCC | G1/S transition of mitotic cell cycle | 120/7305 | 214/18723 | 2.86e-07 | 4.40e-06 | 120 |
| GO:00448436 | Oral cavity | OSCC | cell cycle G1/S phase transition | 131/7305 | 241/18723 | 8.77e-07 | 1.20e-05 | 131 |
| GO:190165331 | Oral cavity | NEOLP | cellular response to peptide | 78/2005 | 359/18723 | 7.21e-10 | 5.54e-08 | 78 |
| GO:000008231 | Oral cavity | NEOLP | G1/S transition of mitotic cell cycle | 40/2005 | 214/18723 | 3.21e-04 | 3.11e-03 | 40 |
| GO:004477231 | Oral cavity | NEOLP | mitotic cell cycle phase transition | 67/2005 | 424/18723 | 7.30e-04 | 5.98e-03 | 67 |
| GO:004484331 | Oral cavity | NEOLP | cell cycle G1/S phase transition | 41/2005 | 241/18723 | 1.87e-03 | 1.28e-02 | 41 |
| GO:004477223 | Skin | cSCC | mitotic cell cycle phase transition | 180/4864 | 424/18723 | 7.09e-14 | 4.45e-12 | 180 |
| GO:000008222 | Skin | cSCC | G1/S transition of mitotic cell cycle | 85/4864 | 214/18723 | 6.90e-06 | 9.60e-05 | 85 |
| GO:004484322 | Skin | cSCC | cell cycle G1/S phase transition | 92/4864 | 241/18723 | 1.95e-05 | 2.28e-04 | 92 |
| GO:1901653110 | Skin | cSCC | cellular response to peptide | 124/4864 | 359/18723 | 1.75e-04 | 1.49e-03 | 124 |
| Page: 1 |
| Pathway ID | Tissue | Disease Stage | Description | Gene Ratio | Bg Ratio | pvalue | p.adjust | qvalue | Count |
| Page: 1 |
Top |
Cell-cell communication analysis |
| Identification of potential cell-cell interactions between two cell types and their ligand-receptor pairs for different disease states |
| Ligand | Receptor | LRpair | Pathway | Tissue | Disease Stage |
| Page: 1 |
Top |
Single-cell gene regulatory network inference analysis |
| Find out the significant the regulons (TFs) and the target genes of each regulon across cell types for different disease states |
| TF | Cell Type | Tissue | Disease Stage | Target Gene | RSS | Regulon Activity |
| KLF11 | M1MAC | Breast | IDC | PCYT1A,NBL1,HYAL2, etc. | 2.09e-01 |  |
| KLF11 | PVA | Pancreas | Healthy | AQP7,ZNF93,ALG10B, etc. | 6.50e-02 |  |
| ∗The dot plots of a searched regulon are shown for all cell subpopulations in each disease state of each tissue based on the regulon specific score inferred using pySCENIC and by calculating the average expression. |
| Page: 1 |
Top |
Somatic mutation of malignant transformation related genes |
| Annotation of somatic variants for genes involved in malignant transformation |
| Hugo Symbol | Variant Class | Variant Classification | dbSNP RS | HGVSc | HGVSp | HGVSp Short | SWISSPROT | BIOTYPE | SIFT | PolyPhen | Tumor Sample Barcode | Tissue | Histology | Sex | Age | Stage | Therapy Types | Drugs | Outcome |
| KLF11 | SNV | Missense_Mutation | rs868399686 | c.1486N>A | p.Ala496Thr | p.A496T | O14901 | protein_coding | tolerated(0.14) | benign(0.031) | TCGA-A8-A07W-01 | Breast | breast invasive carcinoma | Female | >=65 | III/IV | Hormone Therapy | exemestane | SD |
| KLF11 | SNV | Missense_Mutation | c.788N>G | p.Asn263Ser | p.N263S | O14901 | protein_coding | tolerated(0.41) | benign(0.01) | TCGA-AO-A03L-01 | Breast | breast invasive carcinoma | Female | <65 | III/IV | Chemotherapy | cyclophosphamide | SD | |
| KLF11 | SNV | Missense_Mutation | c.149N>G | p.Ala50Gly | p.A50G | O14901 | protein_coding | deleterious(0) | possibly_damaging(0.749) | TCGA-AO-A124-01 | Breast | breast invasive carcinoma | Female | <65 | I/II | Chemotherapy | doxorubicin | SD | |
| KLF11 | SNV | Missense_Mutation | rs756956843 | c.1385N>A | p.Arg462His | p.R462H | O14901 | protein_coding | deleterious(0) | probably_damaging(1) | TCGA-AQ-A54O-01 | Breast | breast invasive carcinoma | Male | <65 | I/II | Chemotherapy | adriamycin | CR |
| KLF11 | SNV | Missense_Mutation | c.913N>T | p.Pro305Ser | p.P305S | O14901 | protein_coding | tolerated(0.33) | benign(0.018) | TCGA-B6-A0RS-01 | Breast | breast invasive carcinoma | Female | <65 | I/II | Unknown | Unknown | PD | |
| KLF11 | SNV | Missense_Mutation | c.1495N>C | p.Glu499Gln | p.E499Q | O14901 | protein_coding | tolerated(0.13) | benign(0.07) | TCGA-E2-A10C-01 | Breast | breast invasive carcinoma | Female | <65 | I/II | Chemotherapy | cytoxan | SD | |
| KLF11 | SNV | Missense_Mutation | rs751202965 | c.845N>T | p.Ala282Val | p.A282V | O14901 | protein_coding | tolerated(0.08) | benign(0.055) | TCGA-EW-A1IZ-01 | Breast | breast invasive carcinoma | Female | <65 | III/IV | Chemotherapy | taxotere | SD |
| KLF11 | SNV | Missense_Mutation | rs541774526 | c.457G>A | p.Ala153Thr | p.A153T | O14901 | protein_coding | tolerated(0.4) | benign(0) | TCGA-AA-A02E-01 | Colorectum | colon adenocarcinoma | Female | >=65 | III/IV | Unknown | Unknown | PD |
| KLF11 | SNV | Missense_Mutation | novel | c.347N>G | p.Glu116Gly | p.E116G | O14901 | protein_coding | deleterious(0) | probably_damaging(0.994) | TCGA-CA-6717-01 | Colorectum | colon adenocarcinoma | Male | <65 | I/II | Chemotherapy | oxaliplatin | CR |
| KLF11 | SNV | Missense_Mutation | c.307N>C | p.Thr103Pro | p.T103P | O14901 | protein_coding | deleterious(0.01) | probably_damaging(0.974) | TCGA-AG-A00Y-01 | Colorectum | rectum adenocarcinoma | Male | >=65 | I/II | Unknown | Unknown | PD |
| Page: 1 2 3 4 5 |
Top |
Related drugs of malignant transformation related genes |
| Identification of chemicals and drugs interact with genes involved in malignant transfromation |
| (DGIdb 4.0) |
| Entrez ID | Symbol | Category | Interaction Types | Drug Claim Name | Drug Name | PMIDs |
| Page: 1 |

Copyright 2023-Present -The University of Texas Health Science Center at Houston |