
|
|||||
|
 | |
| |
| |
| |
| |
| |
|
Gene: ITM2C |
Gene summary for ITM2C |
| Gene information | Species | Human | Gene symbol | ITM2C | Gene ID | 81618 |
| Gene name | integral membrane protein 2C | |
| Gene Alias | BRI3 | |
| Cytomap | 2q37.1 | |
| Gene Type | protein-coding | GO ID | GO:0006807 | UniProtAcc | Q9NQX7 |
Top |
Malignant transformation analysis |
| Identification of the aberrant gene expression in precancerous and cancerous lesions by comparing the gene expression of stem-like cells in diseased tissues with normal stem cells |
| Entrez ID | Symbol | Replicates | Species | Organ | Tissue | Adj P-value | Log2FC | Malignancy |
| 81618 | ITM2C | A002-C-114 | Human | Colorectum | FAP | 8.81e-04 | -3.38e-01 | -0.1561 |
| 81618 | ITM2C | A015-C-104 | Human | Colorectum | FAP | 2.49e-08 | -2.81e-01 | -0.1899 |
| 81618 | ITM2C | A001-C-014 | Human | Colorectum | FAP | 2.13e-12 | -3.19e-01 | 0.0135 |
| 81618 | ITM2C | A002-C-016 | Human | Colorectum | FAP | 1.37e-06 | -2.65e-01 | 0.0521 |
| 81618 | ITM2C | A001-C-203 | Human | Colorectum | FAP | 4.25e-09 | -3.25e-01 | -0.0481 |
| 81618 | ITM2C | A002-C-116 | Human | Colorectum | FAP | 1.70e-11 | -3.09e-01 | -0.0452 |
| 81618 | ITM2C | A014-C-008 | Human | Colorectum | FAP | 1.60e-02 | -3.39e-01 | -0.191 |
| 81618 | ITM2C | A018-E-020 | Human | Colorectum | FAP | 4.76e-04 | -3.22e-01 | -0.2034 |
| 81618 | ITM2C | F034 | Human | Colorectum | FAP | 3.89e-11 | -3.17e-01 | -0.0665 |
| 81618 | ITM2C | F072B | Human | Colorectum | FAP | 2.57e-05 | -2.61e-01 | 0.257 |
| 81618 | ITM2C | CRC-1-8810 | Human | Colorectum | CRC | 4.63e-10 | -3.49e-01 | 0.6257 |
| 81618 | ITM2C | CRC-3-11773 | Human | Colorectum | CRC | 2.99e-13 | -3.82e-01 | 0.2564 |
| 81618 | ITM2C | AEH-subject1 | Human | Endometrium | AEH | 1.86e-03 | -2.86e-01 | -0.3059 |
| 81618 | ITM2C | AEH-subject2 | Human | Endometrium | AEH | 2.57e-13 | -3.75e-01 | -0.2525 |
| 81618 | ITM2C | AEH-subject3 | Human | Endometrium | AEH | 4.16e-10 | -3.22e-01 | -0.2576 |
| 81618 | ITM2C | AEH-subject4 | Human | Endometrium | AEH | 6.83e-09 | -3.48e-01 | -0.2657 |
| 81618 | ITM2C | AEH-subject5 | Human | Endometrium | AEH | 8.24e-35 | -5.16e-01 | -0.2953 |
| 81618 | ITM2C | EEC-subject1 | Human | Endometrium | EEC | 5.24e-28 | -5.08e-01 | -0.2682 |
| 81618 | ITM2C | EEC-subject2 | Human | Endometrium | EEC | 1.87e-03 | -1.80e-01 | -0.2607 |
| 81618 | ITM2C | EEC-subject3 | Human | Endometrium | EEC | 1.48e-39 | -4.96e-01 | -0.2525 |
| Page: 1 2 3 4 5 6 7 8 9 10 |
| Tissue | Expression Dynamics | Abbreviation |
| Colorectum (GSE201348) |  | FAP: Familial adenomatous polyposis |
| CRC: Colorectal cancer | ||
| Colorectum (HTA11) | 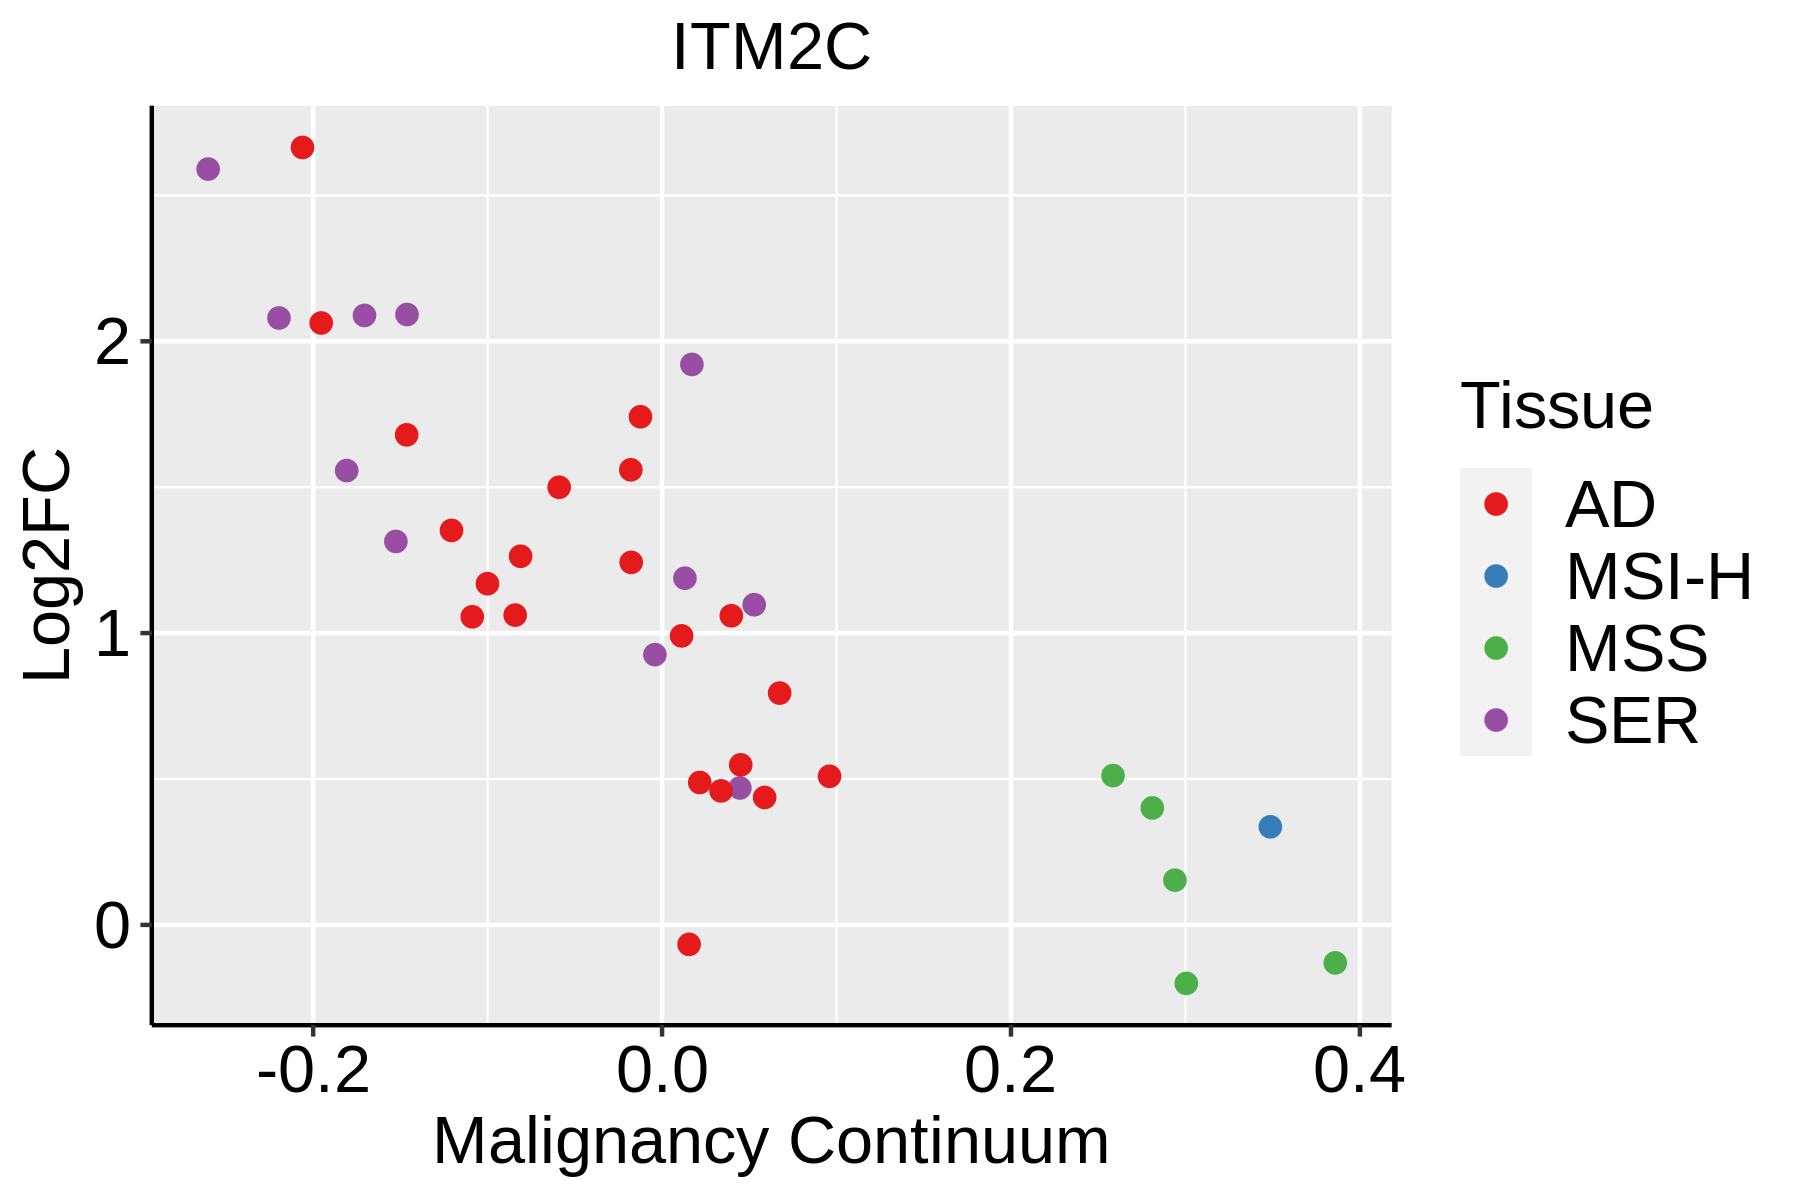 | AD: Adenomas |
| SER: Sessile serrated lesions | ||
| MSI-H: Microsatellite-high colorectal cancer | ||
| MSS: Microsatellite stable colorectal cancer | ||
| Endometrium | 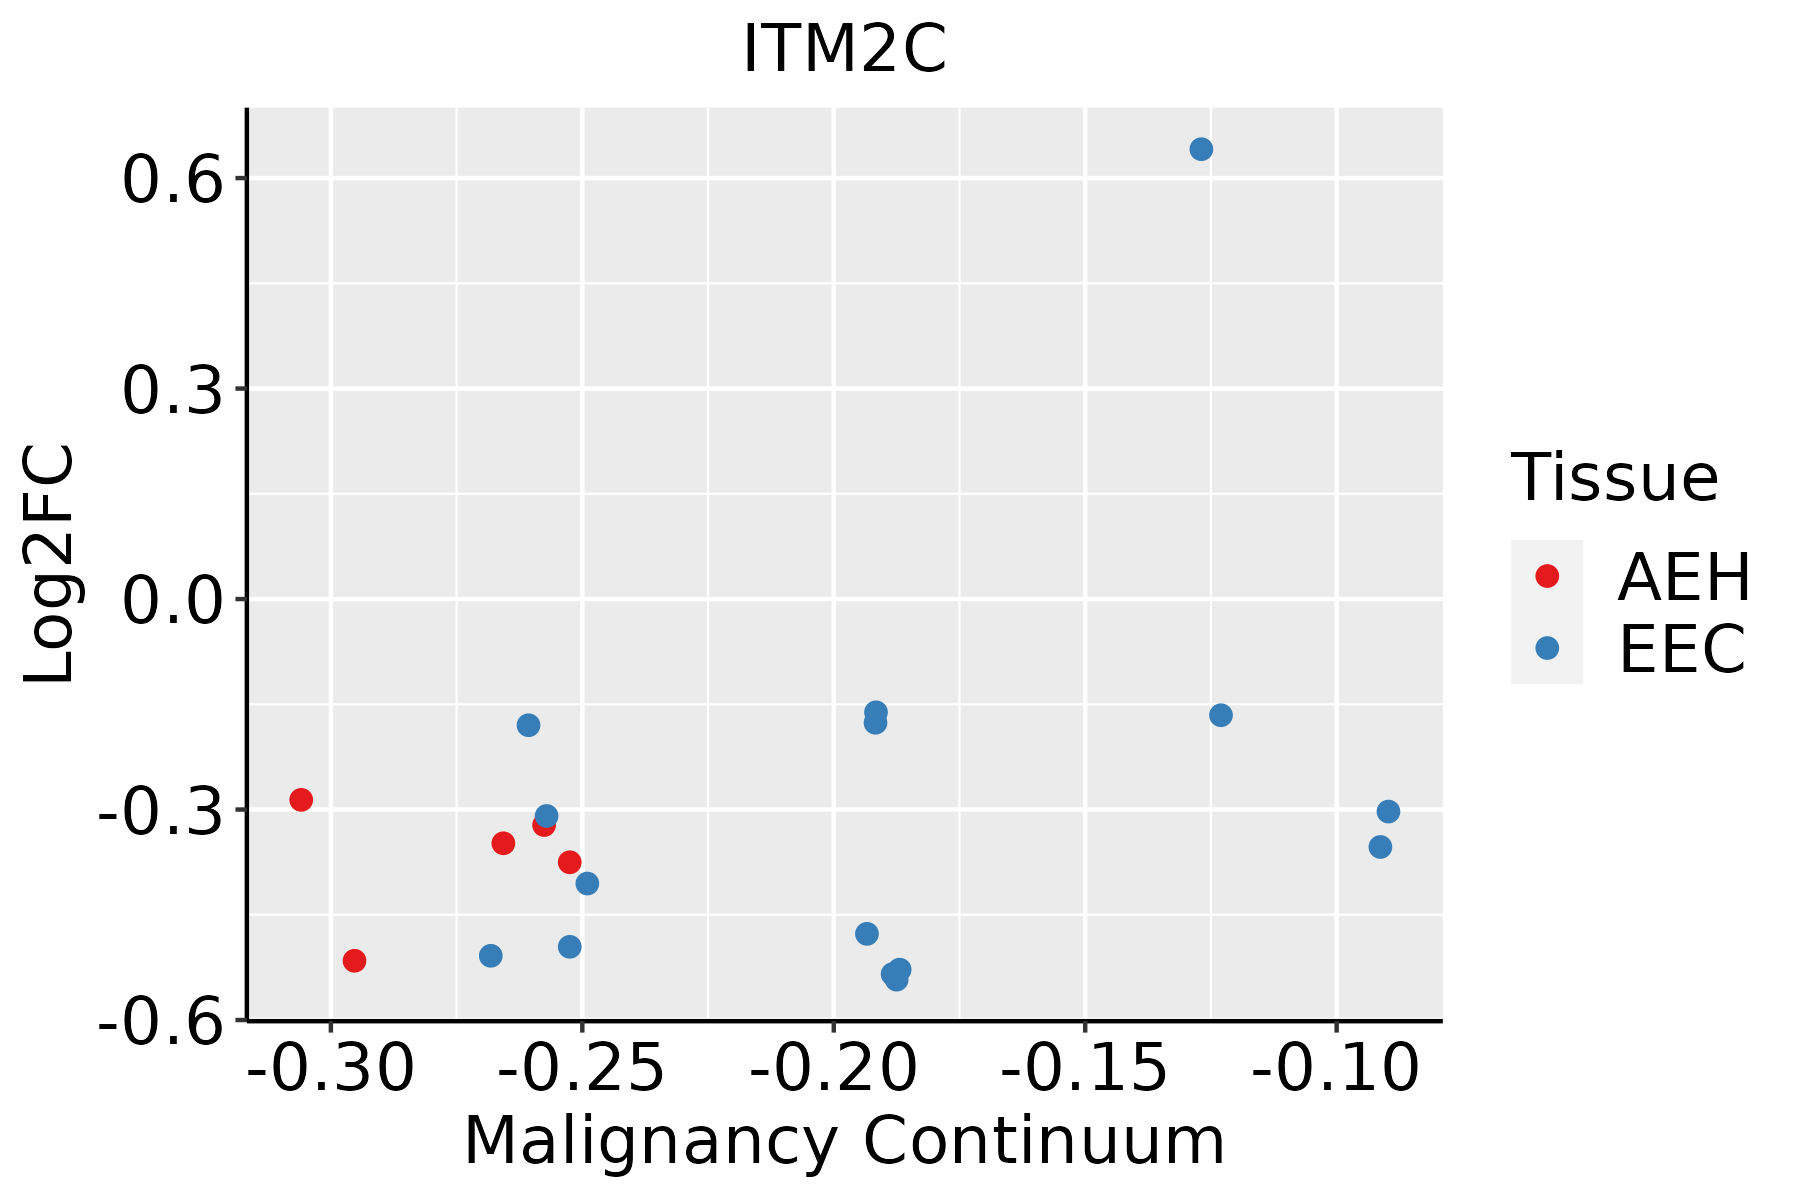 | AEH: Atypical endometrial hyperplasia |
| EEC: Endometrioid Cancer | ||
| Esophagus |  | ESCC: Esophageal squamous cell carcinoma |
| HGIN: High-grade intraepithelial neoplasias | ||
| LGIN: Low-grade intraepithelial neoplasias | ||
| Liver |  | HCC: Hepatocellular carcinoma |
| NAFLD: Non-alcoholic fatty liver disease | ||
| Oral Cavity | 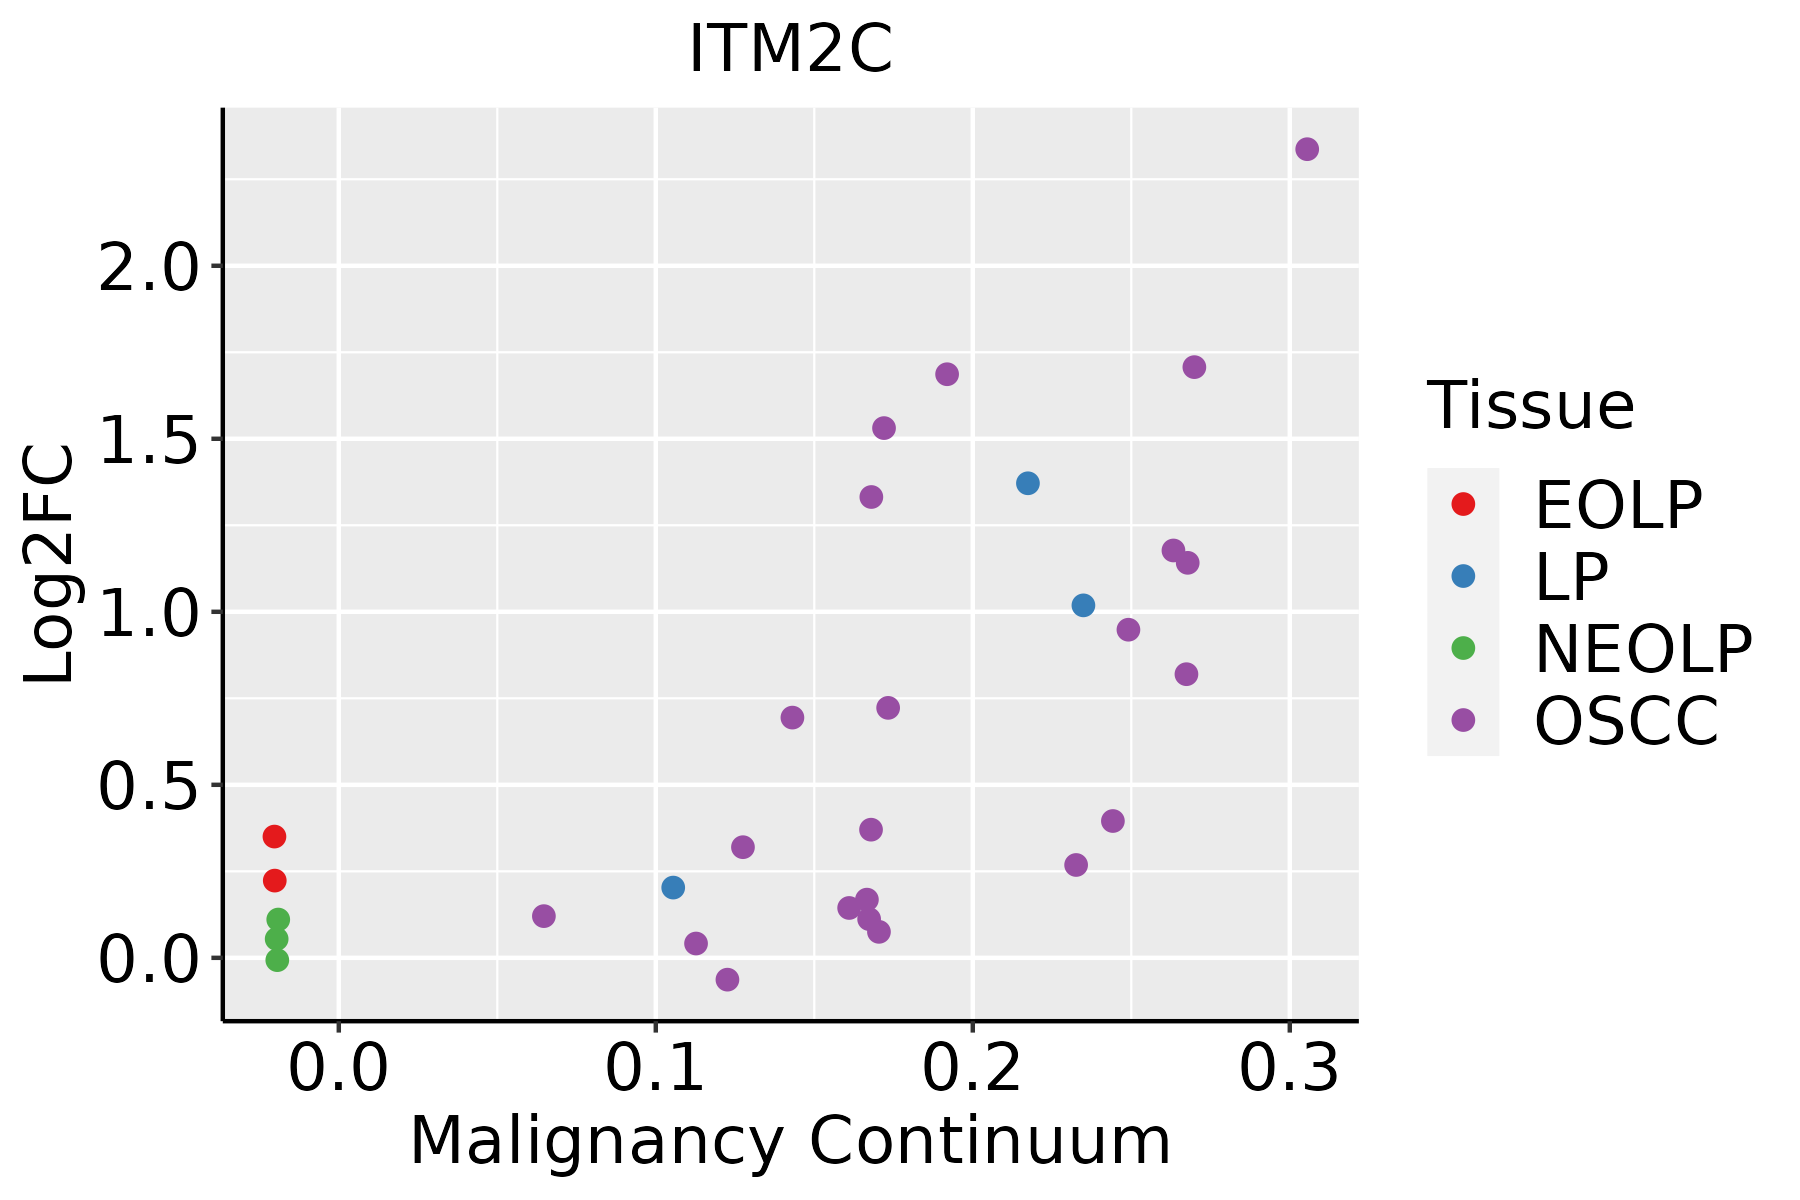 | EOLP: Erosive Oral lichen planus |
| LP: leukoplakia | ||
| NEOLP: Non-erosive oral lichen planus | ||
| OSCC: Oral squamous cell carcinoma | ||
| Prostate | 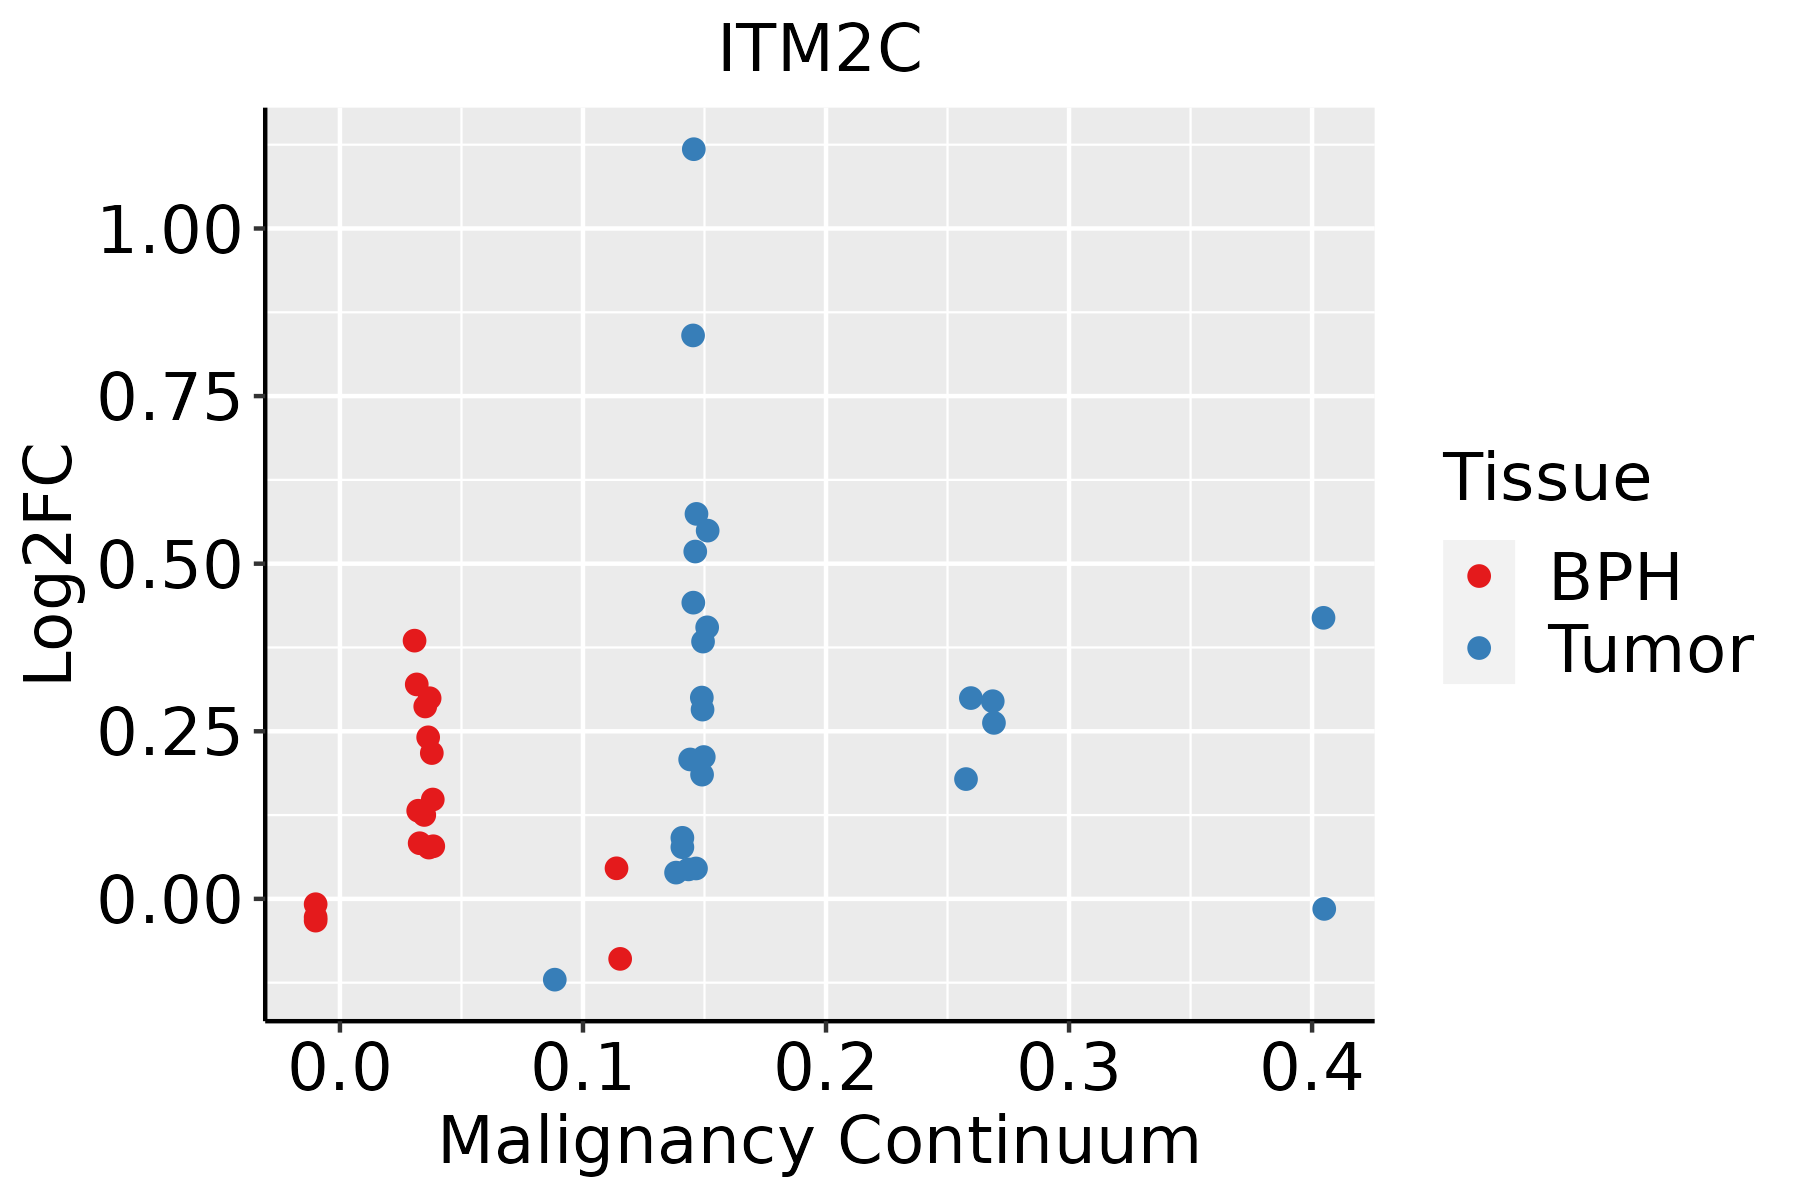 | BPH: Benign Prostatic Hyperplasia |
| Thyroid | 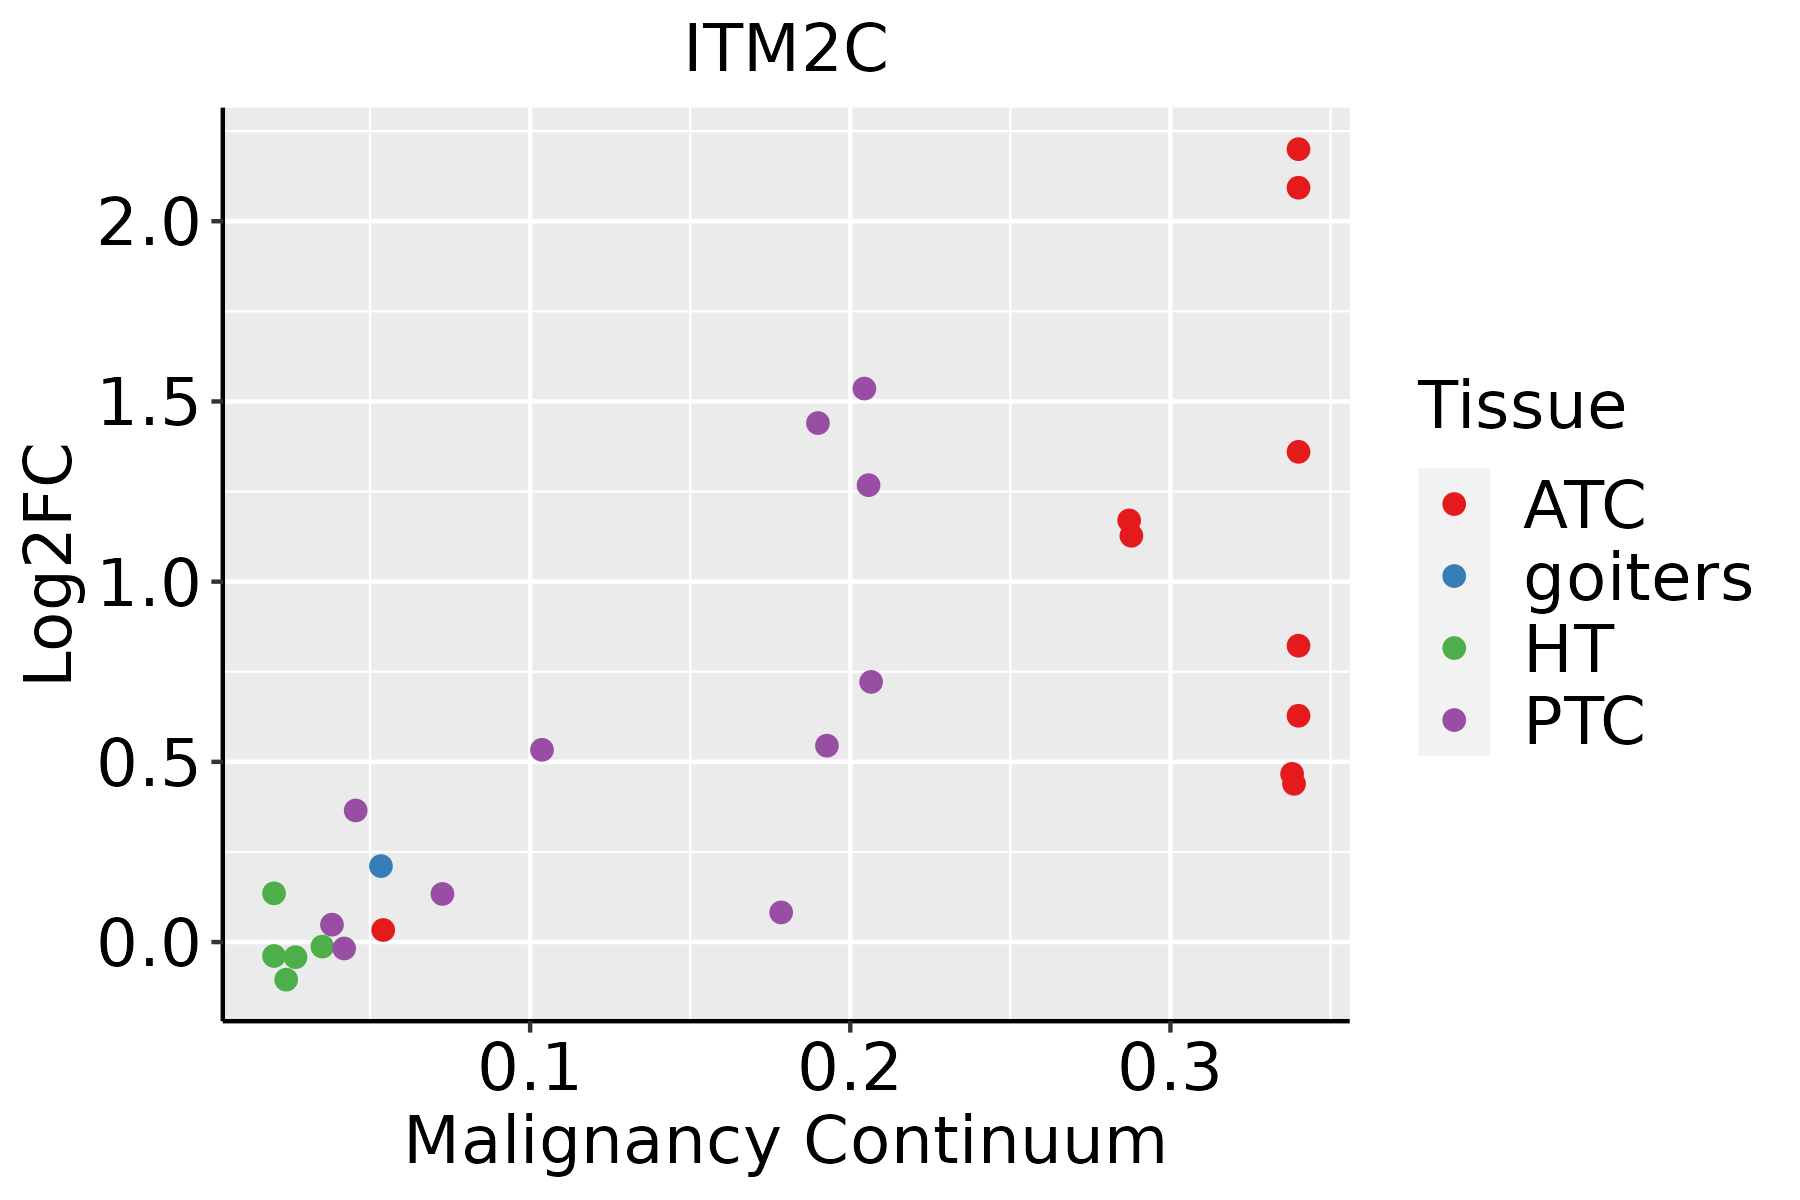 | ATC: Anaplastic thyroid cancer |
| HT: Hashimoto's thyroiditis | ||
| PTC: Papillary thyroid cancer |
| ∗log2FC in expression of this searched gene in stem-like cells from each diseased tissue sample relative to stem-like cells in normal samples in each tissue plotted against the malignancy continuum. Samples are colored based on if they are from different disease stage. |
Top |
Malignant transformation related pathway analysis |
| Find out the enriched GO biological processes and KEGG pathways involved in transition from healthy to precancer to cancer |
| Tissue | Disease Stage | Enriched GO biological Processes |
| Colorectum | AD |  |
| Colorectum | SER |  |
| Colorectum | MSS |  |
| Colorectum | MSI-H |  |
| Colorectum | FAP |  |
| ∗Top 15 enriched GO BP terms are showed in the bar plot of each disease state in each tissue. Each row represents a significant GO biological process which is colored according to the -log10(p.adjust). |
| Page: 1 2 3 4 5 6 7 8 9 |
| GO ID | Tissue | Disease Stage | Description | Gene Ratio | Bg Ratio | pvalue | p.adjust | Count |
| GO:2001233 | Colorectum | AD | regulation of apoptotic signaling pathway | 119/3918 | 356/18723 | 2.14e-08 | 1.21e-06 | 119 |
| GO:0010975 | Colorectum | AD | regulation of neuron projection development | 129/3918 | 445/18723 | 2.88e-05 | 5.37e-04 | 129 |
| GO:0097191 | Colorectum | AD | extrinsic apoptotic signaling pathway | 68/3918 | 219/18723 | 2.64e-04 | 3.27e-03 | 68 |
| GO:0031345 | Colorectum | AD | negative regulation of cell projection organization | 58/3918 | 186/18723 | 6.37e-04 | 6.58e-03 | 58 |
| GO:2001235 | Colorectum | AD | positive regulation of apoptotic signaling pathway | 42/3918 | 126/18723 | 7.85e-04 | 7.84e-03 | 42 |
| GO:0010977 | Colorectum | AD | negative regulation of neuron projection development | 43/3918 | 137/18723 | 2.60e-03 | 1.97e-02 | 43 |
| GO:20012331 | Colorectum | SER | regulation of apoptotic signaling pathway | 101/2897 | 356/18723 | 3.05e-10 | 4.07e-08 | 101 |
| GO:00971911 | Colorectum | SER | extrinsic apoptotic signaling pathway | 58/2897 | 219/18723 | 1.76e-05 | 5.22e-04 | 58 |
| GO:20012351 | Colorectum | SER | positive regulation of apoptotic signaling pathway | 36/2897 | 126/18723 | 1.29e-04 | 2.63e-03 | 36 |
| GO:2001236 | Colorectum | SER | regulation of extrinsic apoptotic signaling pathway | 39/2897 | 151/18723 | 6.67e-04 | 8.94e-03 | 39 |
| GO:00109751 | Colorectum | SER | regulation of neuron projection development | 92/2897 | 445/18723 | 1.85e-03 | 1.89e-02 | 92 |
| GO:00313451 | Colorectum | SER | negative regulation of cell projection organization | 42/2897 | 186/18723 | 6.51e-03 | 4.66e-02 | 42 |
| GO:20012332 | Colorectum | MSS | regulation of apoptotic signaling pathway | 116/3467 | 356/18723 | 1.02e-10 | 1.06e-08 | 116 |
| GO:20012352 | Colorectum | MSS | positive regulation of apoptotic signaling pathway | 42/3467 | 126/18723 | 4.95e-05 | 8.97e-04 | 42 |
| GO:00109752 | Colorectum | MSS | regulation of neuron projection development | 115/3467 | 445/18723 | 6.91e-05 | 1.20e-03 | 115 |
| GO:00971912 | Colorectum | MSS | extrinsic apoptotic signaling pathway | 63/3467 | 219/18723 | 1.34e-04 | 2.03e-03 | 63 |
| GO:00313452 | Colorectum | MSS | negative regulation of cell projection organization | 54/3467 | 186/18723 | 3.03e-04 | 3.96e-03 | 54 |
| GO:00109771 | Colorectum | MSS | negative regulation of neuron projection development | 39/3467 | 137/18723 | 2.86e-03 | 2.22e-02 | 39 |
| GO:20012361 | Colorectum | MSS | regulation of extrinsic apoptotic signaling pathway | 42/3467 | 151/18723 | 3.23e-03 | 2.45e-02 | 42 |
| GO:00109753 | Colorectum | FAP | regulation of neuron projection development | 102/2622 | 445/18723 | 2.04e-07 | 1.24e-05 | 102 |
| Page: 1 2 3 4 5 6 7 |
| Pathway ID | Tissue | Disease Stage | Description | Gene Ratio | Bg Ratio | pvalue | p.adjust | qvalue | Count |
| Page: 1 |
Top |
Cell-cell communication analysis |
| Identification of potential cell-cell interactions between two cell types and their ligand-receptor pairs for different disease states |
| Ligand | Receptor | LRpair | Pathway | Tissue | Disease Stage |
| Page: 1 |
Top |
Single-cell gene regulatory network inference analysis |
| Find out the significant the regulons (TFs) and the target genes of each regulon across cell types for different disease states |
| TF | Cell Type | Tissue | Disease Stage | Target Gene | RSS | Regulon Activity |
| ∗The dot plots of a searched regulon are shown for all cell subpopulations in each disease state of each tissue based on the regulon specific score inferred using pySCENIC and by calculating the average expression. |
| Page: 1 |
Top |
Somatic mutation of malignant transformation related genes |
| Annotation of somatic variants for genes involved in malignant transformation |
| Hugo Symbol | Variant Class | Variant Classification | dbSNP RS | HGVSc | HGVSp | HGVSp Short | SWISSPROT | BIOTYPE | SIFT | PolyPhen | Tumor Sample Barcode | Tissue | Histology | Sex | Age | Stage | Therapy Types | Drugs | Outcome |
| ITM2C | SNV | Missense_Mutation | rs764555891 | c.283N>T | p.Arg95Cys | p.R95C | Q9NQX7 | protein_coding | tolerated(0.09) | benign(0.288) | TCGA-AN-A046-01 | Breast | breast invasive carcinoma | Female | >=65 | I/II | Unknown | Unknown | SD |
| ITM2C | SNV | Missense_Mutation | rs748390195 | c.499N>A | p.Glu167Lys | p.E167K | Q9NQX7 | protein_coding | tolerated(0.07) | probably_damaging(0.996) | TCGA-FU-A3HZ-01 | Cervix | cervical & endocervical cancer | Female | <65 | I/II | Chemotherapy | cisplatin | CR |
| ITM2C | SNV | Missense_Mutation | rs760386716 | c.383G>A | p.Arg128His | p.R128H | Q9NQX7 | protein_coding | tolerated(0.54) | benign(0.003) | TCGA-AD-A5EJ-01 | Colorectum | colon adenocarcinoma | Female | >=65 | I/II | Unknown | Unknown | SD |
| ITM2C | SNV | Missense_Mutation | rs200266468 | c.751N>T | p.Arg251Cys | p.R251C | Q9NQX7 | protein_coding | deleterious(0) | probably_damaging(0.996) | TCGA-CM-4743-01 | Colorectum | colon adenocarcinoma | Male | >=65 | I/II | Chemotherapy | capecitabine | SD |
| ITM2C | SNV | Missense_Mutation | c.637G>A | p.Ala213Thr | p.A213T | Q9NQX7 | protein_coding | tolerated(0.18) | benign(0.011) | TCGA-G4-6304-01 | Colorectum | colon adenocarcinoma | Female | >=65 | I/II | Chemotherapy | fluorouracil | PD | |
| ITM2C | SNV | Missense_Mutation | rs143044408 | c.695N>A | p.Arg232His | p.R232H | Q9NQX7 | protein_coding | deleterious(0.01) | probably_damaging(0.959) | TCGA-EI-6514-01 | Colorectum | rectum adenocarcinoma | Female | <65 | I/II | Chemotherapy | 5-fu | SD |
| ITM2C | SNV | Missense_Mutation | rs769890271 | c.217N>A | p.Val73Met | p.V73M | Q9NQX7 | protein_coding | deleterious(0) | possibly_damaging(0.499) | TCGA-F5-6814-01 | Colorectum | rectum adenocarcinoma | Male | <65 | I/II | Unknown | Unknown | SD |
| ITM2C | deletion | Frame_Shift_Del | c.158delG | p.Gly53AlafsTer66 | p.G53Afs*66 | Q9NQX7 | protein_coding | TCGA-AD-A5EJ-01 | Colorectum | colon adenocarcinoma | Female | >=65 | I/II | Unknown | Unknown | SD | |||
| ITM2C | SNV | Missense_Mutation | rs748390195 | c.499N>A | p.Glu167Lys | p.E167K | Q9NQX7 | protein_coding | tolerated(0.07) | probably_damaging(0.996) | TCGA-A5-A2K5-01 | Endometrium | uterine corpus endometrioid carcinoma | Female | >=65 | I/II | Unknown | Unknown | SD |
| ITM2C | SNV | Missense_Mutation | rs769890271 | c.217N>A | p.Val73Met | p.V73M | Q9NQX7 | protein_coding | deleterious(0) | possibly_damaging(0.499) | TCGA-AP-A051-01 | Endometrium | uterine corpus endometrioid carcinoma | Female | >=65 | I/II | Unknown | Unknown | SD |
| Page: 1 2 3 |
Top |
Related drugs of malignant transformation related genes |
| Identification of chemicals and drugs interact with genes involved in malignant transfromation |
| (DGIdb 4.0) |
| Entrez ID | Symbol | Category | Interaction Types | Drug Claim Name | Drug Name | PMIDs |
| Page: 1 |

Copyright 2023-Present -The University of Texas Health Science Center at Houston |