Schematic overview of the cellular and molecular mechanisms involved in the cancer progression, including the proposed cellular and molecular mechanisms in cancer cells trajectory. AT1: alveolar type 1 cells; AT2: alveolar type 2 cells; AAH: atypical adenomatous hyperplasia; AIS: adenocarcinoma in situ; MIA: minimally invasive adenocarcinoma; IA: invasive adenocarcinoma; EMT: epithelial-mesenchymal transition

Home

Download

Statistics

Help

Contact

Center for Computational Systems Medicine
leaf

Gene summary

leaf

Malignant transformation analysis

leaf

Malignant transformation related pathway analysis

leaf

Cell-cell communication analysis

leaf

Single-cell gene regulatory network inference analysis

leaf

Somatic mutation of malignant transformation related genes

leaf

Related drugs of malignant transformation related genes

Gene: INSIG1

Gene summary for INSIG1

check button Gene summary.

Gene informationSpeciesHuman
Gene symbol

INSIG1

Gene ID

3638

Gene nameinsulin induced gene 1
Gene AliasCL6
Cytomap7q36.3
Gene Typeprotein-coding
GO ID

GO:0001501

UniProtAcc

A4D2M9


Top

Malignant transformation analysis

check button Identification of the aberrant gene expression in precancerous and cancerous lesions by comparing the gene expression of stem-like cells in diseased tissues with normal stem cells
check button Malignant transformation involving gene list.
Entrez IDSymbolReplicatesSpeciesOrganTissueAdj P-valueLog2FCMalignancy
3638INSIG1P62T-EHumanEsophagusESCC9.56e-054.20e-010.1302
3638INSIG1P65T-EHumanEsophagusESCC3.01e-085.81e-010.0978
3638INSIG1P74T-EHumanEsophagusESCC4.35e-211.88e+000.1479
3638INSIG1P75T-EHumanEsophagusESCC1.22e-117.38e-010.1125
3638INSIG1P79T-EHumanEsophagusESCC5.72e-258.60e-010.1154
3638INSIG1P80T-EHumanEsophagusESCC1.57e-181.59e+000.155
3638INSIG1P83T-EHumanEsophagusESCC6.19e-251.74e+000.1738
3638INSIG1P91T-EHumanEsophagusESCC1.12e-112.39e+000.1828
3638INSIG1P107T-EHumanEsophagusESCC4.23e-241.55e+000.171
3638INSIG1P127T-EHumanEsophagusESCC6.55e-044.20e-010.0826
3638INSIG1P128T-EHumanEsophagusESCC1.48e-393.73e+000.1241
3638INSIG1P130T-EHumanEsophagusESCC1.04e-502.26e+000.1676
3638INSIG1NAFLD1HumanLiverNAFLD2.46e-025.51e-01-0.04
3638INSIG1S41HumanLiverCirrhotic4.37e-141.00e+00-0.0343
3638INSIG1S42HumanLiverHCC6.95e-056.42e-01-0.0103
3638INSIG1S43HumanLiverCirrhotic2.06e-09-2.71e-02-0.0187
3638INSIG1S44HumanLiverHCC2.58e-161.36e+00-0.0083
3638INSIG1HCC1_MengHumanLiverHCC1.00e-591.83e-020.0246
3638INSIG1HCC2_MengHumanLiverHCC6.38e-16-8.57e-020.0107
3638INSIG1cirrhotic1HumanLiverCirrhotic2.86e-05-2.50e-010.0202
Page: 1 2 3 4 5 6 7 

check button Transcriptomic changes along malignancy continuum.
TissueExpression DynamicsAbbreviation
EsophagusThe image shows the transcriptomic changes along malignancy continuum.log2FC in expression of this searched gene in stem-like cells from each diseased tissue sample relative to stem-like cells in normal samples in each tissue plotted against the malignancy continuum. Samples are colored based on if they are from different disease stage.ESCC: Esophageal squamous cell carcinoma
HGIN: High-grade intraepithelial neoplasias
LGIN: Low-grade intraepithelial neoplasias
GCThe image shows the transcriptomic changes along malignancy continuum.log2FC in expression of this searched gene in stem-like cells from each diseased tissue sample relative to stem-like cells in normal samples in each tissue plotted against the malignancy continuum. Samples are colored based on if they are from different disease stage.
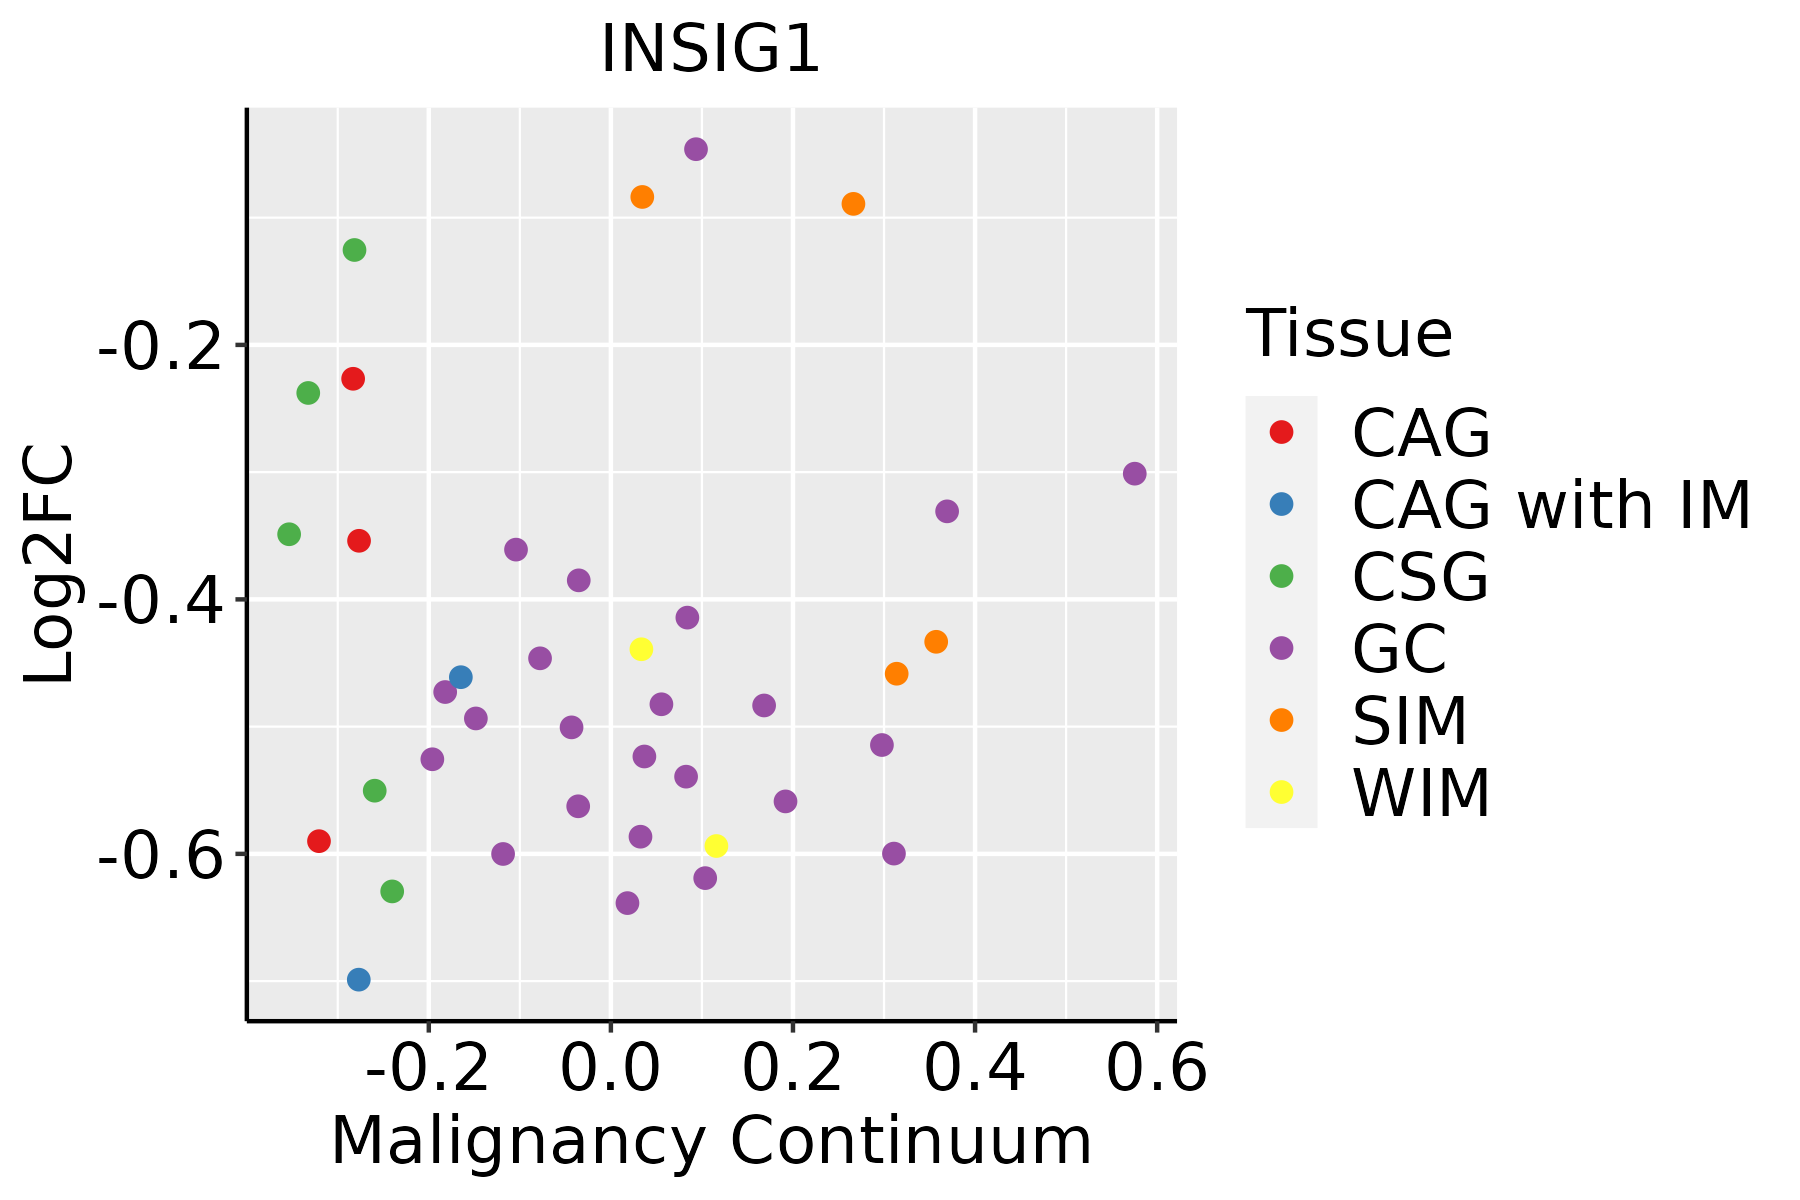
CAG: Chronic atrophic gastritis
CAG with IM: Chronic atrophic gastritis with intestinal metaplasia
CSG: Chronic superficial gastritis
GC: Gastric cancer
SIM: Severe intestinal metaplasia
WIM: Wild intestinal metaplasia
LiverThe image shows the transcriptomic changes along malignancy continuum.log2FC in expression of this searched gene in stem-like cells from each diseased tissue sample relative to stem-like cells in normal samples in each tissue plotted against the malignancy continuum. Samples are colored based on if they are from different disease stage.
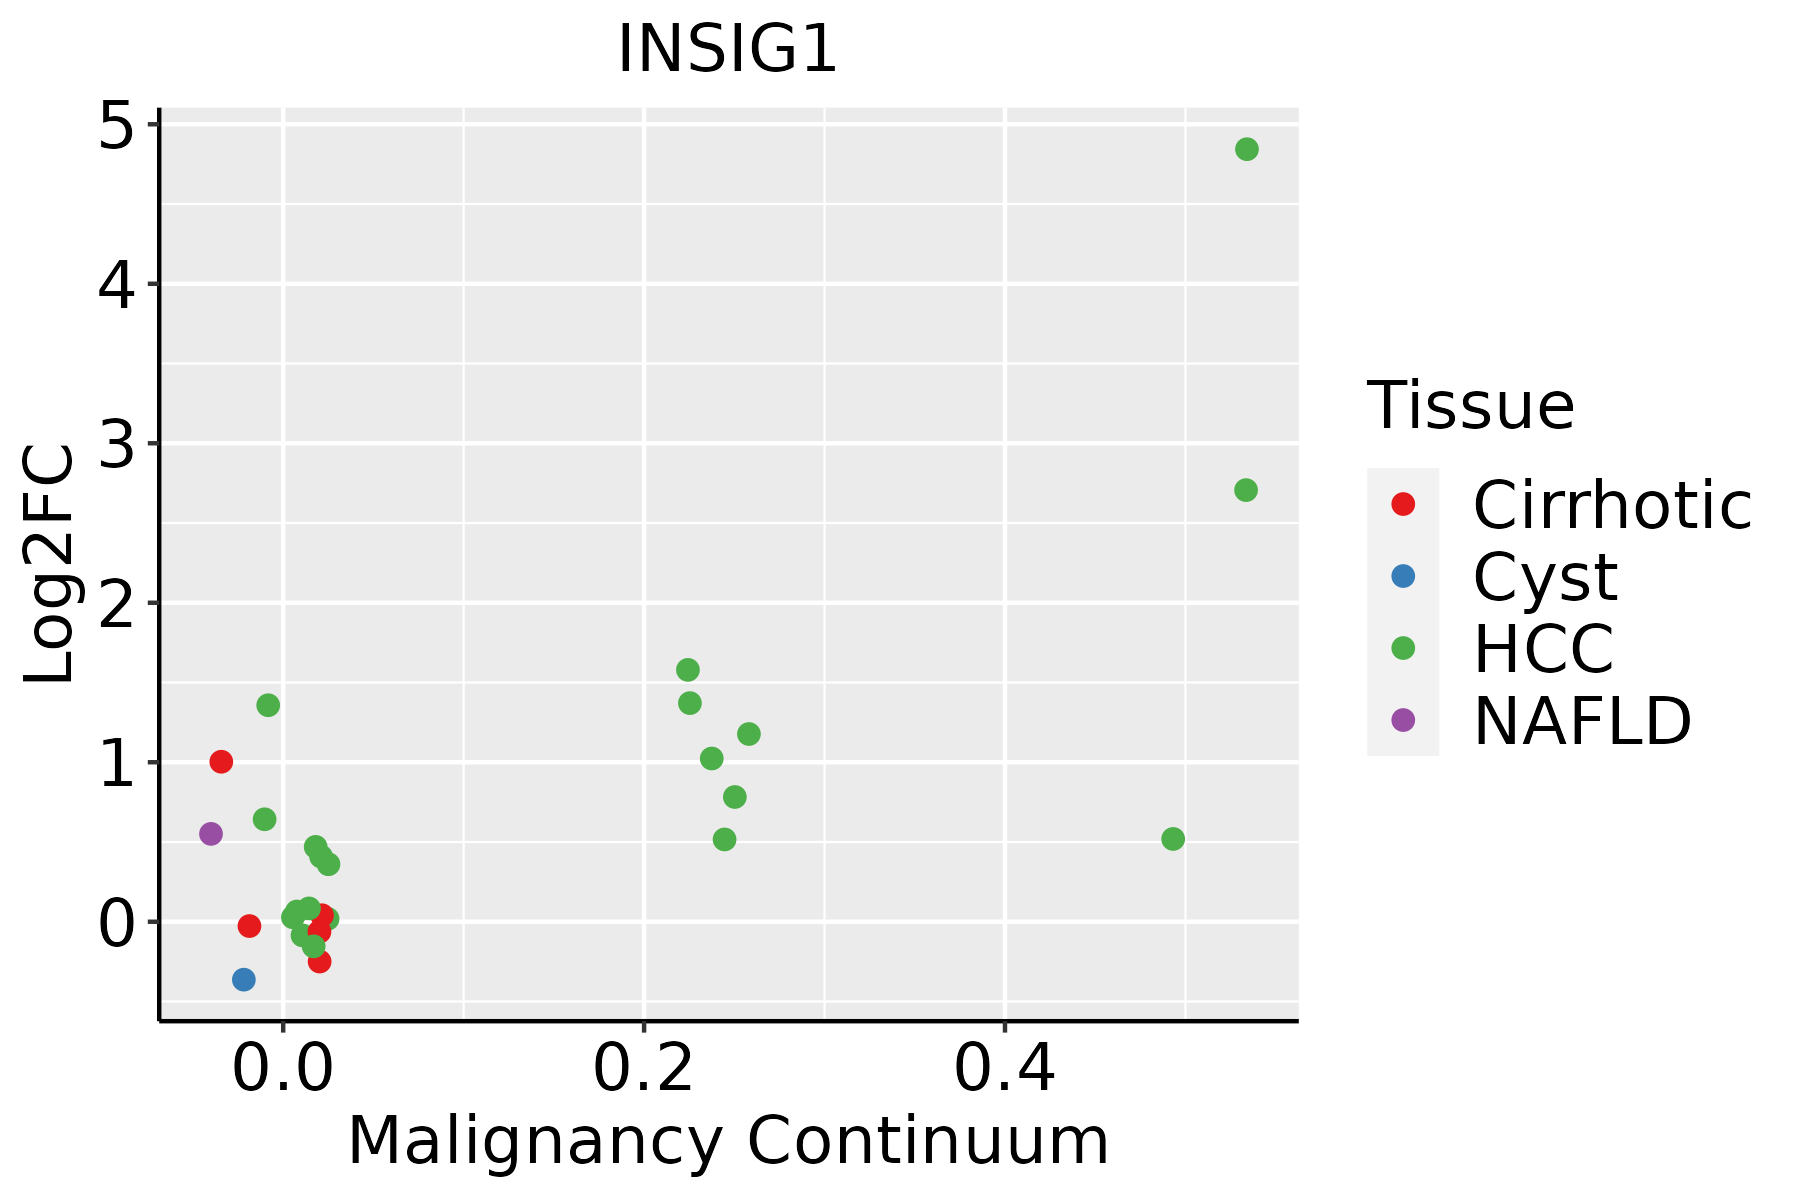
HCC: Hepatocellular carcinoma
NAFLD: Non-alcoholic fatty liver disease
Oral CavityThe image shows the transcriptomic changes along malignancy continuum.log2FC in expression of this searched gene in stem-like cells from each diseased tissue sample relative to stem-like cells in normal samples in each tissue plotted against the malignancy continuum. Samples are colored based on if they are from different disease stage.
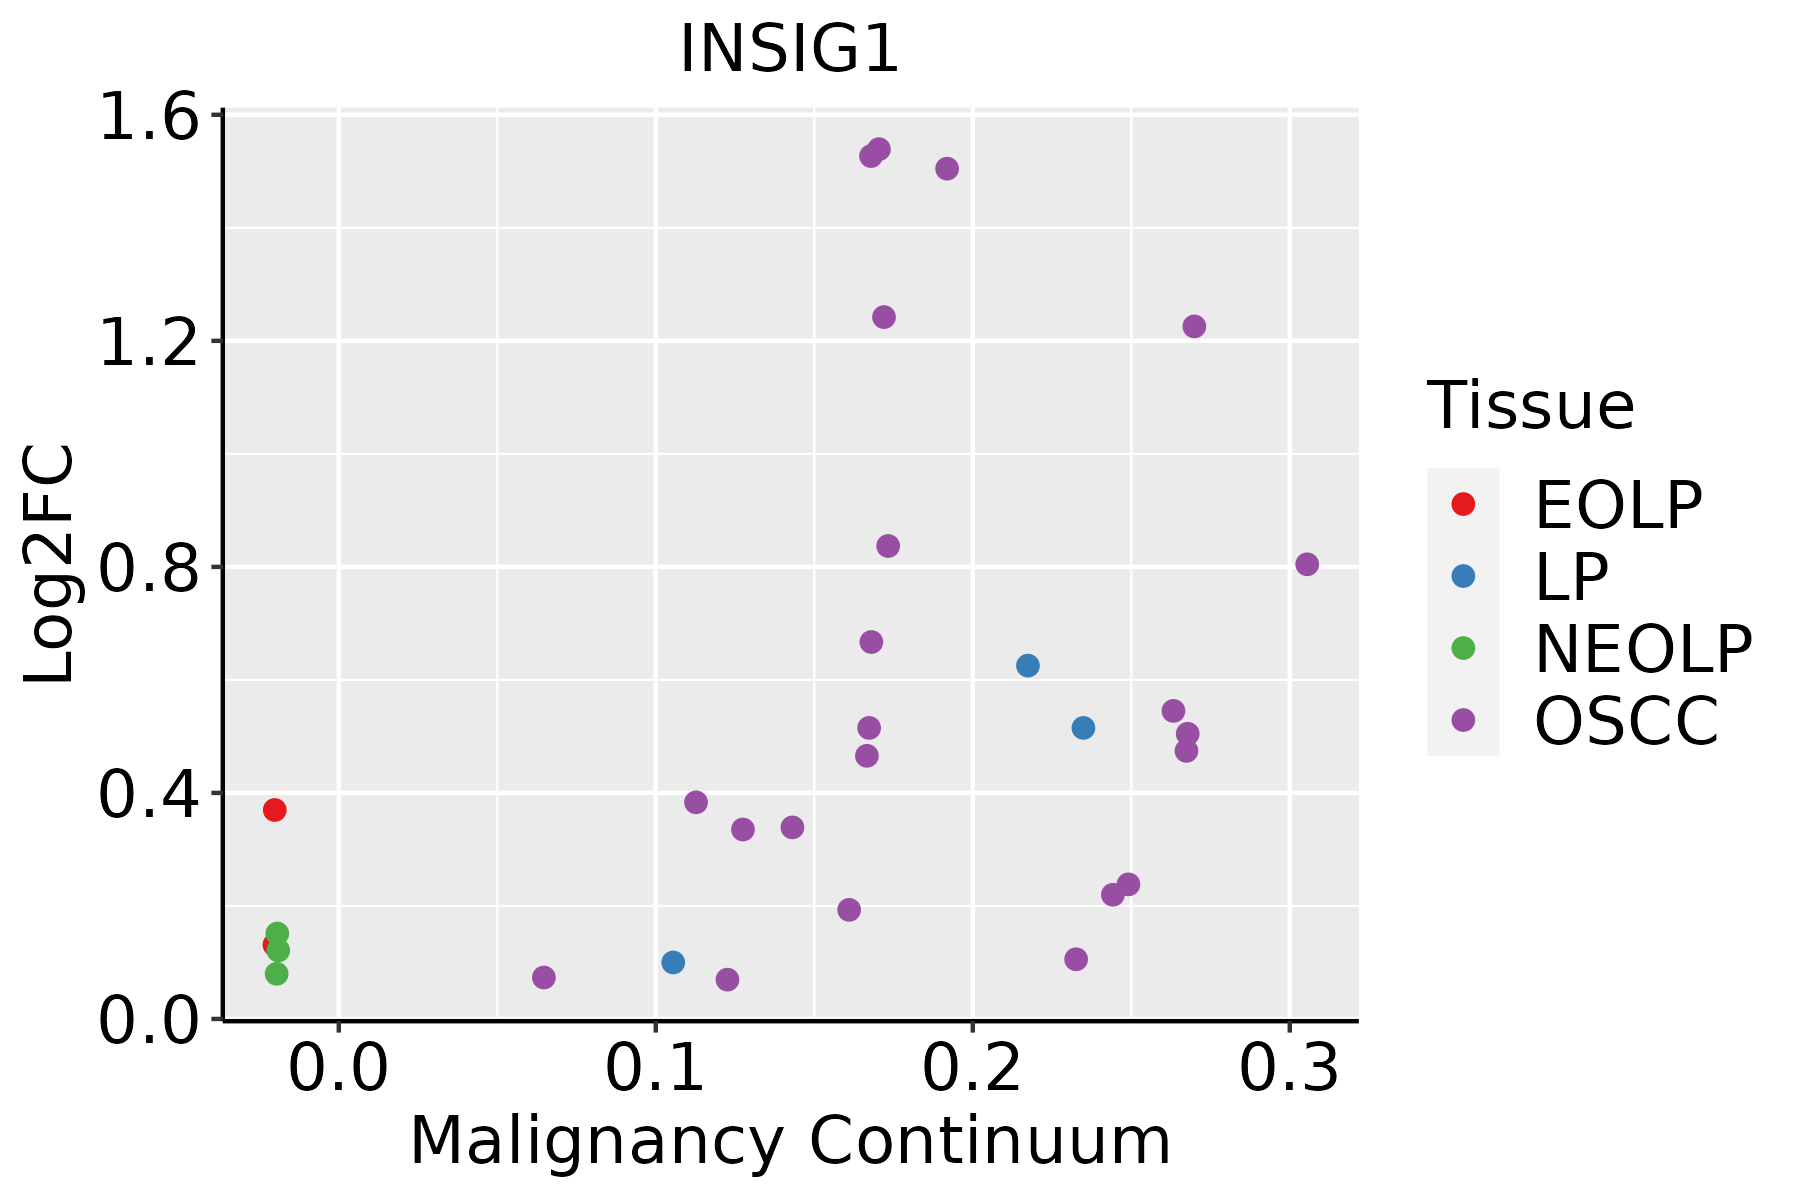
EOLP: Erosive Oral lichen planus
LP: leukoplakia
NEOLP: Non-erosive oral lichen planus
OSCC: Oral squamous cell carcinoma
SkinThe image shows the transcriptomic changes along malignancy continuum.log2FC in expression of this searched gene in stem-like cells from each diseased tissue sample relative to stem-like cells in normal samples in each tissue plotted against the malignancy continuum. Samples are colored based on if they are from different disease stage.
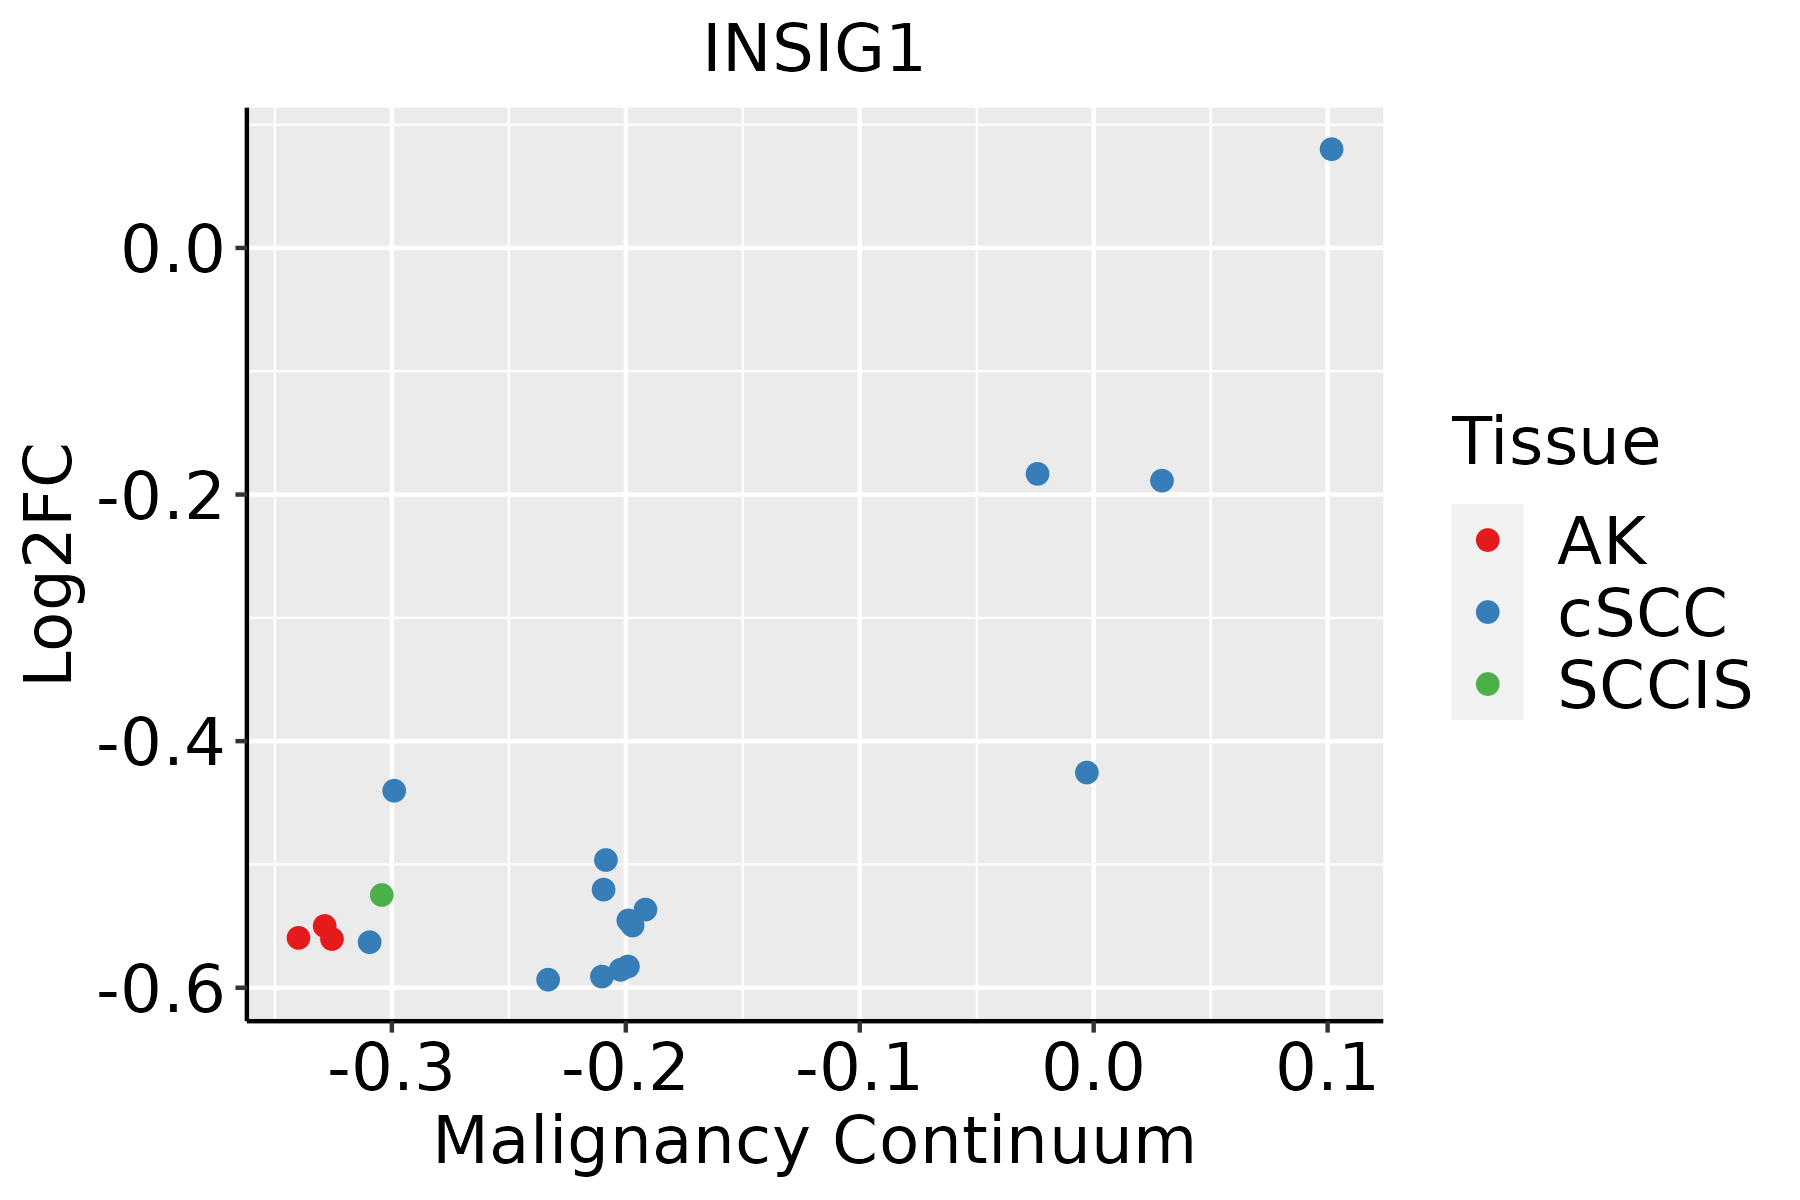
AK: Actinic keratosis
cSCC: Cutaneous squamous cell carcinoma
SCCIS:squamous cell carcinoma in situ
∗log2FC in expression of this searched gene in stem-like cells from each diseased tissue sample relative to stem-like cells in normal samples in each tissue plotted against the malignancy continuum. Samples are colored based on if they are from different disease stage.

Top

Malignant transformation related pathway analysis

check buttonFind out the enriched GO biological processes and KEGG pathways involved in transition from healthy to precancer to cancer
check button Figure of enriched GO biological processes.
TissueDisease StageEnriched GO biological Processes
ColorectumADGO analysis - Figure of enriched GO biological processes: Top 15 enriched GO BP terms are showed in the bar plot of each disease state in each tissue. Each row represents a significant GO biological process which is colored according to the -log10(p.adjust).
ColorectumSERGO analysis - Figure of enriched GO biological processes: Top 15 enriched GO BP terms are showed in the bar plot of each disease state in each tissue. Each row represents a significant GO biological process which is colored according to the -log10(p.adjust).
ColorectumMSSGO analysis - Figure of enriched GO biological processes: Top 15 enriched GO BP terms are showed in the bar plot of each disease state in each tissue. Each row represents a significant GO biological process which is colored according to the -log10(p.adjust).
ColorectumMSI-HGO analysis - Figure of enriched GO biological processes: Top 15 enriched GO BP terms are showed in the bar plot of each disease state in each tissue. Each row represents a significant GO biological process which is colored according to the -log10(p.adjust).
ColorectumFAPGO analysis - Figure of enriched GO biological processes: Top 15 enriched GO BP terms are showed in the bar plot of each disease state in each tissue. Each row represents a significant GO biological process which is colored according to the -log10(p.adjust).
∗Top 15 enriched GO BP terms are showed in the bar plot of each disease state in each tissue. Each row represents a significant GO biological process which is colored according to the -log10(p.adjust).
Page: 1 2 3 4 5 6 7 8 9 

check button Enriched GO biological processes.
GO IDTissueDisease StageDescriptionGene RatioBg Ratiopvaluep.adjustCount
GO:004819318EsophagusESCCGolgi vesicle transport231/8552296/187231.82e-309.63e-28231
GO:003238618EsophagusESCCregulation of intracellular transport243/8552337/187233.20e-237.25e-21243
GO:001605014EsophagusESCCvesicle organization211/8552300/187232.85e-182.87e-16211
GO:0033157110EsophagusESCCregulation of intracellular protein transport169/8552229/187233.31e-183.23e-16169
GO:000688815EsophagusESCCendoplasmic reticulum to Golgi vesicle-mediated transport102/8552130/187231.73e-149.22e-13102
GO:0006900111EsophagusESCCvesicle budding from membrane54/855261/187232.66e-121.07e-1054
GO:0045185111EsophagusESCCmaintenance of protein location71/855294/187233.41e-097.24e-0871
GO:0051235110EsophagusESCCmaintenance of location200/8552327/187231.01e-082.02e-07200
GO:0032507110EsophagusESCCmaintenance of protein location in cell52/855265/187231.41e-082.77e-0752
GO:009011414EsophagusESCCCOPII-coated vesicle budding27/855229/187238.09e-081.39e-0627
GO:007259517EsophagusESCCmaintenance of protein localization in organelle36/855242/187238.46e-081.44e-0636
GO:000698416EsophagusESCCER-nucleus signaling pathway38/855246/187232.70e-074.00e-0638
GO:190165319EsophagusESCCcellular response to peptide208/8552359/187231.68e-062.01e-05208
GO:0043434111EsophagusESCCresponse to peptide hormone234/8552414/187234.93e-065.21e-05234
GO:003286918EsophagusESCCcellular response to insulin stimulus124/8552203/187236.63e-066.75e-05124
GO:003286818EsophagusESCCresponse to insulin156/8552264/187237.21e-067.20e-05156
GO:00060668EsophagusESCCalcohol metabolic process202/8552353/187237.32e-067.26e-05202
GO:003252714EsophagusESCCprotein exit from endoplasmic reticulum37/855248/187238.99e-068.65e-0537
GO:007097218EsophagusESCCprotein localization to endoplasmic reticulum52/855274/187231.58e-051.42e-0452
GO:00161263EsophagusESCCsterol biosynthetic process46/855264/187231.91e-051.67e-0446
Page: 1 2 3 4 5 6 7 8 9 10 11 12 13 14 15 16 17 18 19 20 21 22 23 24 

check button Enriched KEGG pathways.
Pathway IDTissueDisease StageDescriptionGene RatioBg Ratiopvaluep.adjustqvalueCount
Page: 1 

Top

Cell-cell communication analysis

check buttonIdentification of potential cell-cell interactions between two cell types and their ligand-receptor pairs for different disease states
LigandReceptorLRpairPathwayTissueDisease Stage
Page: 1 

Top

Single-cell gene regulatory network inference analysis

check buttonFind out the significant the regulons (TFs) and the target genes of each regulon across cell types for different disease states
TFCell TypeTissueDisease StageTarget GeneRSSRegulon Activity
∗The dot plots of a searched regulon are shown for all cell subpopulations in each disease state of each tissue based on the regulon specific score inferred using pySCENIC and by calculating the average expression.
Page: 1 

Top

Somatic mutation of malignant transformation related genes

check buttonAnnotation of somatic variants for genes involved in malignant transformation
Hugo SymbolVariant ClassVariant ClassificationdbSNP RSHGVScHGVSpHGVSp ShortSWISSPROTBIOTYPESIFTPolyPhenTumor Sample BarcodeTissueHistologySexAgeStageTherapy TypesDrugsOutcome
INSIG1SNVMissense_Mutationnovelc.698N>Ap.Val233Aspp.V233DO15503protein_codingdeleterious(0)probably_damaging(0.969)TCGA-BH-A18G-01Breastbreast invasive carcinomaFemale>=65I/IIUnknownUnknownSD
INSIG1deletionIn_Frame_Delc.776_778delTGGp.Val259delp.V259delO15503protein_codingTCGA-A8-A07W-01Breastbreast invasive carcinomaFemale>=65III/IVHormone TherapyexemestaneSD
INSIG1SNVMissense_Mutationc.108G>Cp.Glu36Aspp.E36DO15503protein_codingtolerated_low_confidence(0.18)benign(0)TCGA-Q1-A73O-01Cervixcervical & endocervical cancerFemale<65I/IIChemotherapycisplatinCR
INSIG1SNVMissense_Mutationnovelc.349N>Ap.Glu117Lysp.E117KO15503protein_codingtolerated(0.1)probably_damaging(0.996)TCGA-VS-A9V0-01Cervixcervical & endocervical cancerFemale<65I/IIChemotherapycisplatinPD
INSIG1SNVMissense_Mutationrs780785188c.769N>Ap.Val257Ilep.V257IO15503protein_codingtolerated(0.38)probably_damaging(0.995)TCGA-AZ-4313-01Colorectumcolon adenocarcinomaFemale<65I/IIUnknownUnknownSD
INSIG1deletionIn_Frame_Delnovelc.276_278delNNNp.Phe92_Ser93delinsLeup.F92_S93delinsLO15503protein_codingTCGA-AA-3845-01Colorectumcolon adenocarcinomaFemale>=65I/IIUnknownUnknownPD
INSIG1SNVMissense_Mutationnovelc.737N>Ap.Ser246Tyrp.S246YO15503protein_codingdeleterious(0)probably_damaging(0.999)TCGA-AJ-A5DW-01Endometriumuterine corpus endometrioid carcinomaFemale<65I/IIUnknownUnknownSD
INSIG1SNVMissense_Mutationnovelc.757T>Gp.Phe253Valp.F253VO15503protein_codingdeleterious(0)probably_damaging(0.998)TCGA-AX-A2HC-01Endometriumuterine corpus endometrioid carcinomaFemale<65III/IVChemotherapypaclitaxelPD
INSIG1SNVMissense_Mutationnovelc.409N>Ap.Ala137Thrp.A137TO15503protein_codingdeleterious(0.01)probably_damaging(0.999)TCGA-EO-A22R-01Endometriumuterine corpus endometrioid carcinomaFemale<65I/IIUnknownUnknownSD
INSIG1SNVMissense_Mutationnovelc.293N>Gp.Leu98Argp.L98RO15503protein_codingdeleterious(0)probably_damaging(0.955)TCGA-EY-A1GI-01Endometriumuterine corpus endometrioid carcinomaFemale<65I/IIUnknownUnknownSD
Page: 1 2 3 

Top

Related drugs of malignant transformation related genes

check buttonIdentification of chemicals and drugs interact with genes involved in malignant transfromation
(DGIdb 4.0)
Entrez IDSymbolCategoryInteraction TypesDrug Claim NameDrug NamePMIDs
Page: 1