| Tissue | Expression Dynamics | Abbreviation |
| Colorectum (GSE201348) |  | FAP: Familial adenomatous polyposis |
| CRC: Colorectal cancer |
| Colorectum (HTA11) |  | AD: Adenomas |
| SER: Sessile serrated lesions |
| MSI-H: Microsatellite-high colorectal cancer |
| MSS: Microsatellite stable colorectal cancer |
| Esophagus | 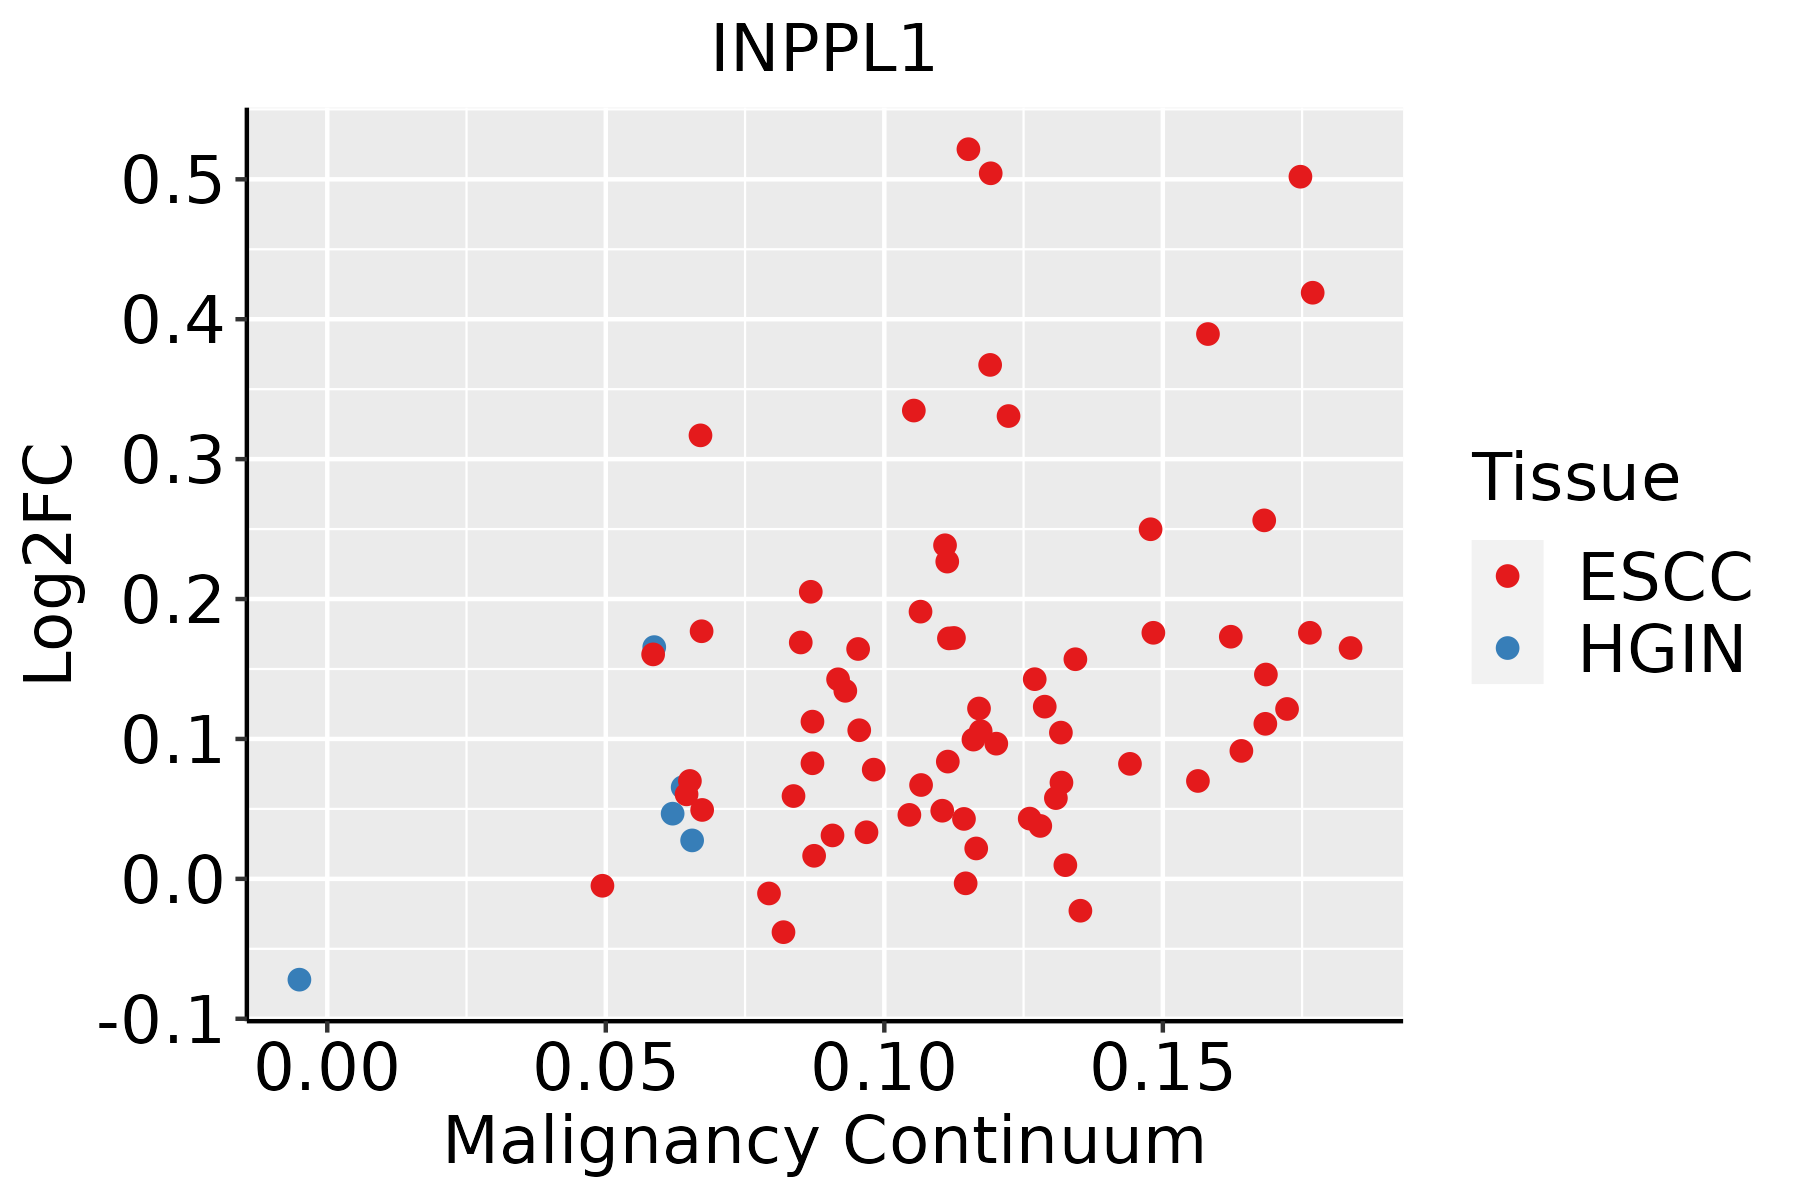 | ESCC: Esophageal squamous cell carcinoma |
| HGIN: High-grade intraepithelial neoplasias |
| LGIN: Low-grade intraepithelial neoplasias |
| Liver | 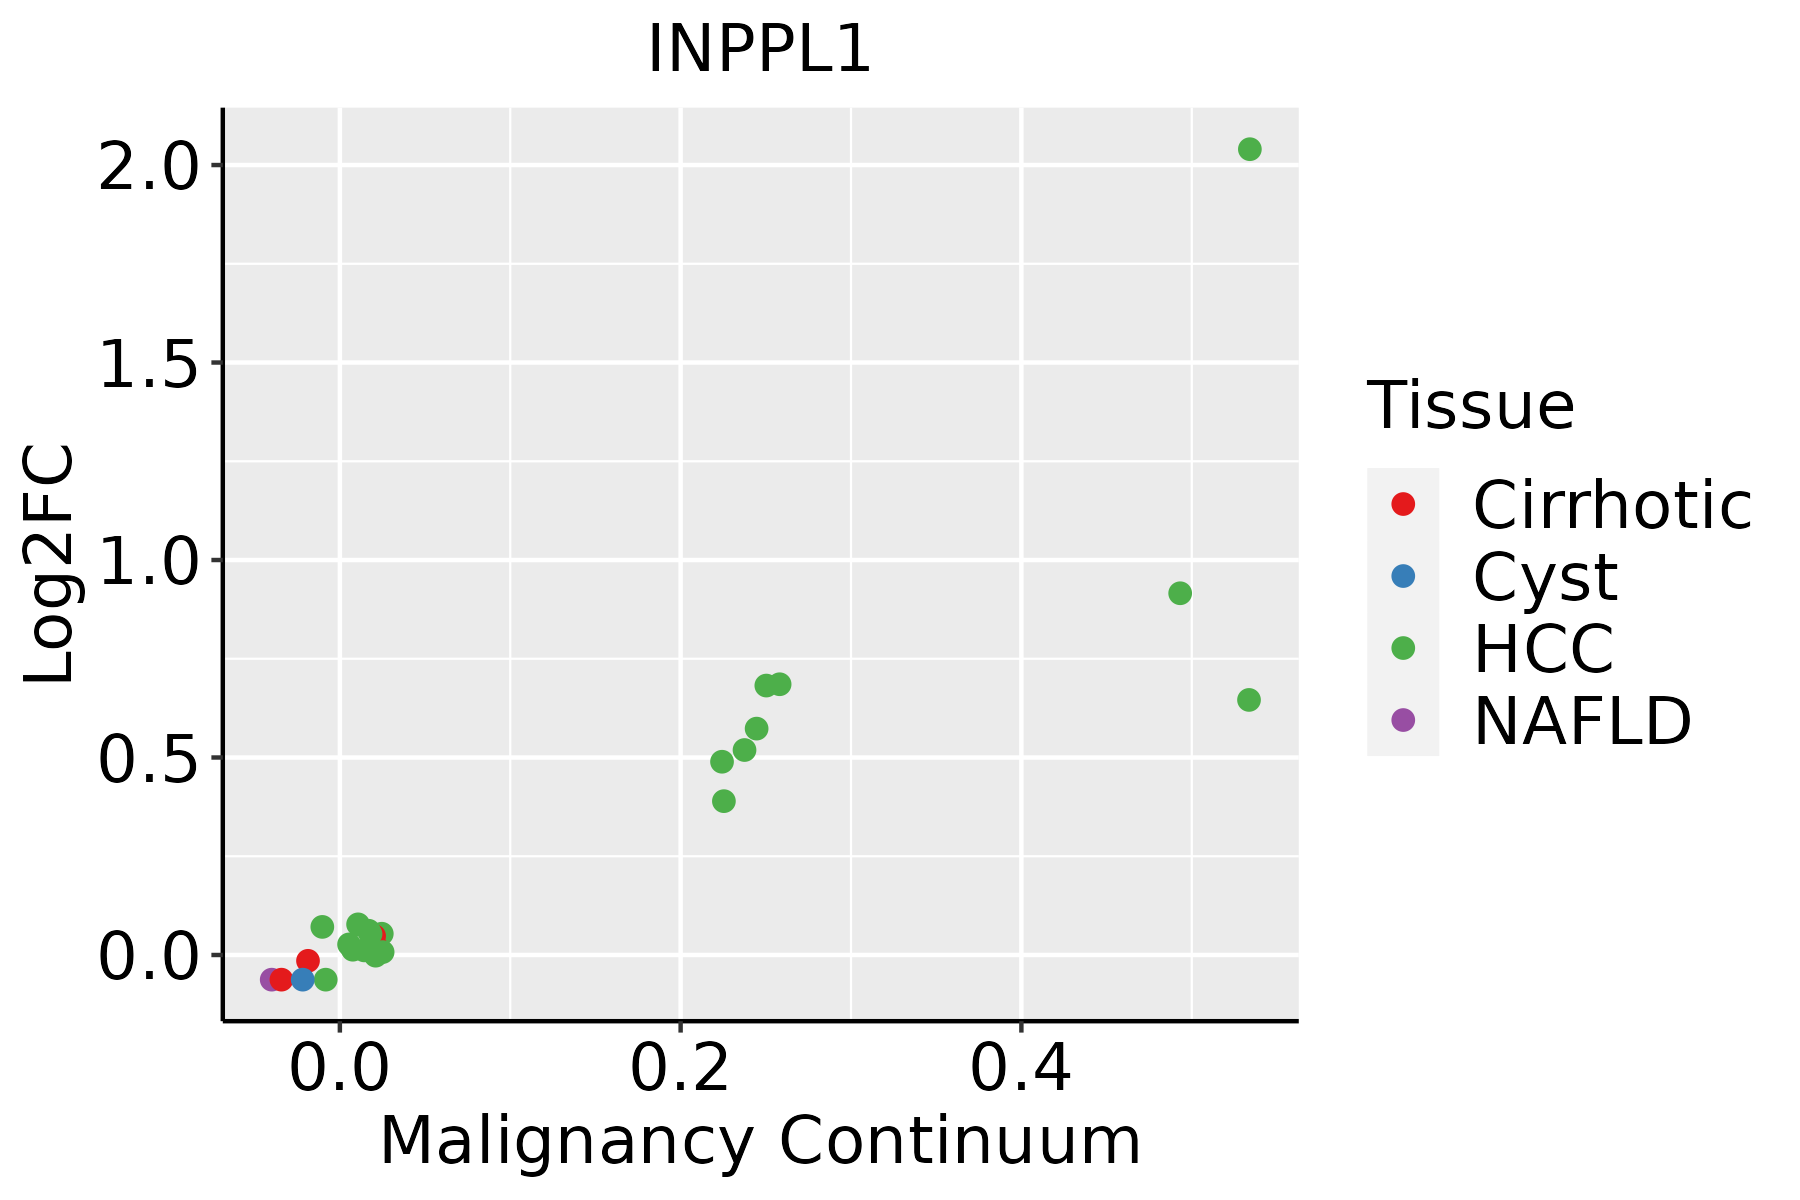 | HCC: Hepatocellular carcinoma |
| NAFLD: Non-alcoholic fatty liver disease |
| Oral Cavity | 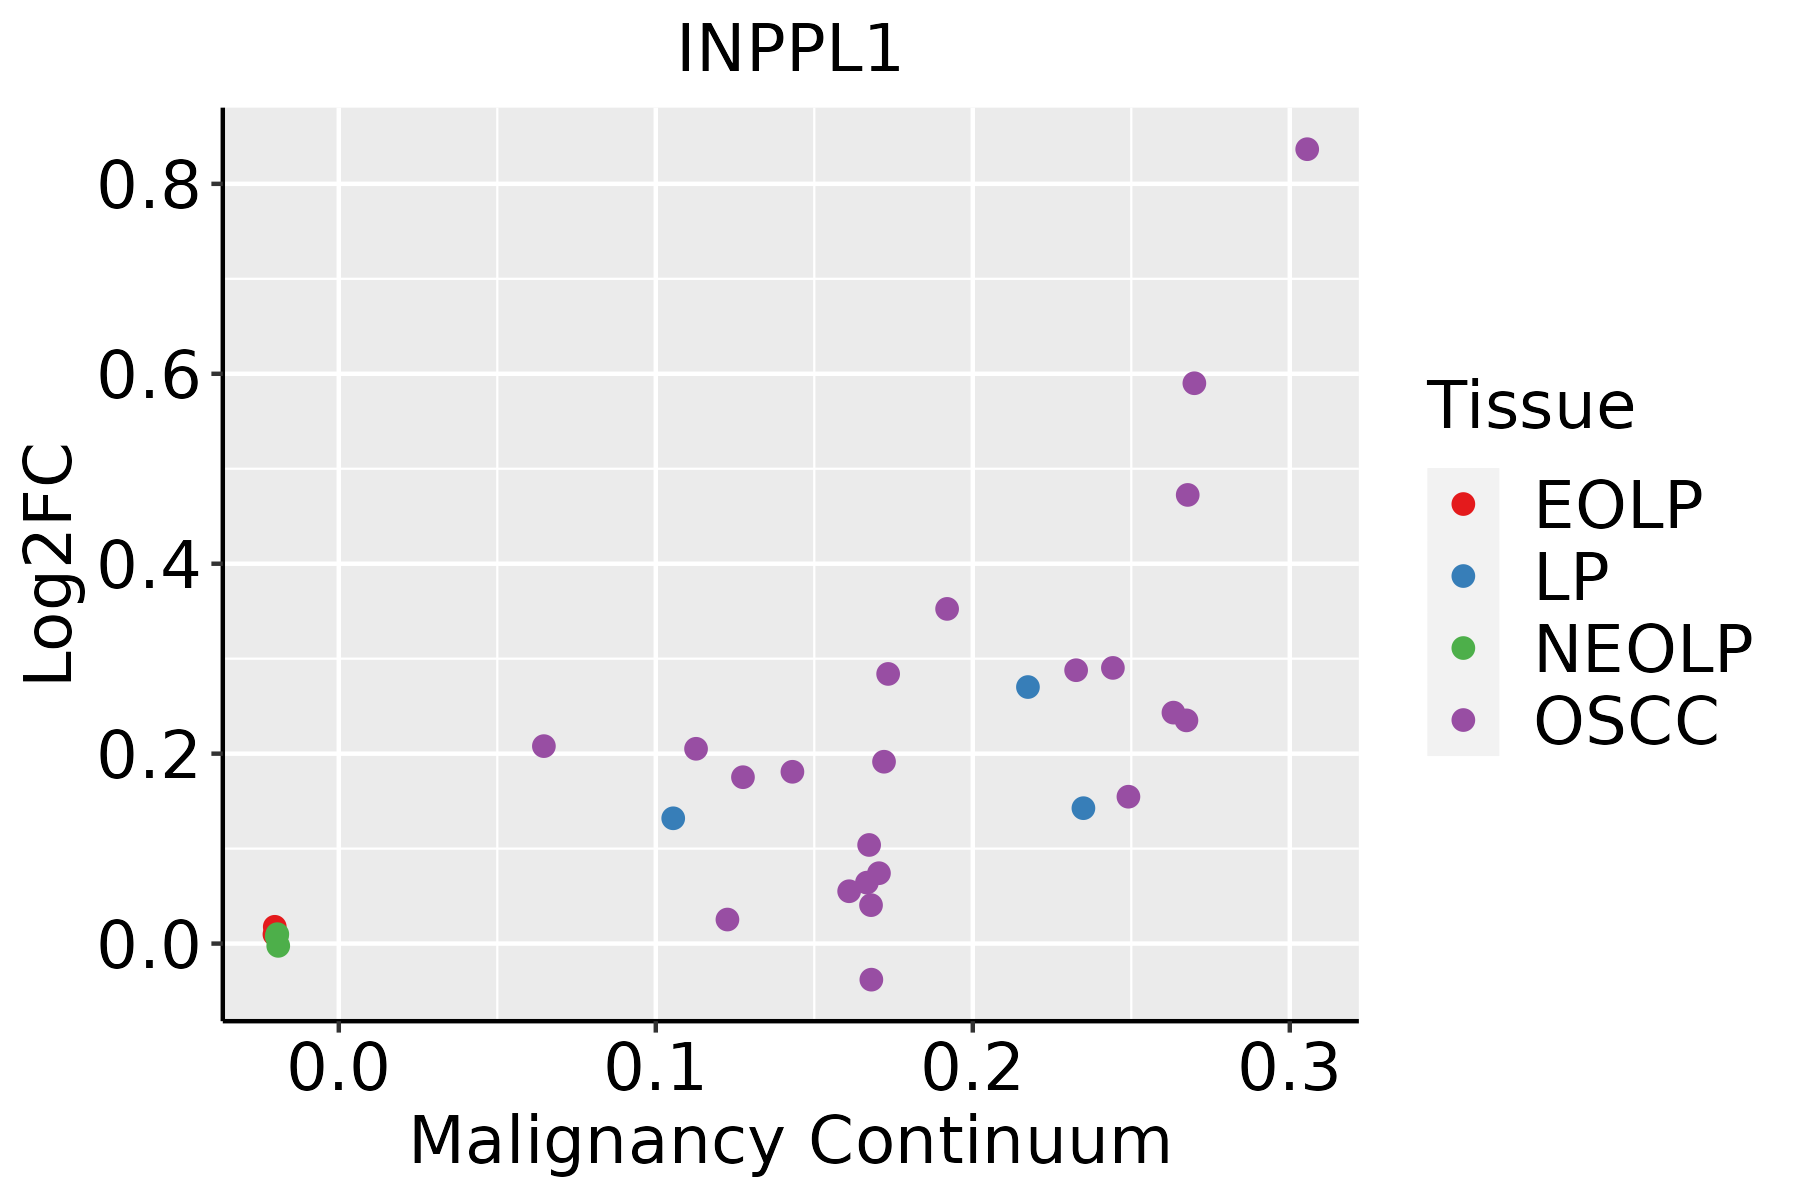 | EOLP: Erosive Oral lichen planus |
| LP: leukoplakia |
| NEOLP: Non-erosive oral lichen planus |
| OSCC: Oral squamous cell carcinoma |
| Thyroid |  | ATC: Anaplastic thyroid cancer |
| HT: Hashimoto's thyroiditis |
| PTC: Papillary thyroid cancer |
| GO ID | Tissue | Disease Stage | Description | Gene Ratio | Bg Ratio | pvalue | p.adjust | Count |
| GO:0007015 | Colorectum | AD | actin filament organization | 167/3918 | 442/18723 | 1.65e-16 | 7.94e-14 | 167 |
| GO:0032868 | Colorectum | AD | response to insulin | 91/3918 | 264/18723 | 2.02e-07 | 8.48e-06 | 91 |
| GO:0043434 | Colorectum | AD | response to peptide hormone | 126/3918 | 414/18723 | 2.70e-06 | 7.86e-05 | 126 |
| GO:0016311 | Colorectum | AD | dephosphorylation | 123/3918 | 417/18723 | 1.84e-05 | 3.82e-04 | 123 |
| GO:0019318 | Colorectum | AD | hexose metabolic process | 77/3918 | 237/18723 | 1.96e-05 | 4.01e-04 | 77 |
| GO:0005996 | Colorectum | AD | monosaccharide metabolic process | 80/3918 | 257/18723 | 7.31e-05 | 1.17e-03 | 80 |
| GO:0030258 | Colorectum | AD | lipid modification | 67/3918 | 212/18723 | 1.66e-04 | 2.27e-03 | 67 |
| GO:0006006 | Colorectum | AD | glucose metabolic process | 62/3918 | 196/18723 | 2.76e-04 | 3.39e-03 | 62 |
| GO:0009791 | Colorectum | AD | post-embryonic development | 29/3918 | 80/18723 | 1.13e-03 | 1.03e-02 | 29 |
| GO:0006650 | Colorectum | AD | glycerophospholipid metabolic process | 83/3918 | 306/18723 | 5.40e-03 | 3.55e-02 | 83 |
| GO:0006644 | Colorectum | AD | phospholipid metabolic process | 101/3918 | 383/18723 | 5.80e-03 | 3.67e-02 | 101 |
| GO:0001503 | Colorectum | AD | ossification | 106/3918 | 408/18723 | 7.68e-03 | 4.64e-02 | 106 |
| GO:0045017 | Colorectum | AD | glycerolipid biosynthetic process | 69/3918 | 252/18723 | 8.33e-03 | 4.88e-02 | 69 |
| GO:00070151 | Colorectum | SER | actin filament organization | 134/2897 | 442/18723 | 1.39e-15 | 5.70e-13 | 134 |
| GO:00328681 | Colorectum | SER | response to insulin | 65/2897 | 264/18723 | 6.70e-05 | 1.53e-03 | 65 |
| GO:00434341 | Colorectum | SER | response to peptide hormone | 93/2897 | 414/18723 | 9.61e-05 | 2.04e-03 | 93 |
| GO:00193181 | Colorectum | SER | hexose metabolic process | 56/2897 | 237/18723 | 6.19e-04 | 8.42e-03 | 56 |
| GO:00059961 | Colorectum | SER | monosaccharide metabolic process | 59/2897 | 257/18723 | 9.65e-04 | 1.15e-02 | 59 |
| GO:00060061 | Colorectum | SER | glucose metabolic process | 46/2897 | 196/18723 | 2.08e-03 | 2.05e-02 | 46 |
| GO:0046486 | Colorectum | SER | glycerolipid metabolic process | 82/2897 | 392/18723 | 2.26e-03 | 2.17e-02 | 82 |
| Pathway ID | Tissue | Disease Stage | Description | Gene Ratio | Bg Ratio | pvalue | p.adjust | qvalue | Count |
| hsa046662 | Colorectum | SER | Fc gamma R-mediated phagocytosis | 39/1580 | 97/8465 | 5.84e-07 | 9.70e-06 | 7.04e-06 | 39 |
| hsa046663 | Colorectum | SER | Fc gamma R-mediated phagocytosis | 39/1580 | 97/8465 | 5.84e-07 | 9.70e-06 | 7.04e-06 | 39 |
| hsa046664 | Colorectum | MSS | Fc gamma R-mediated phagocytosis | 45/1875 | 97/8465 | 9.30e-08 | 1.56e-06 | 9.55e-07 | 45 |
| hsa04910 | Colorectum | MSS | Insulin signaling pathway | 43/1875 | 137/8465 | 7.37e-03 | 2.84e-02 | 1.74e-02 | 43 |
| hsa046665 | Colorectum | MSS | Fc gamma R-mediated phagocytosis | 45/1875 | 97/8465 | 9.30e-08 | 1.56e-06 | 9.55e-07 | 45 |
| hsa049101 | Colorectum | MSS | Insulin signaling pathway | 43/1875 | 137/8465 | 7.37e-03 | 2.84e-02 | 1.74e-02 | 43 |
| hsa046668 | Colorectum | CRC | Fc gamma R-mediated phagocytosis | 27/1091 | 97/8465 | 6.24e-05 | 1.12e-03 | 7.57e-04 | 27 |
| hsa04070 | Colorectum | CRC | Phosphatidylinositol signaling system | 25/1091 | 97/8465 | 4.27e-04 | 4.60e-03 | 3.12e-03 | 25 |
| hsa049104 | Colorectum | CRC | Insulin signaling pathway | 31/1091 | 137/8465 | 1.07e-03 | 8.91e-03 | 6.03e-03 | 31 |
| hsa00562 | Colorectum | CRC | Inositol phosphate metabolism | 18/1091 | 73/8465 | 4.38e-03 | 2.52e-02 | 1.71e-02 | 18 |
| hsa046669 | Colorectum | CRC | Fc gamma R-mediated phagocytosis | 27/1091 | 97/8465 | 6.24e-05 | 1.12e-03 | 7.57e-04 | 27 |
| hsa040701 | Colorectum | CRC | Phosphatidylinositol signaling system | 25/1091 | 97/8465 | 4.27e-04 | 4.60e-03 | 3.12e-03 | 25 |
| hsa049105 | Colorectum | CRC | Insulin signaling pathway | 31/1091 | 137/8465 | 1.07e-03 | 8.91e-03 | 6.03e-03 | 31 |
| hsa005621 | Colorectum | CRC | Inositol phosphate metabolism | 18/1091 | 73/8465 | 4.38e-03 | 2.52e-02 | 1.71e-02 | 18 |
| hsa049109 | Esophagus | ESCC | Insulin signaling pathway | 89/4205 | 137/8465 | 1.97e-04 | 7.32e-04 | 3.75e-04 | 89 |
| hsa0466620 | Esophagus | ESCC | Fc gamma R-mediated phagocytosis | 63/4205 | 97/8465 | 1.63e-03 | 4.89e-03 | 2.50e-03 | 63 |
| hsa0491014 | Esophagus | ESCC | Insulin signaling pathway | 89/4205 | 137/8465 | 1.97e-04 | 7.32e-04 | 3.75e-04 | 89 |
| hsa04666110 | Esophagus | ESCC | Fc gamma R-mediated phagocytosis | 63/4205 | 97/8465 | 1.63e-03 | 4.89e-03 | 2.50e-03 | 63 |
| hsa0491041 | Liver | HCC | Insulin signaling pathway | 95/4020 | 137/8465 | 1.53e-07 | 1.97e-06 | 1.10e-06 | 95 |
| hsa0466610 | Liver | HCC | Fc gamma R-mediated phagocytosis | 58/4020 | 97/8465 | 9.65e-03 | 2.52e-02 | 1.40e-02 | 58 |
| Hugo Symbol | Variant Class | Variant Classification | dbSNP RS | HGVSc | HGVSp | HGVSp Short | SWISSPROT | BIOTYPE | SIFT | PolyPhen | Tumor Sample Barcode | Tissue | Histology | Sex | Age | Stage | Therapy Types | Drugs | Outcome |
| INPPL1 | SNV | Missense_Mutation | | c.409N>A | p.Glu137Lys | p.E137K | O15357 | protein_coding | tolerated(0.13) | possibly_damaging(0.76) | TCGA-A2-A0EQ-01 | Breast | breast invasive carcinoma | Female | <65 | I/II | Chemotherapy | adriamycin | SD |
| INPPL1 | SNV | Missense_Mutation | | c.1214N>A | p.Cys405Tyr | p.C405Y | O15357 | protein_coding | deleterious(0) | probably_damaging(0.996) | TCGA-A8-A09Z-01 | Breast | breast invasive carcinoma | Female | >=65 | I/II | Unknown | Unknown | SD |
| INPPL1 | SNV | Missense_Mutation | | c.1408N>C | p.Gly470Arg | p.G470R | O15357 | protein_coding | deleterious(0) | probably_damaging(1) | TCGA-AC-A23C-01 | Breast | breast invasive carcinoma | Female | <65 | I/II | Chemotherapy | chemo | CR |
| INPPL1 | SNV | Missense_Mutation | | c.3556C>A | p.Pro1186Thr | p.P1186T | O15357 | protein_coding | tolerated(0.58) | benign(0.018) | TCGA-AC-A23H-01 | Breast | breast invasive carcinoma | Female | >=65 | I/II | Unknown | Unknown | PD |
| INPPL1 | SNV | Missense_Mutation | novel | c.2515N>T | p.Val839Phe | p.V839F | O15357 | protein_coding | deleterious(0) | benign(0.386) | TCGA-AN-A0FW-01 | Breast | breast invasive carcinoma | Female | >=65 | III/IV | Unknown | Unknown | SD |
| INPPL1 | SNV | Missense_Mutation | | c.2653N>T | p.Leu885Phe | p.L885F | O15357 | protein_coding | deleterious(0.02) | possibly_damaging(0.737) | TCGA-D8-A1XQ-01 | Breast | breast invasive carcinoma | Female | >=65 | I/II | Unknown | Unknown | SD |
| INPPL1 | SNV | Missense_Mutation | rs376117918 | c.1636G>A | p.Val546Ile | p.V546I | O15357 | protein_coding | tolerated(0.13) | benign(0.179) | TCGA-E2-A1LL-01 | Breast | breast invasive carcinoma | Female | >=65 | III/IV | Chemotherapy | docetaxel | PD |
| INPPL1 | SNV | Missense_Mutation | novel | c.629N>A | p.Thr210Asn | p.T210N | O15357 | protein_coding | deleterious(0.02) | possibly_damaging(0.806) | TCGA-OL-A5D7-01 | Breast | breast invasive carcinoma | Female | >=65 | I/II | Chemotherapy | cytoxan | CR |
| INPPL1 | SNV | Missense_Mutation | novel | c.1681N>T | p.His561Tyr | p.H561Y | O15357 | protein_coding | deleterious(0) | probably_damaging(0.99) | TCGA-Z7-A8R6-01 | Breast | breast invasive carcinoma | Female | <65 | I/II | Chemotherapy | taxol | CR |
| INPPL1 | insertion | Frame_Shift_Ins | novel | c.780_781insGTTTCACCATGTTGGCCAGGGTGGT | p.Leu261ValfsTer51 | p.L261Vfs*51 | O15357 | protein_coding | | | TCGA-A2-A0CP-01 | Breast | breast invasive carcinoma | Female | <65 | I/II | Chemotherapy | cytoxan | SD |


