
|
|||||
|
 | |
| |
| |
| |
| |
| |
|
Gene: IGSF3 |
Gene summary for IGSF3 |
| Gene information | Species | Human | Gene symbol | IGSF3 | Gene ID | 3321 |
| Gene name | immunoglobulin superfamily member 3 | |
| Gene Alias | EWI-3 | |
| Cytomap | 1p13.1 | |
| Gene Type | protein-coding | GO ID | GO:0007275 | UniProtAcc | O75054 |
Top |
Malignant transformation analysis |
| Identification of the aberrant gene expression in precancerous and cancerous lesions by comparing the gene expression of stem-like cells in diseased tissues with normal stem cells |
| Entrez ID | Symbol | Replicates | Species | Organ | Tissue | Adj P-value | Log2FC | Malignancy |
| 3321 | IGSF3 | P62T-E | Human | Esophagus | ESCC | 4.45e-45 | 7.42e-01 | 0.1302 |
| 3321 | IGSF3 | P65T-E | Human | Esophagus | ESCC | 1.79e-07 | 1.61e-01 | 0.0978 |
| 3321 | IGSF3 | P74T-E | Human | Esophagus | ESCC | 2.16e-24 | 6.18e-01 | 0.1479 |
| 3321 | IGSF3 | P75T-E | Human | Esophagus | ESCC | 1.18e-02 | 2.44e-02 | 0.1125 |
| 3321 | IGSF3 | P76T-E | Human | Esophagus | ESCC | 1.04e-06 | 1.60e-01 | 0.1207 |
| 3321 | IGSF3 | P79T-E | Human | Esophagus | ESCC | 5.06e-12 | 2.78e-01 | 0.1154 |
| 3321 | IGSF3 | P80T-E | Human | Esophagus | ESCC | 2.57e-19 | 4.28e-01 | 0.155 |
| 3321 | IGSF3 | P82T-E | Human | Esophagus | ESCC | 5.47e-03 | 1.55e-01 | 0.1072 |
| 3321 | IGSF3 | P83T-E | Human | Esophagus | ESCC | 2.61e-17 | 5.78e-01 | 0.1738 |
| 3321 | IGSF3 | P84T-E | Human | Esophagus | ESCC | 1.38e-03 | 2.00e-01 | 0.0933 |
| 3321 | IGSF3 | P89T-E | Human | Esophagus | ESCC | 3.43e-10 | 4.34e-01 | 0.1752 |
| 3321 | IGSF3 | P91T-E | Human | Esophagus | ESCC | 1.19e-13 | 1.44e+00 | 0.1828 |
| 3321 | IGSF3 | P107T-E | Human | Esophagus | ESCC | 5.73e-10 | 1.67e-01 | 0.171 |
| 3321 | IGSF3 | P126T-E | Human | Esophagus | ESCC | 2.92e-04 | 3.63e-01 | 0.1125 |
| 3321 | IGSF3 | P127T-E | Human | Esophagus | ESCC | 7.55e-12 | 1.55e-01 | 0.0826 |
| 3321 | IGSF3 | P128T-E | Human | Esophagus | ESCC | 3.46e-08 | 3.03e-01 | 0.1241 |
| 3321 | IGSF3 | P130T-E | Human | Esophagus | ESCC | 3.76e-29 | 5.51e-01 | 0.1676 |
| 3321 | IGSF3 | HCC1_Meng | Human | Liver | HCC | 5.97e-50 | 1.21e-01 | 0.0246 |
| 3321 | IGSF3 | HCC2_Meng | Human | Liver | HCC | 1.20e-11 | 6.97e-02 | 0.0107 |
| 3321 | IGSF3 | HCC2 | Human | Liver | HCC | 7.44e-08 | 1.23e+00 | 0.5341 |
| Page: 1 2 3 4 5 |
| Tissue | Expression Dynamics | Abbreviation |
| Esophagus |  | ESCC: Esophageal squamous cell carcinoma |
| HGIN: High-grade intraepithelial neoplasias | ||
| LGIN: Low-grade intraepithelial neoplasias | ||
| Liver | 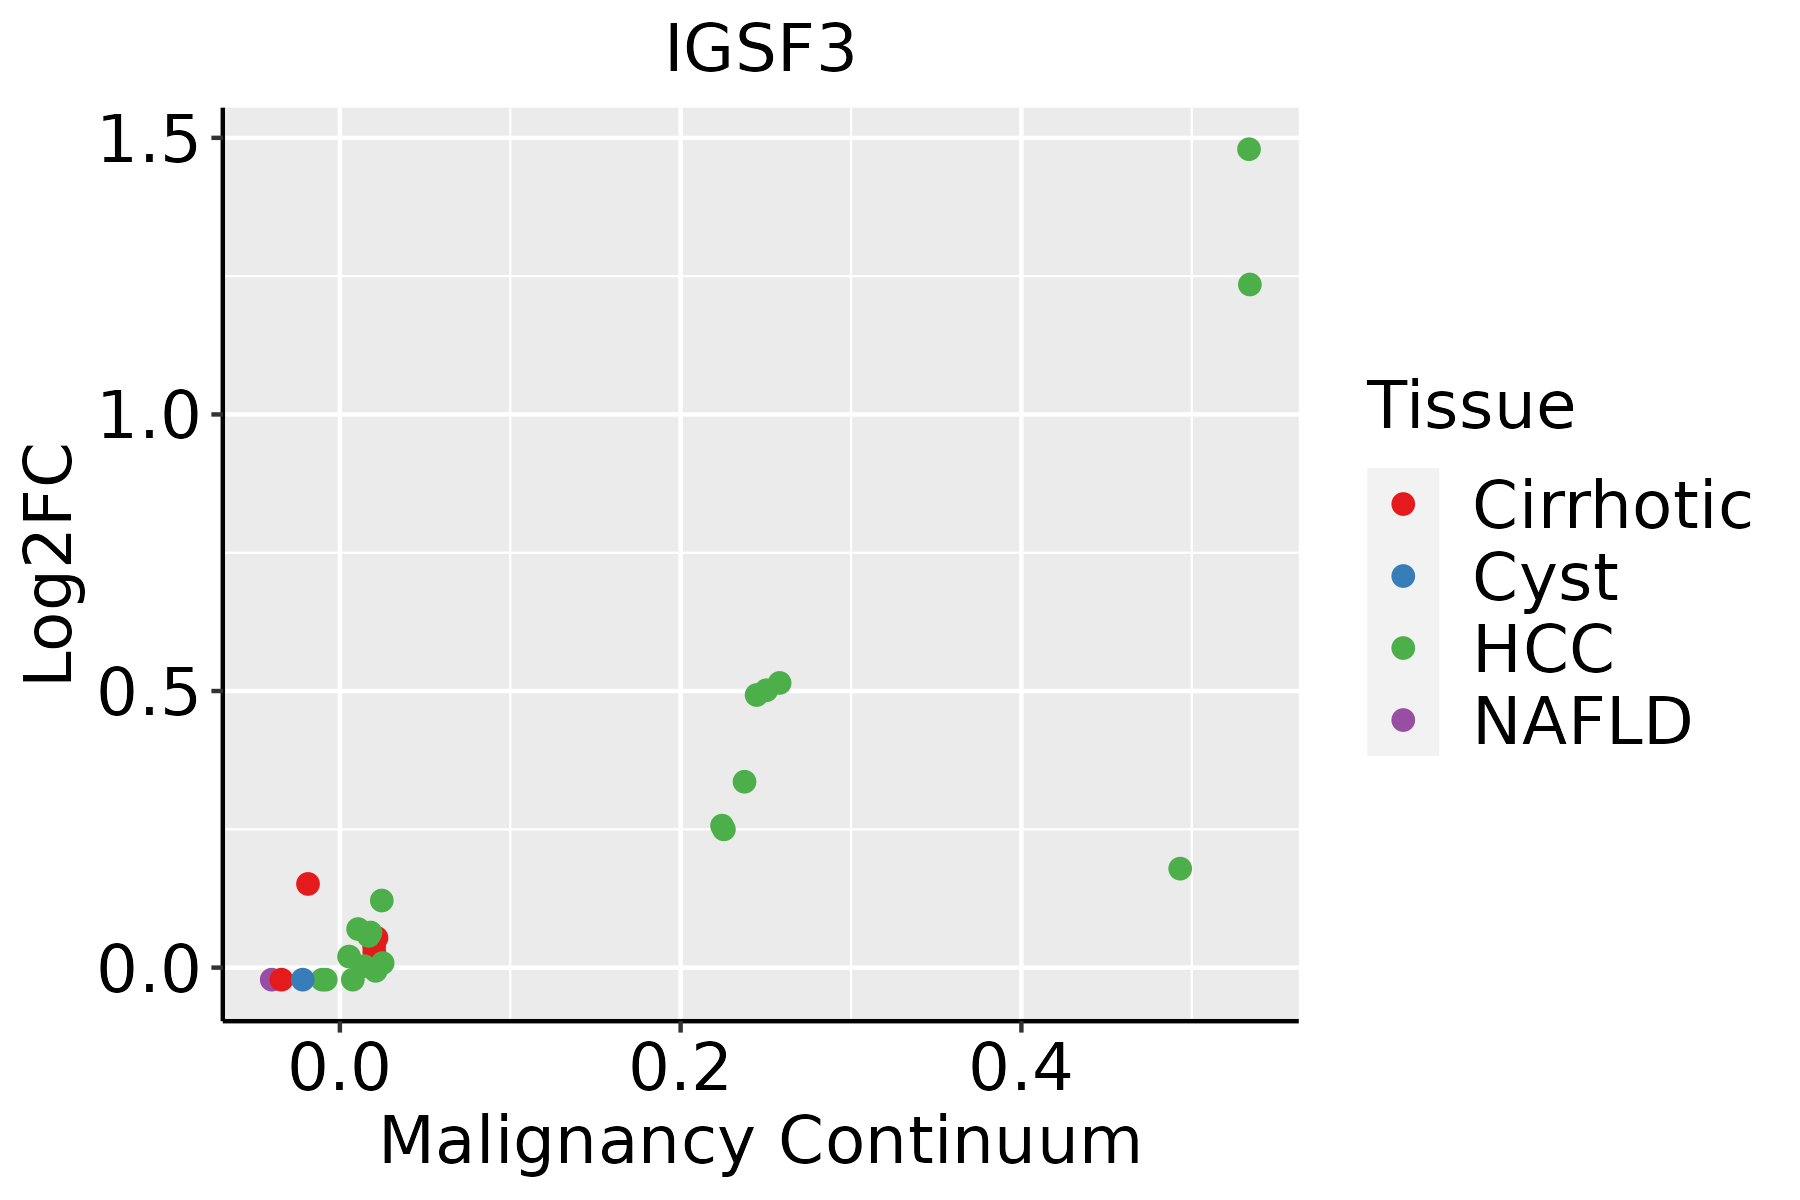 | HCC: Hepatocellular carcinoma |
| NAFLD: Non-alcoholic fatty liver disease | ||
| Oral Cavity |  | EOLP: Erosive Oral lichen planus |
| LP: leukoplakia | ||
| NEOLP: Non-erosive oral lichen planus | ||
| OSCC: Oral squamous cell carcinoma | ||
| Skin | 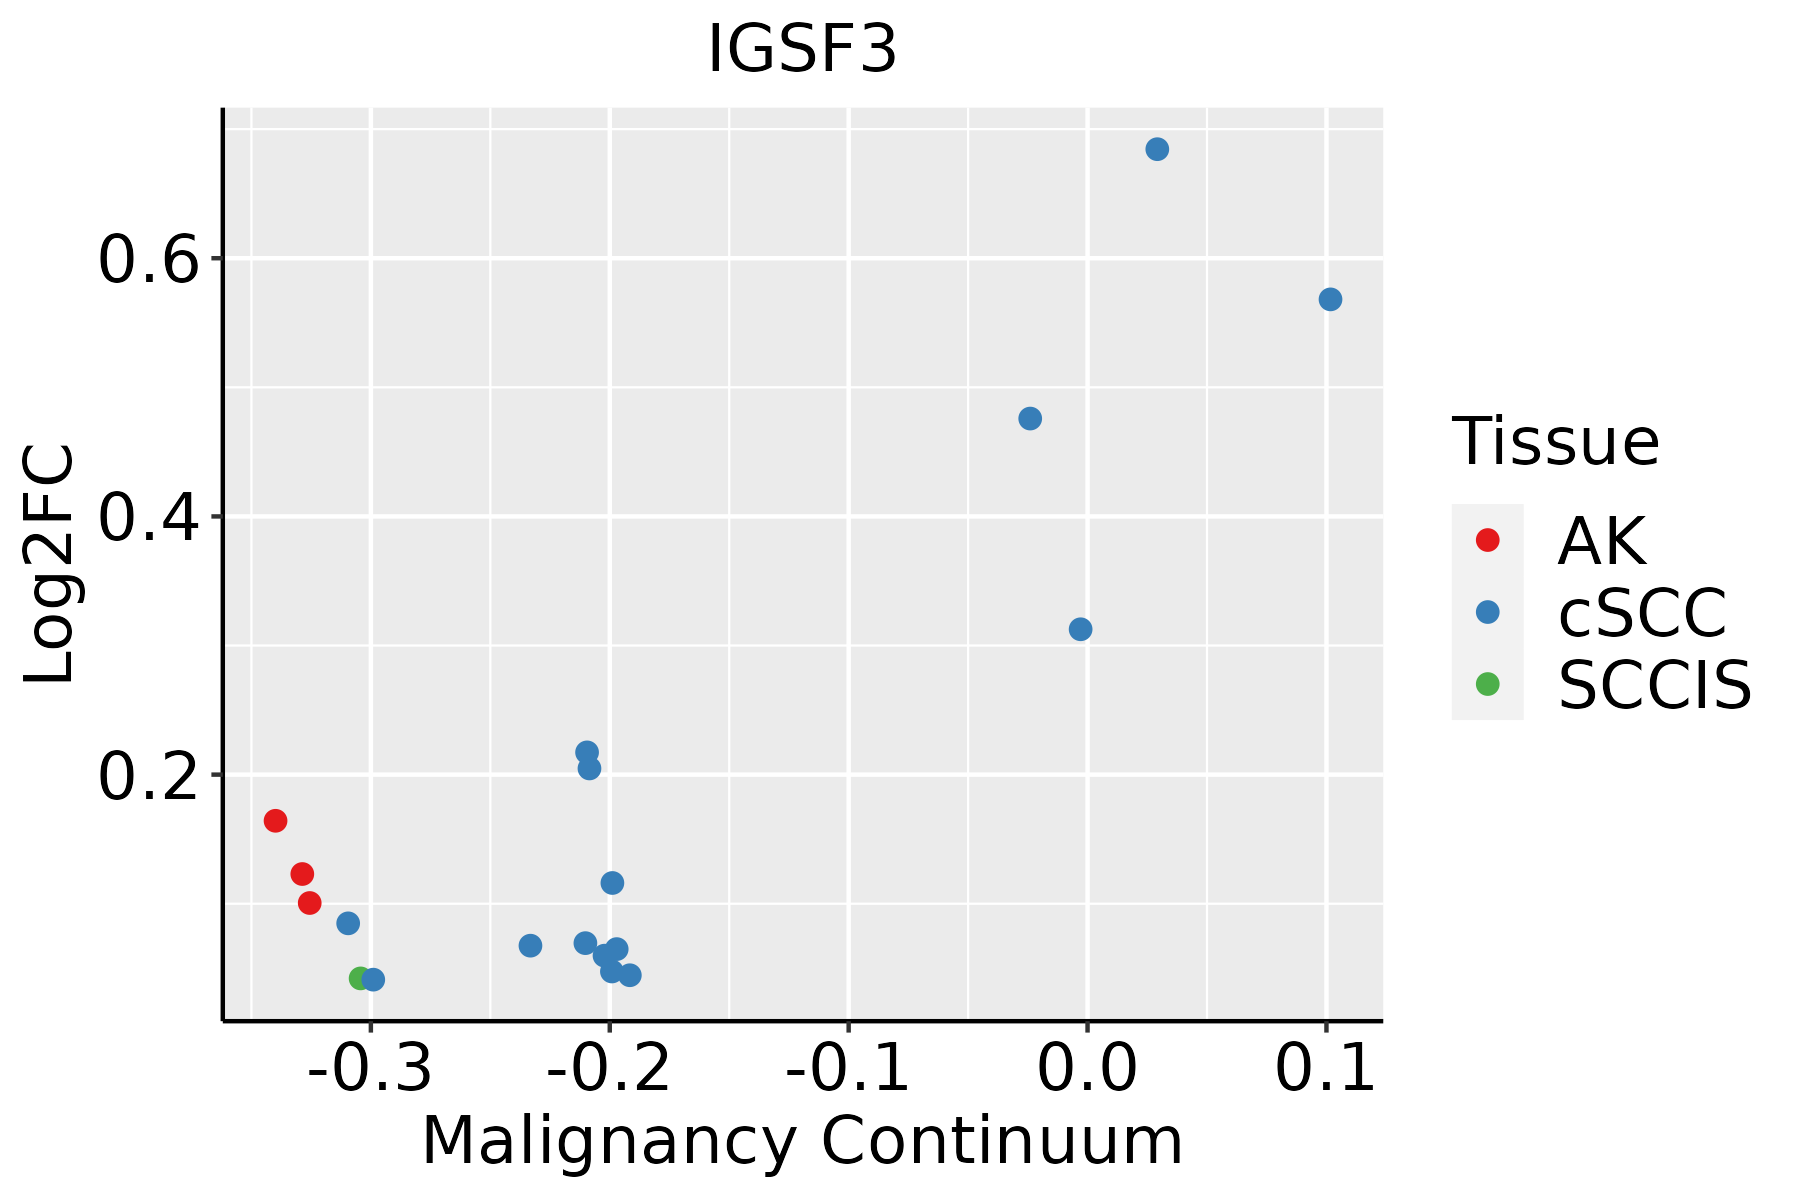 | AK: Actinic keratosis |
| cSCC: Cutaneous squamous cell carcinoma | ||
| SCCIS:squamous cell carcinoma in situ |
| ∗log2FC in expression of this searched gene in stem-like cells from each diseased tissue sample relative to stem-like cells in normal samples in each tissue plotted against the malignancy continuum. Samples are colored based on if they are from different disease stage. |
Top |
Malignant transformation related pathway analysis |
| Find out the enriched GO biological processes and KEGG pathways involved in transition from healthy to precancer to cancer |
| Tissue | Disease Stage | Enriched GO biological Processes |
| Colorectum | AD |  |
| Colorectum | SER |  |
| Colorectum | MSS |  |
| Colorectum | MSI-H |  |
| Colorectum | FAP |  |
| ∗Top 15 enriched GO BP terms are showed in the bar plot of each disease state in each tissue. Each row represents a significant GO biological process which is colored according to the -log10(p.adjust). |
| Page: 1 2 3 4 5 6 7 8 9 |
| GO ID | Tissue | Disease Stage | Description | Gene Ratio | Bg Ratio | pvalue | p.adjust | Count |
| GO:0048732111 | Esophagus | ESCC | gland development | 269/8552 | 436/18723 | 7.81e-12 | 2.95e-10 | 269 |
| GO:004873222 | Liver | HCC | gland development | 242/7958 | 436/18723 | 2.26e-08 | 5.28e-07 | 242 |
| GO:004873220 | Oral cavity | OSCC | gland development | 226/7305 | 436/18723 | 2.78e-08 | 5.39e-07 | 226 |
| GO:0048732110 | Oral cavity | LP | gland development | 149/4623 | 436/18723 | 4.51e-06 | 9.17e-05 | 149 |
| GO:004873227 | Skin | cSCC | gland development | 167/4864 | 436/18723 | 7.64e-09 | 2.44e-07 | 167 |
| Page: 1 |
| Pathway ID | Tissue | Disease Stage | Description | Gene Ratio | Bg Ratio | pvalue | p.adjust | qvalue | Count |
| Page: 1 |
Top |
Cell-cell communication analysis |
| Identification of potential cell-cell interactions between two cell types and their ligand-receptor pairs for different disease states |
| Ligand | Receptor | LRpair | Pathway | Tissue | Disease Stage |
| Page: 1 |
Top |
Single-cell gene regulatory network inference analysis |
| Find out the significant the regulons (TFs) and the target genes of each regulon across cell types for different disease states |
| TF | Cell Type | Tissue | Disease Stage | Target Gene | RSS | Regulon Activity |
| ∗The dot plots of a searched regulon are shown for all cell subpopulations in each disease state of each tissue based on the regulon specific score inferred using pySCENIC and by calculating the average expression. |
| Page: 1 |
Top |
Somatic mutation of malignant transformation related genes |
| Annotation of somatic variants for genes involved in malignant transformation |
| Hugo Symbol | Variant Class | Variant Classification | dbSNP RS | HGVSc | HGVSp | HGVSp Short | SWISSPROT | BIOTYPE | SIFT | PolyPhen | Tumor Sample Barcode | Tissue | Histology | Sex | Age | Stage | Therapy Types | Drugs | Outcome |
| IGSF3 | SNV | Missense_Mutation | novel | c.2456N>T | p.Ala819Val | p.A819V | O75054 | protein_coding | deleterious(0.01) | possibly_damaging(0.848) | TCGA-AO-A128-01 | Breast | breast invasive carcinoma | Female | <65 | I/II | Chemotherapy | doxorubicin | SD |
| IGSF3 | SNV | Missense_Mutation | novel | c.2114N>G | p.Ser705Trp | p.S705W | O75054 | protein_coding | deleterious(0) | probably_damaging(0.964) | TCGA-BH-A0H5-01 | Breast | breast invasive carcinoma | Female | <65 | I/II | Chemotherapy | cytoxan | CR |
| IGSF3 | SNV | Missense_Mutation | c.3203C>T | p.Pro1068Leu | p.P1068L | O75054 | protein_coding | tolerated(0.34) | benign(0.079) | TCGA-C8-A12K-01 | Breast | breast invasive carcinoma | Female | >=65 | I/II | Unknown | Unknown | SD | |
| IGSF3 | insertion | In_Frame_Ins | novel | c.921_922insGGG | p.Gln307_Asn308insGly | p.Q307_N308insG | O75054 | protein_coding | TCGA-A7-A0CJ-01 | Breast | breast invasive carcinoma | Female | <65 | I/II | Chemotherapy | cytoxan | SD | ||
| IGSF3 | insertion | Frame_Shift_Ins | novel | c.2921_2922insCTCTTGGTTGGCTT | p.Gln974HisfsTer45 | p.Q974Hfs*45 | O75054 | protein_coding | TCGA-A8-A08H-01 | Breast | breast invasive carcinoma | Female | >=65 | I/II | Unknown | Unknown | SD | ||
| IGSF3 | insertion | Frame_Shift_Ins | novel | c.1532_1533insTGAAAGA | p.Asn512GlufsTer21 | p.N512Efs*21 | O75054 | protein_coding | TCGA-AN-A046-01 | Breast | breast invasive carcinoma | Female | >=65 | I/II | Unknown | Unknown | SD | ||
| IGSF3 | SNV | Missense_Mutation | rs551475395 | c.1649N>A | p.Arg550His | p.R550H | O75054 | protein_coding | tolerated(0.12) | benign(0.384) | TCGA-EA-A410-01 | Cervix | cervical & endocervical cancer | Female | <65 | I/II | Unknown | Unknown | SD |
| IGSF3 | SNV | Missense_Mutation | rs530464588 | c.554N>A | p.Arg185Gln | p.R185Q | O75054 | protein_coding | tolerated(0.2) | possibly_damaging(0.54) | TCGA-5M-AAT6-01 | Colorectum | colon adenocarcinoma | Female | <65 | III/IV | Unknown | Unknown | PD |
| IGSF3 | SNV | Missense_Mutation | novel | c.250N>C | p.Tyr84His | p.Y84H | O75054 | protein_coding | deleterious(0) | probably_damaging(0.999) | TCGA-5M-AAT6-01 | Colorectum | colon adenocarcinoma | Female | <65 | III/IV | Unknown | Unknown | PD |
| IGSF3 | SNV | Missense_Mutation | c.2728N>T | p.Arg910Trp | p.R910W | O75054 | protein_coding | deleterious(0) | probably_damaging(0.998) | TCGA-AA-3492-01 | Colorectum | colon adenocarcinoma | Female | >=65 | I/II | Unknown | Unknown | SD |
| Page: 1 2 3 4 5 6 7 8 9 10 11 12 |
Top |
Related drugs of malignant transformation related genes |
| Identification of chemicals and drugs interact with genes involved in malignant transfromation |
| (DGIdb 4.0) |
| Entrez ID | Symbol | Category | Interaction Types | Drug Claim Name | Drug Name | PMIDs |
| Page: 1 |

Copyright 2023-Present -The University of Texas Health Science Center at Houston |