
|
|||||
|
 | |
| |
| |
| |
| |
| |
|
Gene: IFRD2 |
Gene summary for IFRD2 |
| Gene information | Species | Human | Gene symbol | IFRD2 | Gene ID | 7866 |
| Gene name | interferon related developmental regulator 2 | |
| Gene Alias | IFNRP | |
| Cytomap | 3p21.31 | |
| Gene Type | protein-coding | GO ID | GO:0005575 | UniProtAcc | Q12894 |
Top |
Malignant transformation analysis |
| Identification of the aberrant gene expression in precancerous and cancerous lesions by comparing the gene expression of stem-like cells in diseased tissues with normal stem cells |
| Entrez ID | Symbol | Replicates | Species | Organ | Tissue | Adj P-value | Log2FC | Malignancy |
| 7866 | IFRD2 | P61T-E | Human | Esophagus | ESCC | 1.05e-04 | 1.68e-01 | 0.099 |
| 7866 | IFRD2 | P62T-E | Human | Esophagus | ESCC | 5.91e-21 | 6.52e-01 | 0.1302 |
| 7866 | IFRD2 | P65T-E | Human | Esophagus | ESCC | 1.56e-14 | 3.49e-01 | 0.0978 |
| 7866 | IFRD2 | P74T-E | Human | Esophagus | ESCC | 3.18e-27 | 1.08e+00 | 0.1479 |
| 7866 | IFRD2 | P75T-E | Human | Esophagus | ESCC | 1.47e-38 | 9.44e-01 | 0.1125 |
| 7866 | IFRD2 | P76T-E | Human | Esophagus | ESCC | 4.19e-25 | 6.87e-01 | 0.1207 |
| 7866 | IFRD2 | P79T-E | Human | Esophagus | ESCC | 2.75e-19 | 4.91e-01 | 0.1154 |
| 7866 | IFRD2 | P80T-E | Human | Esophagus | ESCC | 3.38e-38 | 1.45e+00 | 0.155 |
| 7866 | IFRD2 | P82T-E | Human | Esophagus | ESCC | 1.37e-10 | 6.31e-01 | 0.1072 |
| 7866 | IFRD2 | P83T-E | Human | Esophagus | ESCC | 2.56e-41 | 1.83e+00 | 0.1738 |
| 7866 | IFRD2 | P89T-E | Human | Esophagus | ESCC | 8.92e-08 | 1.02e+00 | 0.1752 |
| 7866 | IFRD2 | P91T-E | Human | Esophagus | ESCC | 2.82e-08 | 1.38e+00 | 0.1828 |
| 7866 | IFRD2 | P94T-E | Human | Esophagus | ESCC | 7.80e-06 | 7.79e-01 | 0.0879 |
| 7866 | IFRD2 | P104T-E | Human | Esophagus | ESCC | 3.48e-05 | 7.67e-01 | 0.0931 |
| 7866 | IFRD2 | P107T-E | Human | Esophagus | ESCC | 9.83e-52 | 1.36e+00 | 0.171 |
| 7866 | IFRD2 | P126T-E | Human | Esophagus | ESCC | 1.57e-04 | 1.04e+00 | 0.1125 |
| 7866 | IFRD2 | P127T-E | Human | Esophagus | ESCC | 4.02e-15 | 1.74e-01 | 0.0826 |
| 7866 | IFRD2 | P128T-E | Human | Esophagus | ESCC | 1.23e-27 | 1.17e+00 | 0.1241 |
| 7866 | IFRD2 | P130T-E | Human | Esophagus | ESCC | 1.77e-34 | 8.76e-01 | 0.1676 |
| 7866 | IFRD2 | HCC1_Meng | Human | Liver | HCC | 3.36e-76 | 3.37e-01 | 0.0246 |
| Page: 1 2 3 4 5 6 |
| Tissue | Expression Dynamics | Abbreviation |
| Esophagus | 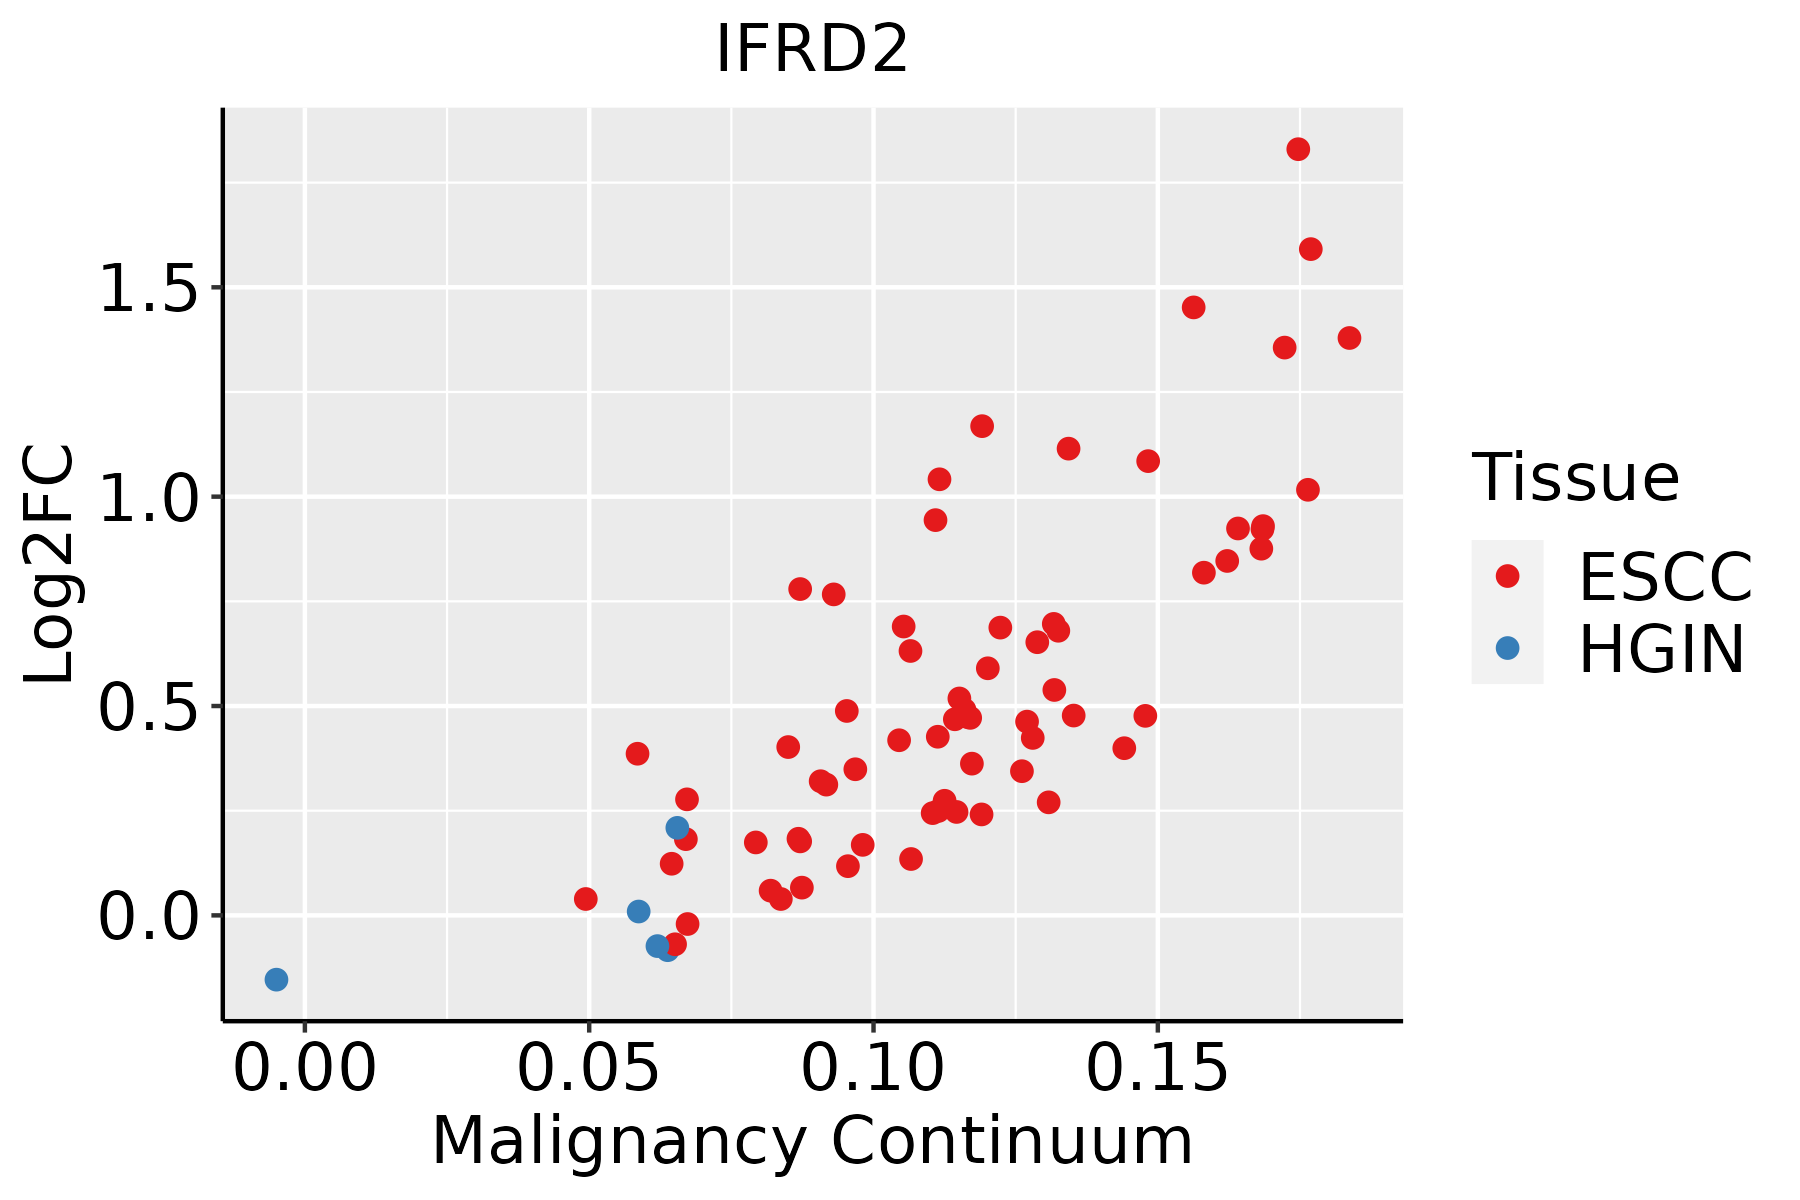 | ESCC: Esophageal squamous cell carcinoma |
| HGIN: High-grade intraepithelial neoplasias | ||
| LGIN: Low-grade intraepithelial neoplasias | ||
| Liver |  | HCC: Hepatocellular carcinoma |
| NAFLD: Non-alcoholic fatty liver disease | ||
| Oral Cavity |  | EOLP: Erosive Oral lichen planus |
| LP: leukoplakia | ||
| NEOLP: Non-erosive oral lichen planus | ||
| OSCC: Oral squamous cell carcinoma | ||
| Skin | 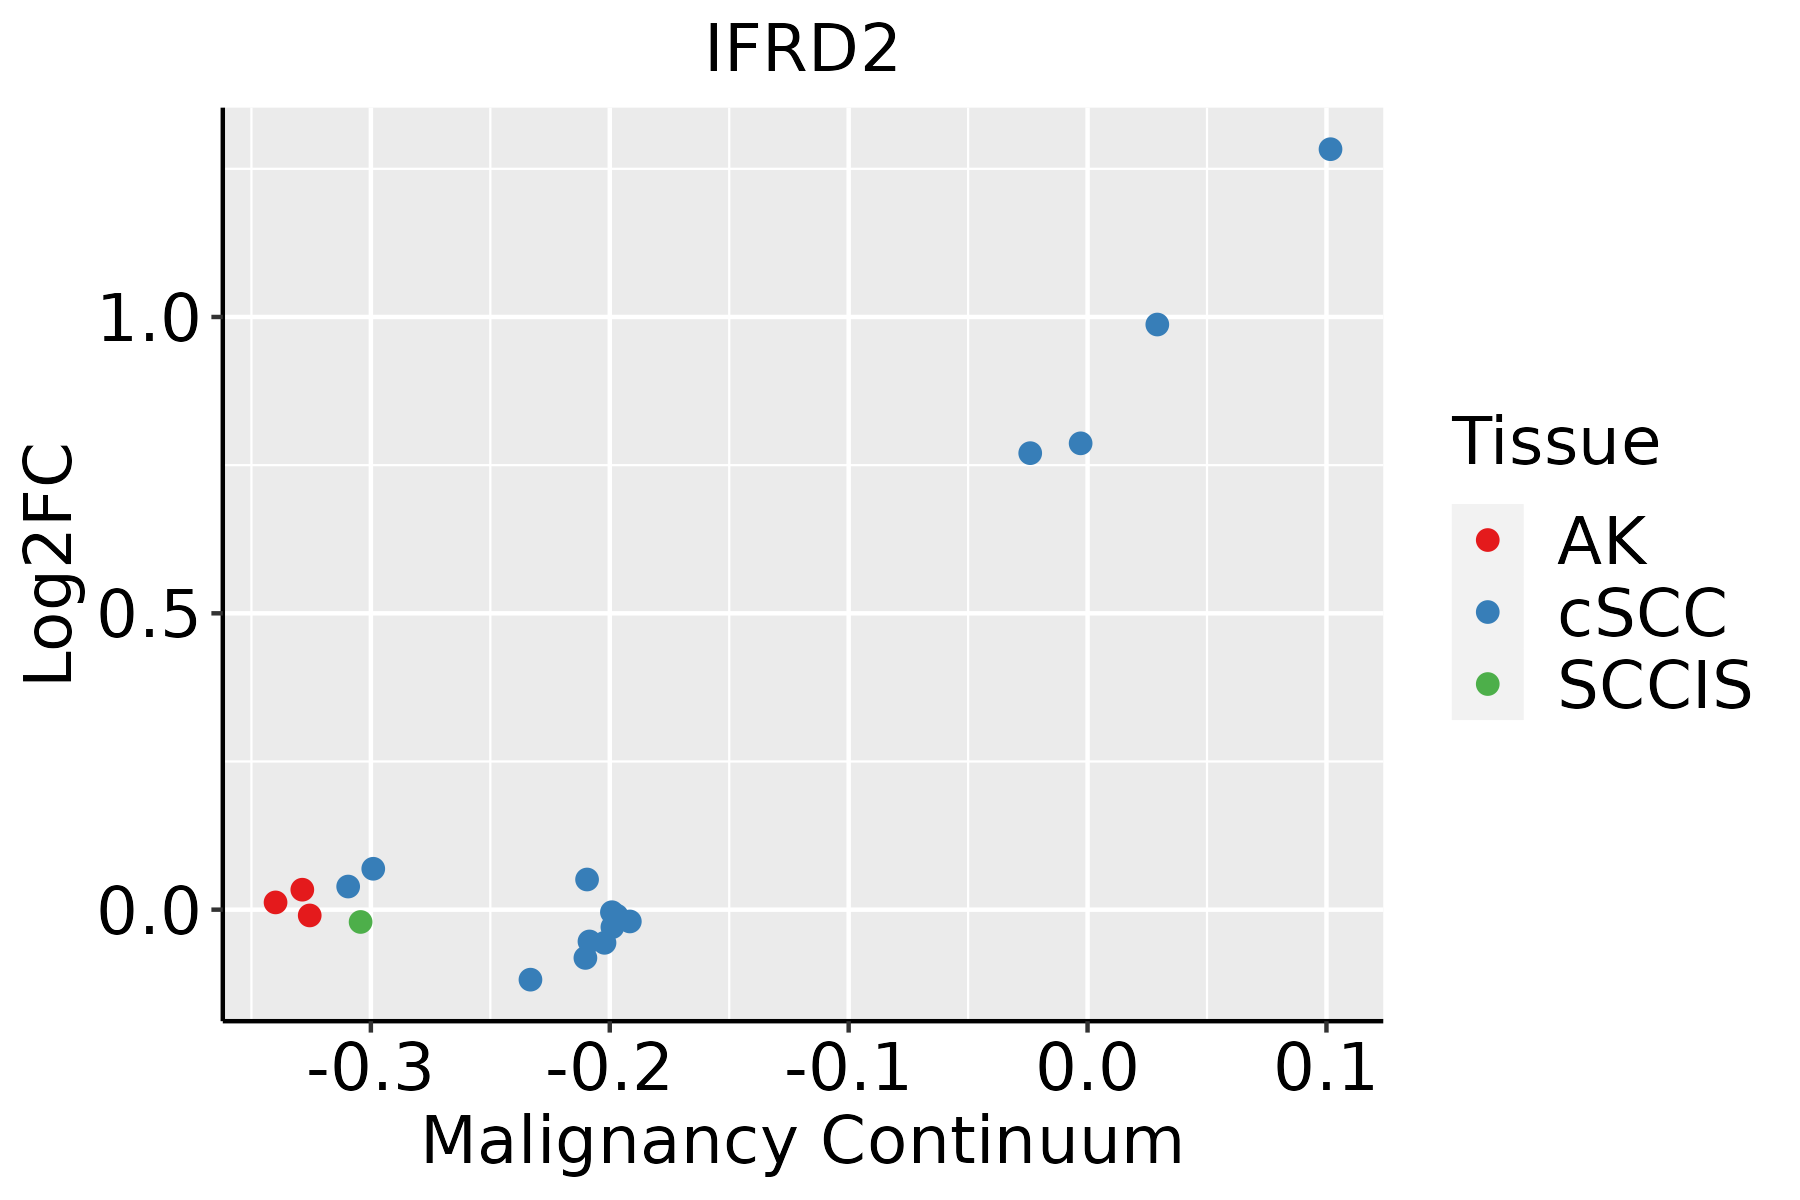 | AK: Actinic keratosis |
| cSCC: Cutaneous squamous cell carcinoma | ||
| SCCIS:squamous cell carcinoma in situ | ||
| Thyroid | 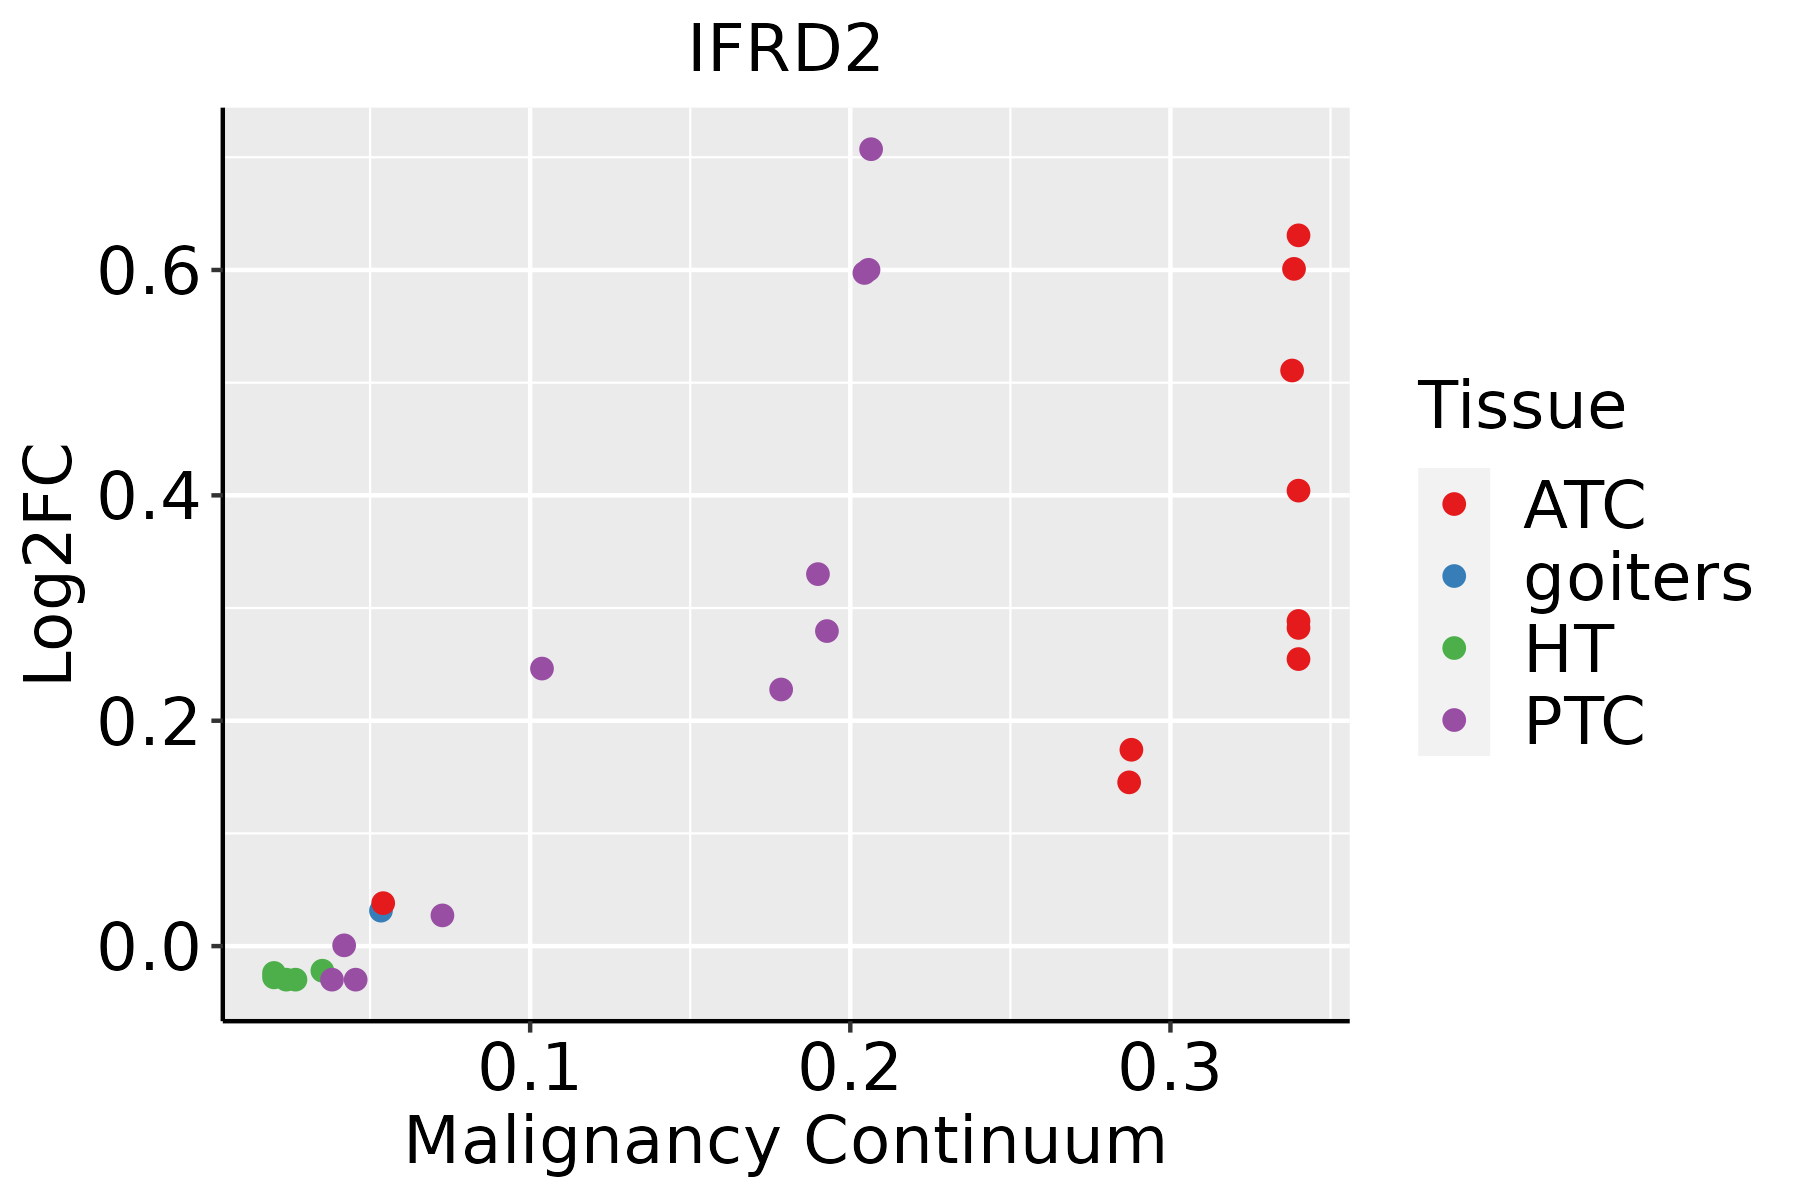 | ATC: Anaplastic thyroid cancer |
| HT: Hashimoto's thyroiditis | ||
| PTC: Papillary thyroid cancer |
| ∗log2FC in expression of this searched gene in stem-like cells from each diseased tissue sample relative to stem-like cells in normal samples in each tissue plotted against the malignancy continuum. Samples are colored based on if they are from different disease stage. |
Top |
Malignant transformation related pathway analysis |
| Find out the enriched GO biological processes and KEGG pathways involved in transition from healthy to precancer to cancer |
| Tissue | Disease Stage | Enriched GO biological Processes |
| Colorectum | AD |  |
| Colorectum | SER |  |
| Colorectum | MSS |  |
| Colorectum | MSI-H |  |
| Colorectum | FAP |  |
| ∗Top 15 enriched GO BP terms are showed in the bar plot of each disease state in each tissue. Each row represents a significant GO biological process which is colored according to the -log10(p.adjust). |
| Page: 1 2 3 4 5 6 7 8 9 |
| GO ID | Tissue | Disease Stage | Description | Gene Ratio | Bg Ratio | pvalue | p.adjust | Count |
| Page: 1 |
| Pathway ID | Tissue | Disease Stage | Description | Gene Ratio | Bg Ratio | pvalue | p.adjust | qvalue | Count |
| Page: 1 |
Top |
Cell-cell communication analysis |
| Identification of potential cell-cell interactions between two cell types and their ligand-receptor pairs for different disease states |
| Ligand | Receptor | LRpair | Pathway | Tissue | Disease Stage |
| Page: 1 |
Top |
Single-cell gene regulatory network inference analysis |
| Find out the significant the regulons (TFs) and the target genes of each regulon across cell types for different disease states |
| TF | Cell Type | Tissue | Disease Stage | Target Gene | RSS | Regulon Activity |
| ∗The dot plots of a searched regulon are shown for all cell subpopulations in each disease state of each tissue based on the regulon specific score inferred using pySCENIC and by calculating the average expression. |
| Page: 1 |
Top |
Somatic mutation of malignant transformation related genes |
| Annotation of somatic variants for genes involved in malignant transformation |
| Hugo Symbol | Variant Class | Variant Classification | dbSNP RS | HGVSc | HGVSp | HGVSp Short | SWISSPROT | BIOTYPE | SIFT | PolyPhen | Tumor Sample Barcode | Tissue | Histology | Sex | Age | Stage | Therapy Types | Drugs | Outcome |
| IFRD2 | SNV | Missense_Mutation | c.760N>T | p.Gly254Cys | p.G254C | Q12894 | protein_coding | tolerated(1) | benign(0.023) | TCGA-D8-A1XA-01 | Breast | breast invasive carcinoma | Female | <65 | I/II | Unknown | Unknown | SD | |
| IFRD2 | SNV | Missense_Mutation | rs374366991 | c.1198N>A | p.Val400Met | p.V400M | Q12894 | protein_coding | deleterious(0) | probably_damaging(0.999) | TCGA-E9-A1NA-01 | Breast | breast invasive carcinoma | Female | <65 | I/II | Chemotherapy | cyclophosphamide | SD |
| IFRD2 | SNV | Missense_Mutation | rs782492356 | c.1174C>T | p.Arg392Cys | p.R392C | Q12894 | protein_coding | deleterious(0) | probably_damaging(0.959) | TCGA-2W-A8YY-01 | Cervix | cervical & endocervical cancer | Female | <65 | I/II | Chemotherapy | cisplatin | CR |
| IFRD2 | SNV | Missense_Mutation | c.1036N>A | p.Glu346Lys | p.E346K | Q12894 | protein_coding | deleterious(0) | probably_damaging(0.996) | TCGA-4J-AA1J-01 | Cervix | cervical & endocervical cancer | Female | <65 | I/II | Unknown | Unknown | SD | |
| IFRD2 | SNV | Missense_Mutation | c.1255G>C | p.Glu419Gln | p.E419Q | Q12894 | protein_coding | deleterious(0) | probably_damaging(0.994) | TCGA-Q1-A73O-01 | Cervix | cervical & endocervical cancer | Female | <65 | I/II | Chemotherapy | cisplatin | CR | |
| IFRD2 | SNV | Missense_Mutation | novel | c.386N>G | p.Asp129Gly | p.D129G | Q12894 | protein_coding | deleterious(0.01) | possibly_damaging(0.589) | TCGA-A6-5665-01 | Colorectum | colon adenocarcinoma | Female | >=65 | I/II | Unknown | Unknown | PD |
| IFRD2 | SNV | Missense_Mutation | rs782161246 | c.1361G>A | p.Arg454His | p.R454H | Q12894 | protein_coding | deleterious(0) | probably_damaging(0.999) | TCGA-AA-3678-01 | Colorectum | colon adenocarcinoma | Female | <65 | III/IV | Chemotherapy | folinic | CR |
| IFRD2 | SNV | Missense_Mutation | rs369995042 | c.1484N>A | p.Arg495Gln | p.R495Q | Q12894 | protein_coding | deleterious(0) | probably_damaging(0.998) | TCGA-AA-3947-01 | Colorectum | colon adenocarcinoma | Female | <65 | I/II | Unknown | Unknown | SD |
| IFRD2 | SNV | Missense_Mutation | novel | c.580N>T | p.Gly194Trp | p.G194W | Q12894 | protein_coding | deleterious(0) | probably_damaging(0.999) | TCGA-AA-3947-01 | Colorectum | colon adenocarcinoma | Female | <65 | I/II | Unknown | Unknown | SD |
| IFRD2 | SNV | Missense_Mutation | c.1426N>T | p.Pro476Ser | p.P476S | Q12894 | protein_coding | tolerated(1) | benign(0) | TCGA-AA-A01D-01 | Colorectum | colon adenocarcinoma | Female | <65 | III/IV | Chemotherapy | capecitabine | PD |
| Page: 1 2 3 4 5 |
Top |
Related drugs of malignant transformation related genes |
| Identification of chemicals and drugs interact with genes involved in malignant transfromation |
| (DGIdb 4.0) |
| Entrez ID | Symbol | Category | Interaction Types | Drug Claim Name | Drug Name | PMIDs |
| Page: 1 |

Copyright 2023-Present -The University of Texas Health Science Center at Houston |