
|
|||||
|
 | |
| |
| |
| |
| |
| |
|
Gene: IFIT3 |
Gene summary for IFIT3 |
| Gene information | Species | Human | Gene symbol | IFIT3 | Gene ID | 3437 |
| Gene name | interferon induced protein with tetratricopeptide repeats 3 | |
| Gene Alias | CIG-49 | |
| Cytomap | 10q23.31 | |
| Gene Type | protein-coding | GO ID | GO:0002376 | UniProtAcc | O14879 |
Top |
Malignant transformation analysis |
| Identification of the aberrant gene expression in precancerous and cancerous lesions by comparing the gene expression of stem-like cells in diseased tissues with normal stem cells |
| Entrez ID | Symbol | Replicates | Species | Organ | Tissue | Adj P-value | Log2FC | Malignancy |
| 3437 | IFIT3 | P75T-E | Human | Esophagus | ESCC | 3.79e-59 | 1.64e+00 | 0.1125 |
| 3437 | IFIT3 | P79T-E | Human | Esophagus | ESCC | 3.36e-12 | 5.95e-01 | 0.1154 |
| 3437 | IFIT3 | P80T-E | Human | Esophagus | ESCC | 1.19e-71 | 2.28e+00 | 0.155 |
| 3437 | IFIT3 | P82T-E | Human | Esophagus | ESCC | 3.66e-15 | 1.75e+00 | 0.1072 |
| 3437 | IFIT3 | P83T-E | Human | Esophagus | ESCC | 9.45e-30 | 1.57e+00 | 0.1738 |
| 3437 | IFIT3 | P89T-E | Human | Esophagus | ESCC | 2.65e-30 | 3.12e+00 | 0.1752 |
| 3437 | IFIT3 | P91T-E | Human | Esophagus | ESCC | 1.11e-25 | 2.78e+00 | 0.1828 |
| 3437 | IFIT3 | P107T-E | Human | Esophagus | ESCC | 1.15e-53 | 2.61e+00 | 0.171 |
| 3437 | IFIT3 | P128T-E | Human | Esophagus | ESCC | 1.06e-08 | 1.99e+00 | 0.1241 |
| 3437 | IFIT3 | P130T-E | Human | Esophagus | ESCC | 2.28e-19 | 9.85e-01 | 0.1676 |
| 3437 | IFIT3 | HCC1_Meng | Human | Liver | HCC | 5.07e-08 | -8.39e-02 | 0.0246 |
| 3437 | IFIT3 | HCC2_Meng | Human | Liver | HCC | 1.54e-11 | 4.27e-02 | 0.0107 |
| 3437 | IFIT3 | cirrhotic2 | Human | Liver | Cirrhotic | 1.18e-09 | 1.95e-01 | 0.0201 |
| 3437 | IFIT3 | HCC1 | Human | Liver | HCC | 5.12e-25 | 3.10e+00 | 0.5336 |
| 3437 | IFIT3 | HCC2 | Human | Liver | HCC | 7.58e-48 | 4.34e+00 | 0.5341 |
| 3437 | IFIT3 | HCC5 | Human | Liver | HCC | 1.00e-66 | 3.66e+00 | 0.4932 |
| 3437 | IFIT3 | Pt13.b | Human | Liver | HCC | 1.44e-08 | 1.27e-01 | 0.0251 |
| 3437 | IFIT3 | S027 | Human | Liver | HCC | 4.31e-03 | 1.98e+00 | 0.2446 |
| 3437 | IFIT3 | S028 | Human | Liver | HCC | 5.02e-14 | 1.61e+00 | 0.2503 |
| 3437 | IFIT3 | S029 | Human | Liver | HCC | 3.82e-18 | 2.95e+00 | 0.2581 |
| Page: 1 2 3 4 5 |
| Tissue | Expression Dynamics | Abbreviation |
| Breast | 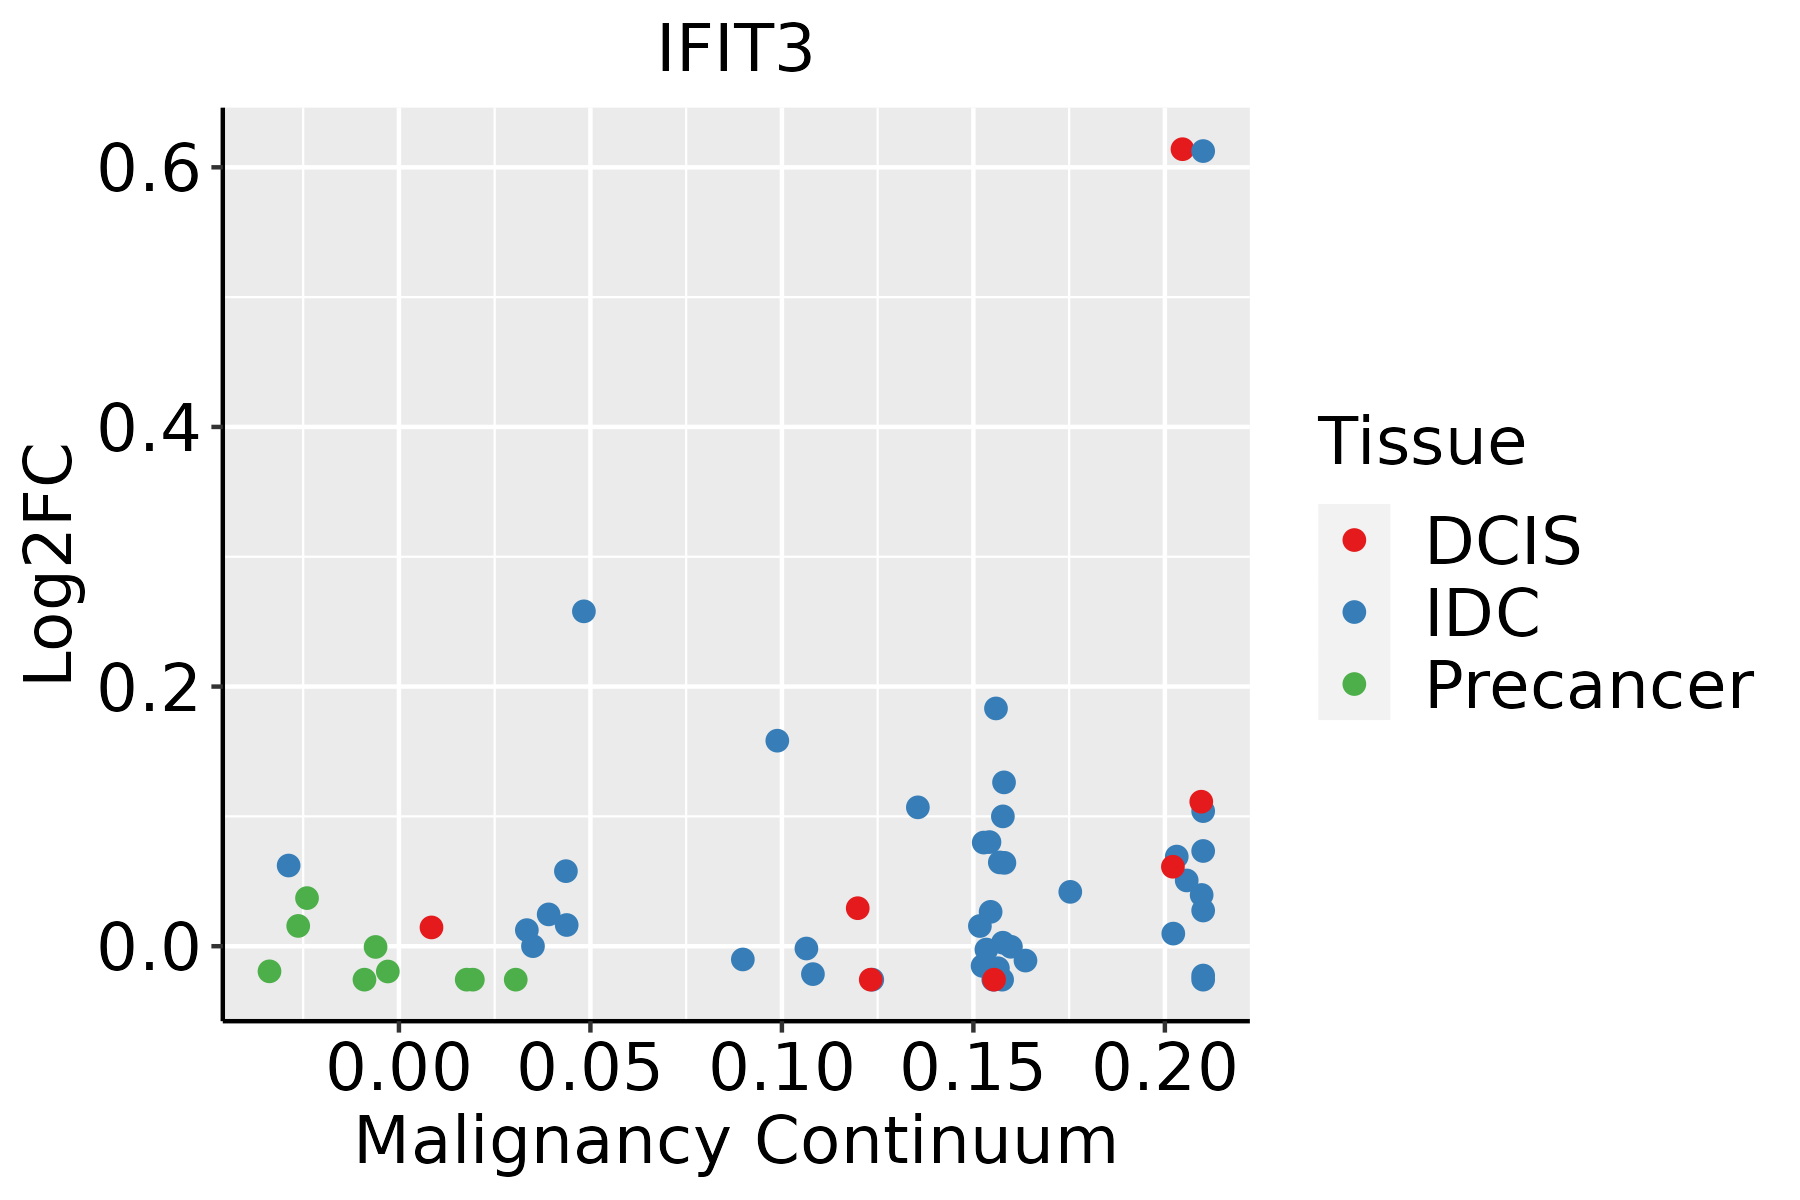 | IDC: Invasive ductal carcinoma |
| DCIS: Ductal carcinoma in situ | ||
| Precancer(BRCA1-mut): Precancerous lesion from BRCA1 mutation carriers | ||
| Colorectum (GSE201348) | 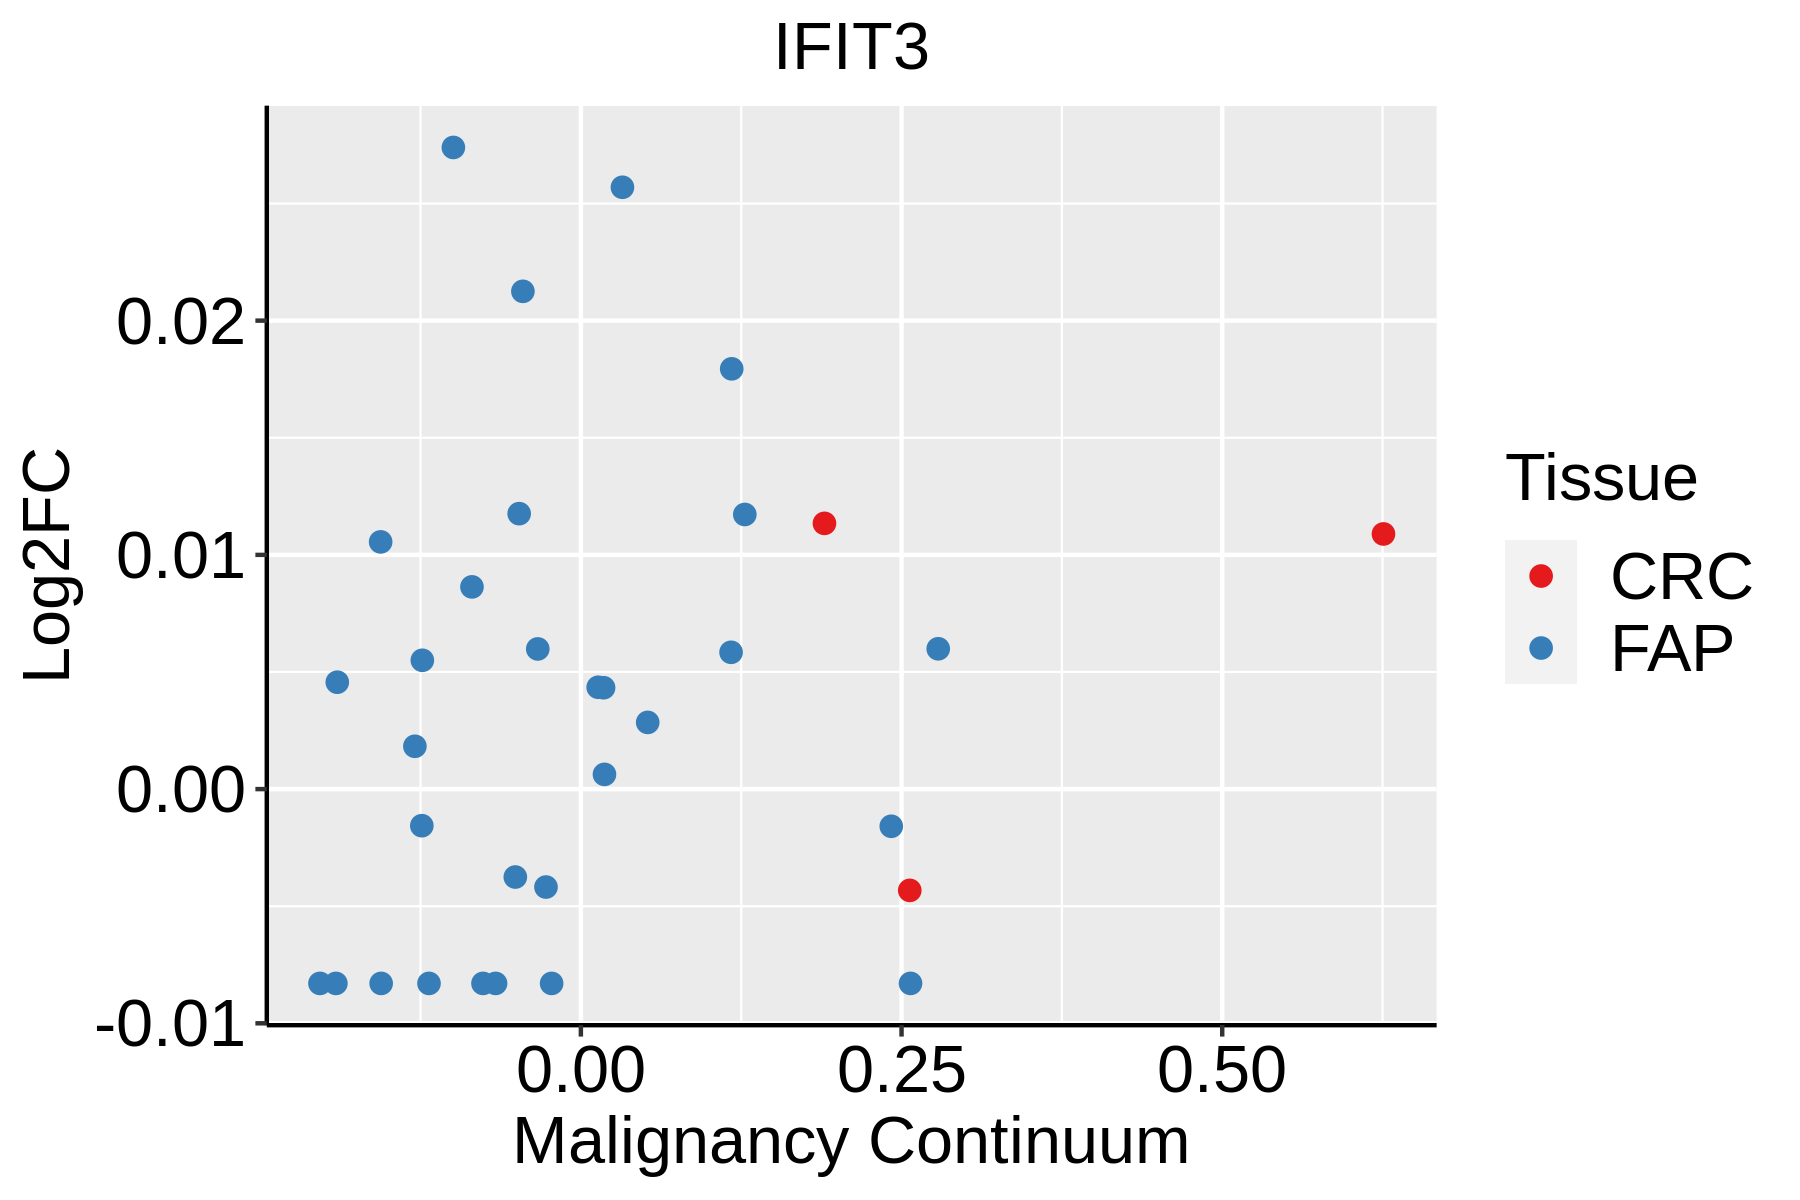 | FAP: Familial adenomatous polyposis |
| CRC: Colorectal cancer | ||
| Colorectum (HTA11) |  | AD: Adenomas |
| SER: Sessile serrated lesions | ||
| MSI-H: Microsatellite-high colorectal cancer | ||
| MSS: Microsatellite stable colorectal cancer | ||
| Esophagus |  | ESCC: Esophageal squamous cell carcinoma |
| HGIN: High-grade intraepithelial neoplasias | ||
| LGIN: Low-grade intraepithelial neoplasias | ||
| Liver | 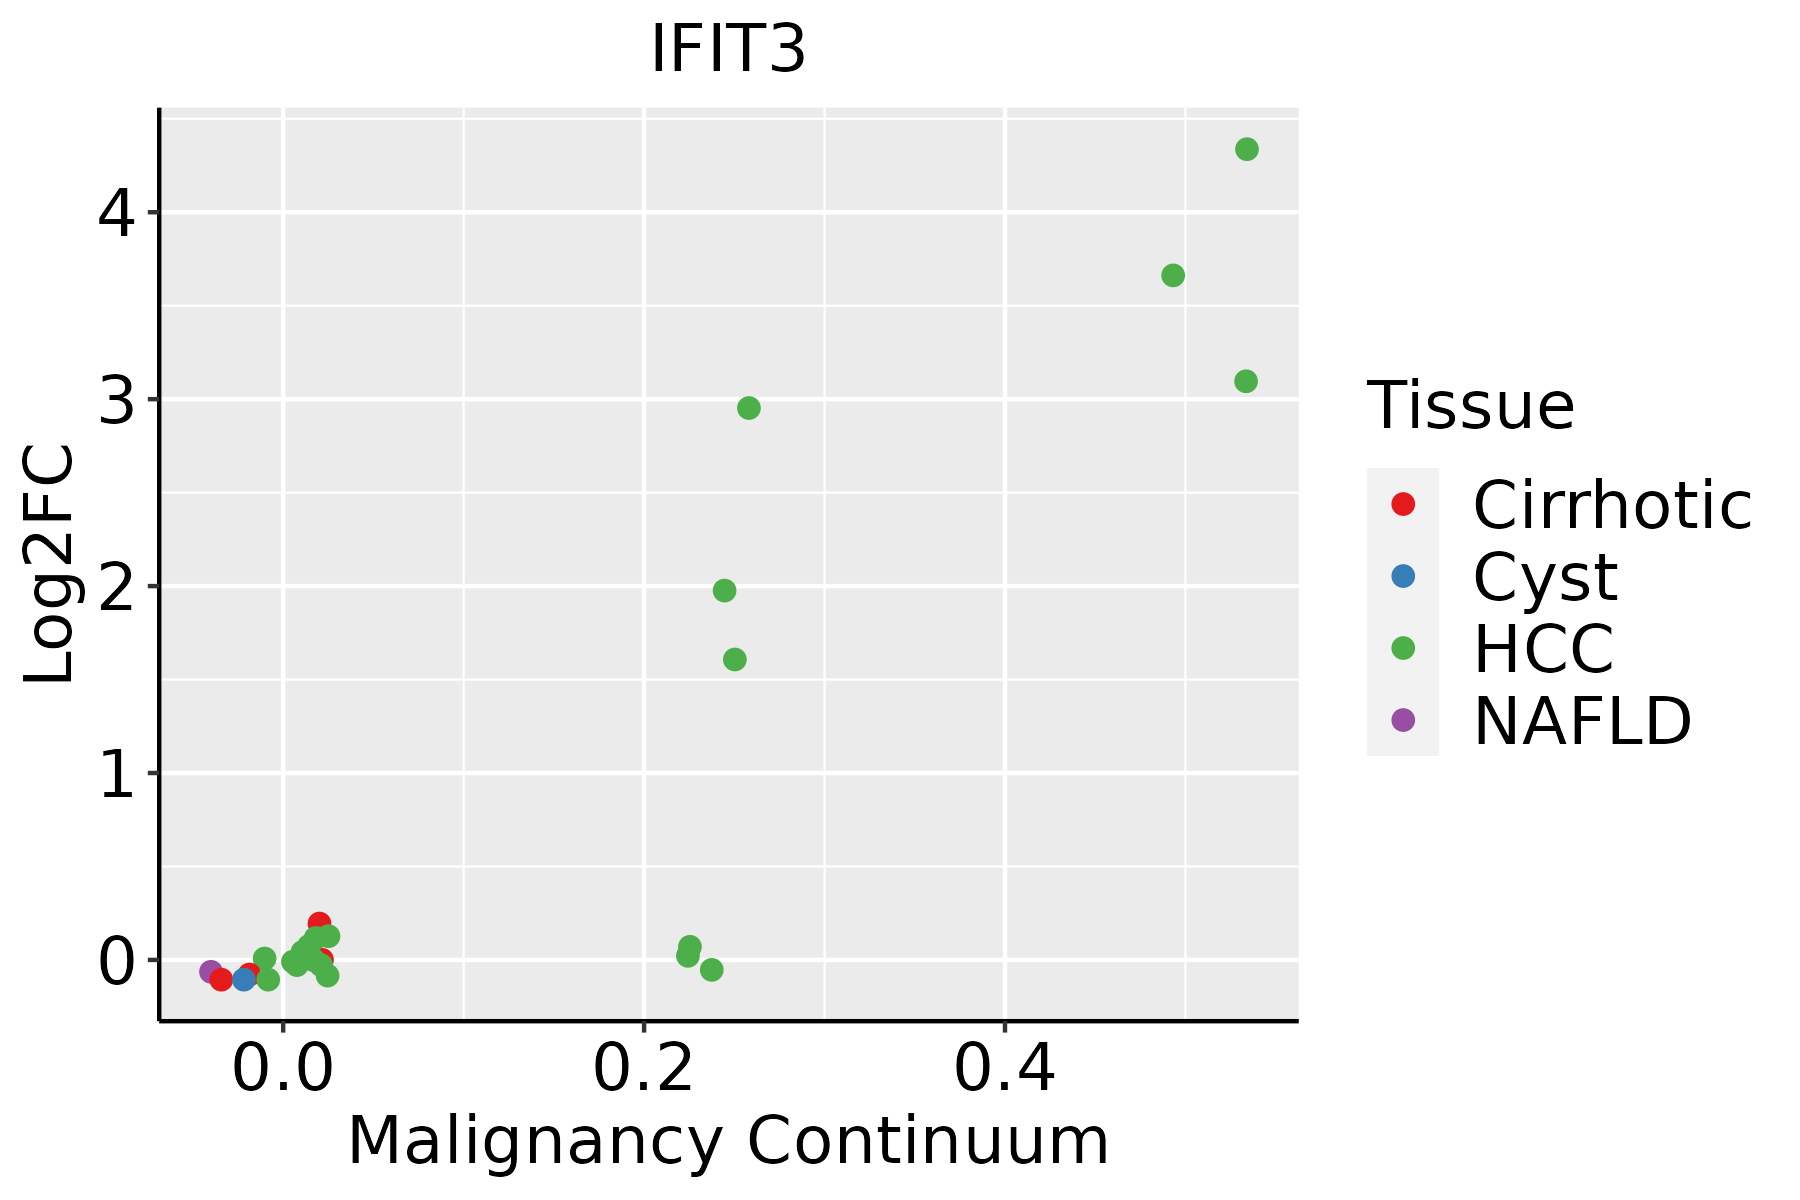 | HCC: Hepatocellular carcinoma |
| NAFLD: Non-alcoholic fatty liver disease | ||
| Oral Cavity | 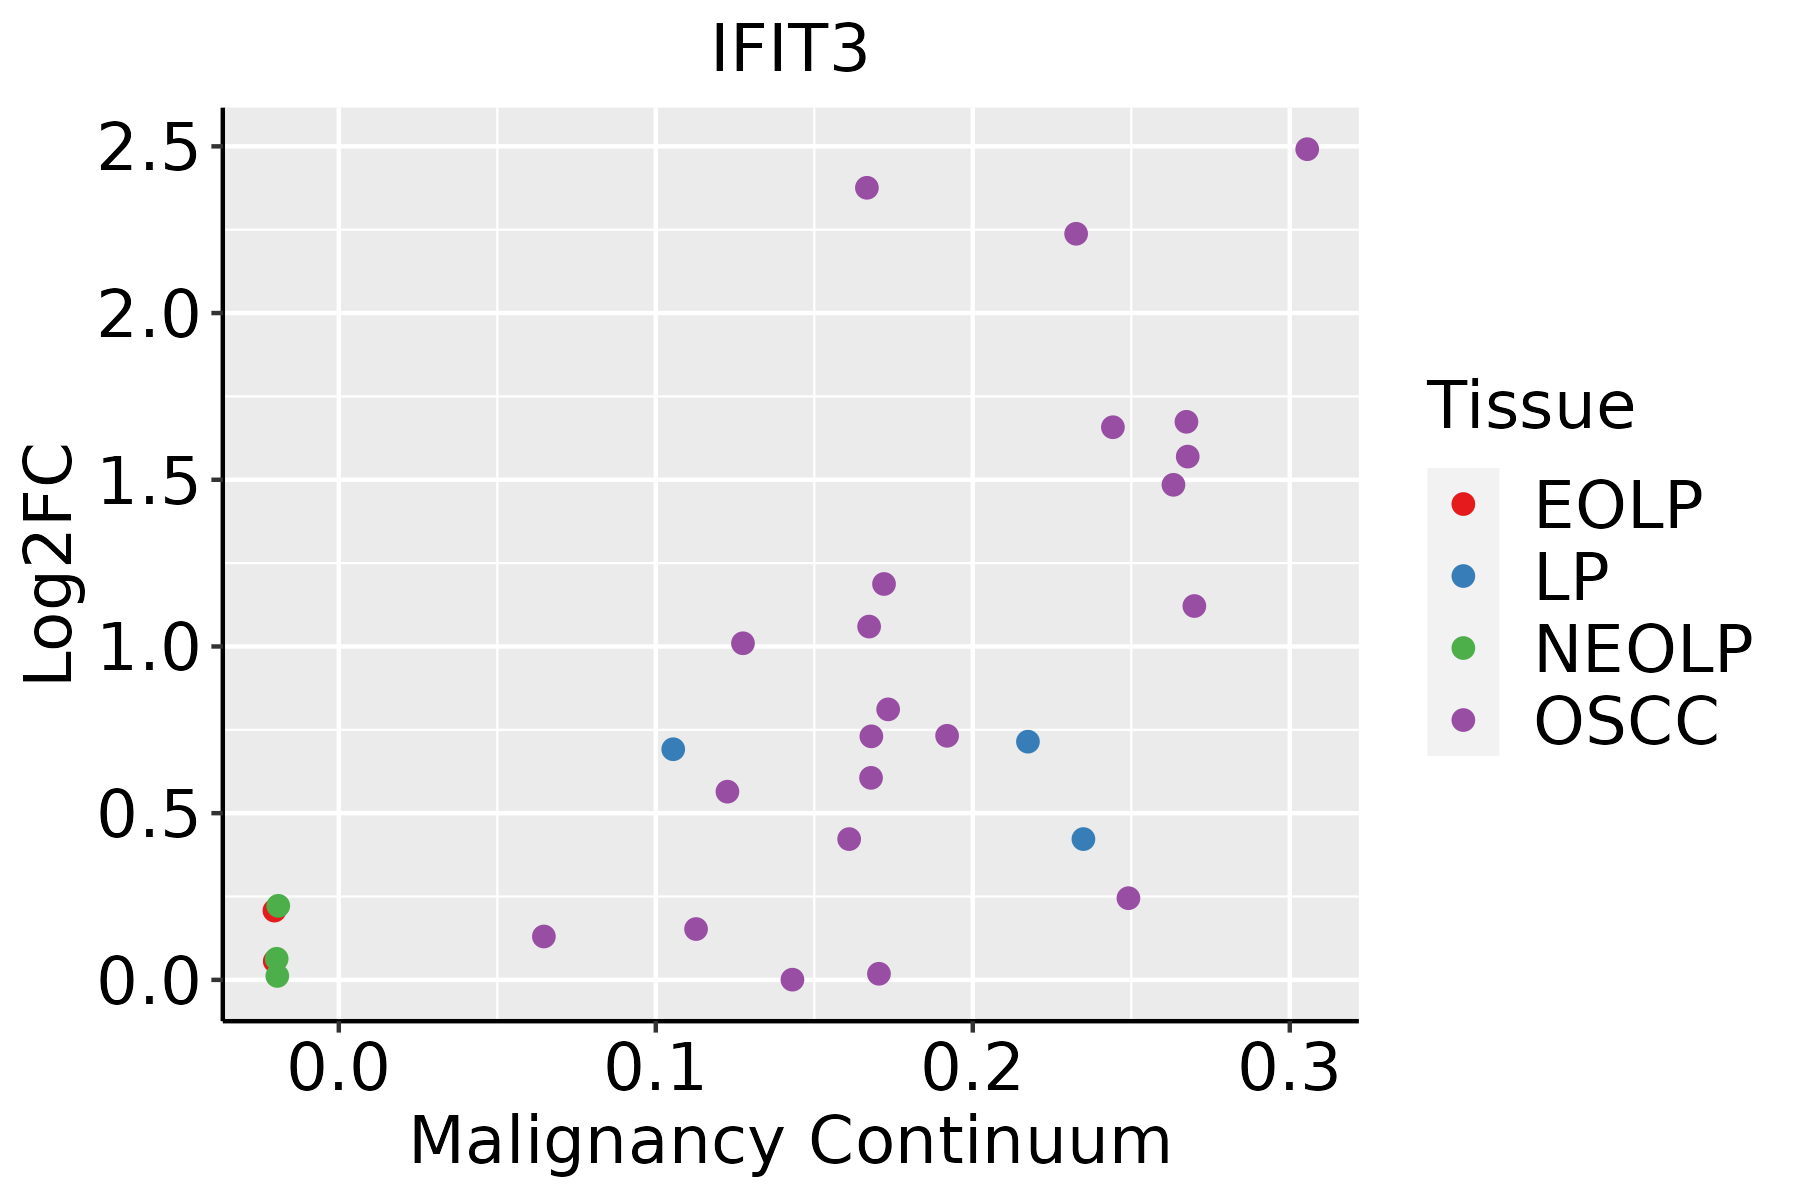 | EOLP: Erosive Oral lichen planus |
| LP: leukoplakia | ||
| NEOLP: Non-erosive oral lichen planus | ||
| OSCC: Oral squamous cell carcinoma | ||
| Skin | 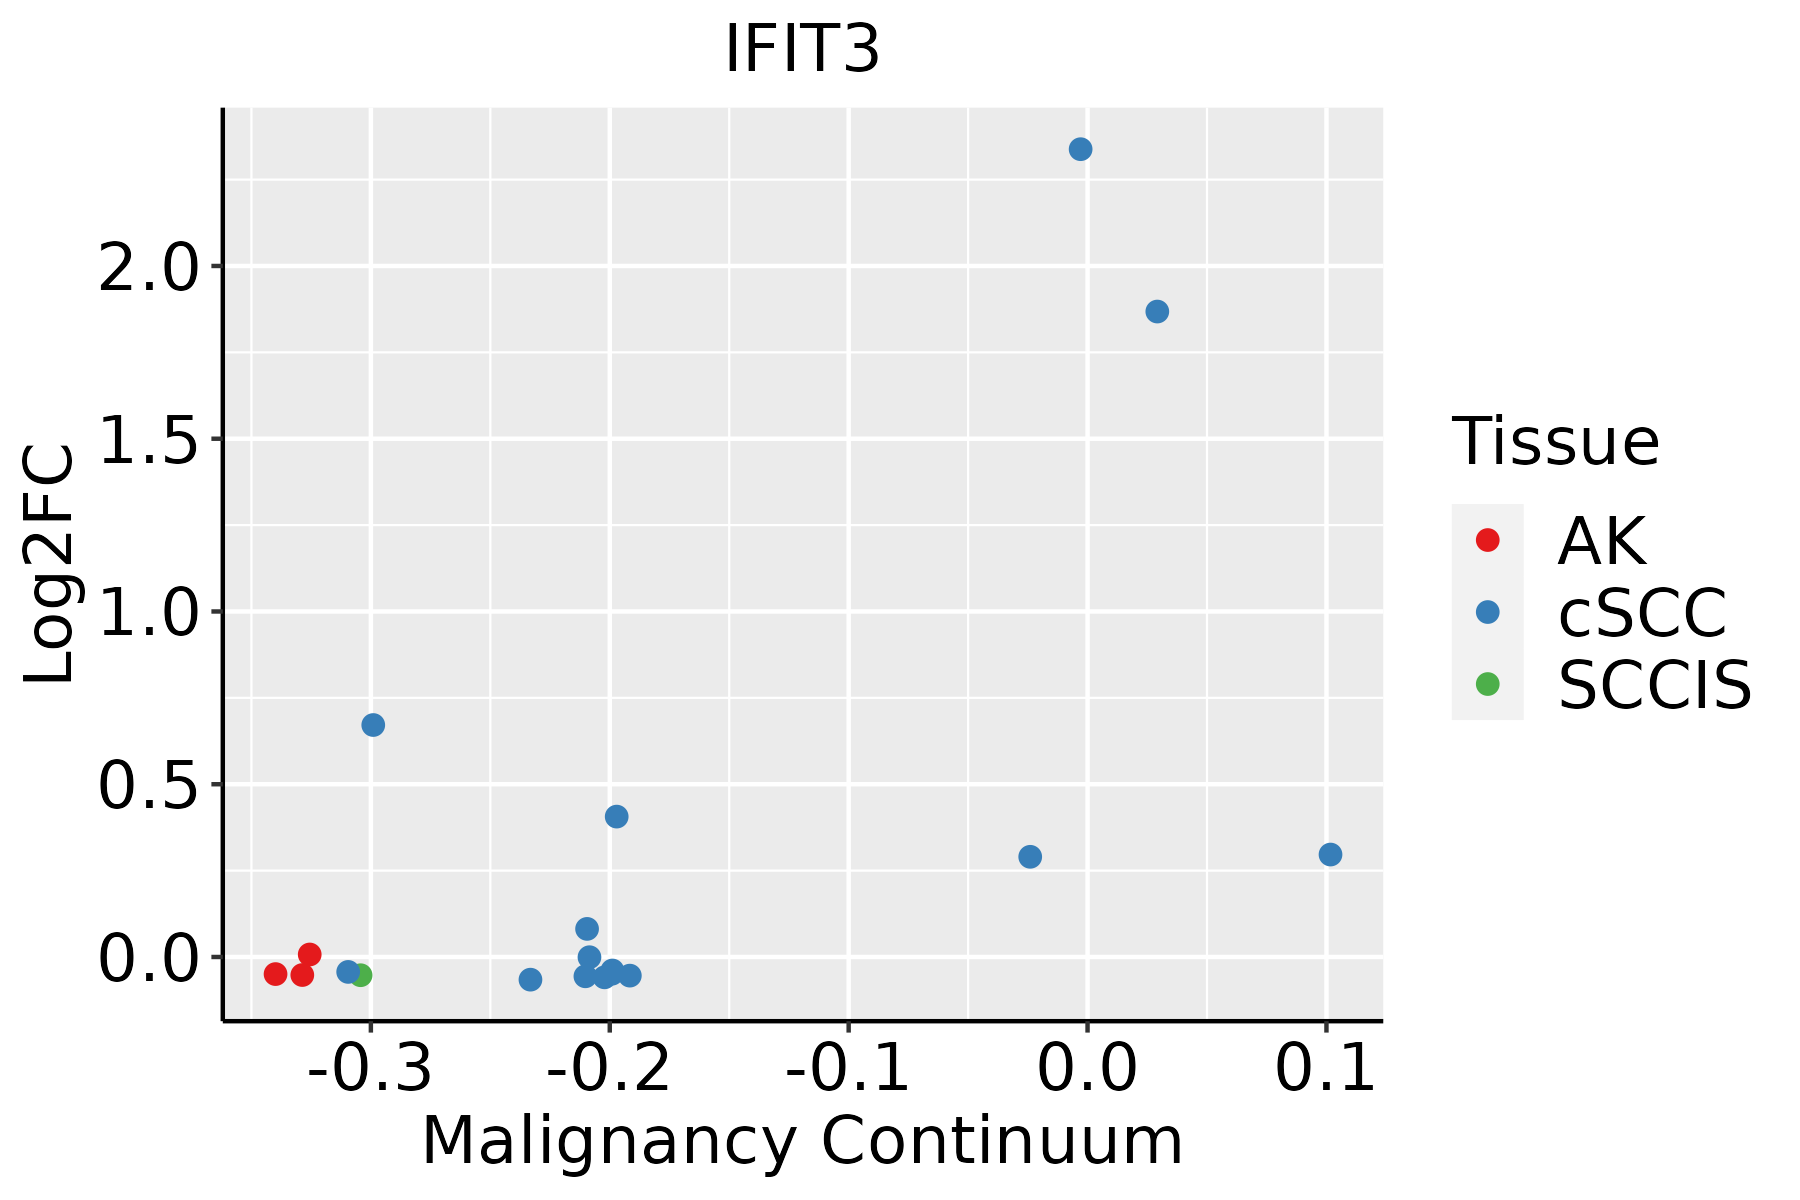 | AK: Actinic keratosis |
| cSCC: Cutaneous squamous cell carcinoma | ||
| SCCIS:squamous cell carcinoma in situ | ||
| Thyroid | 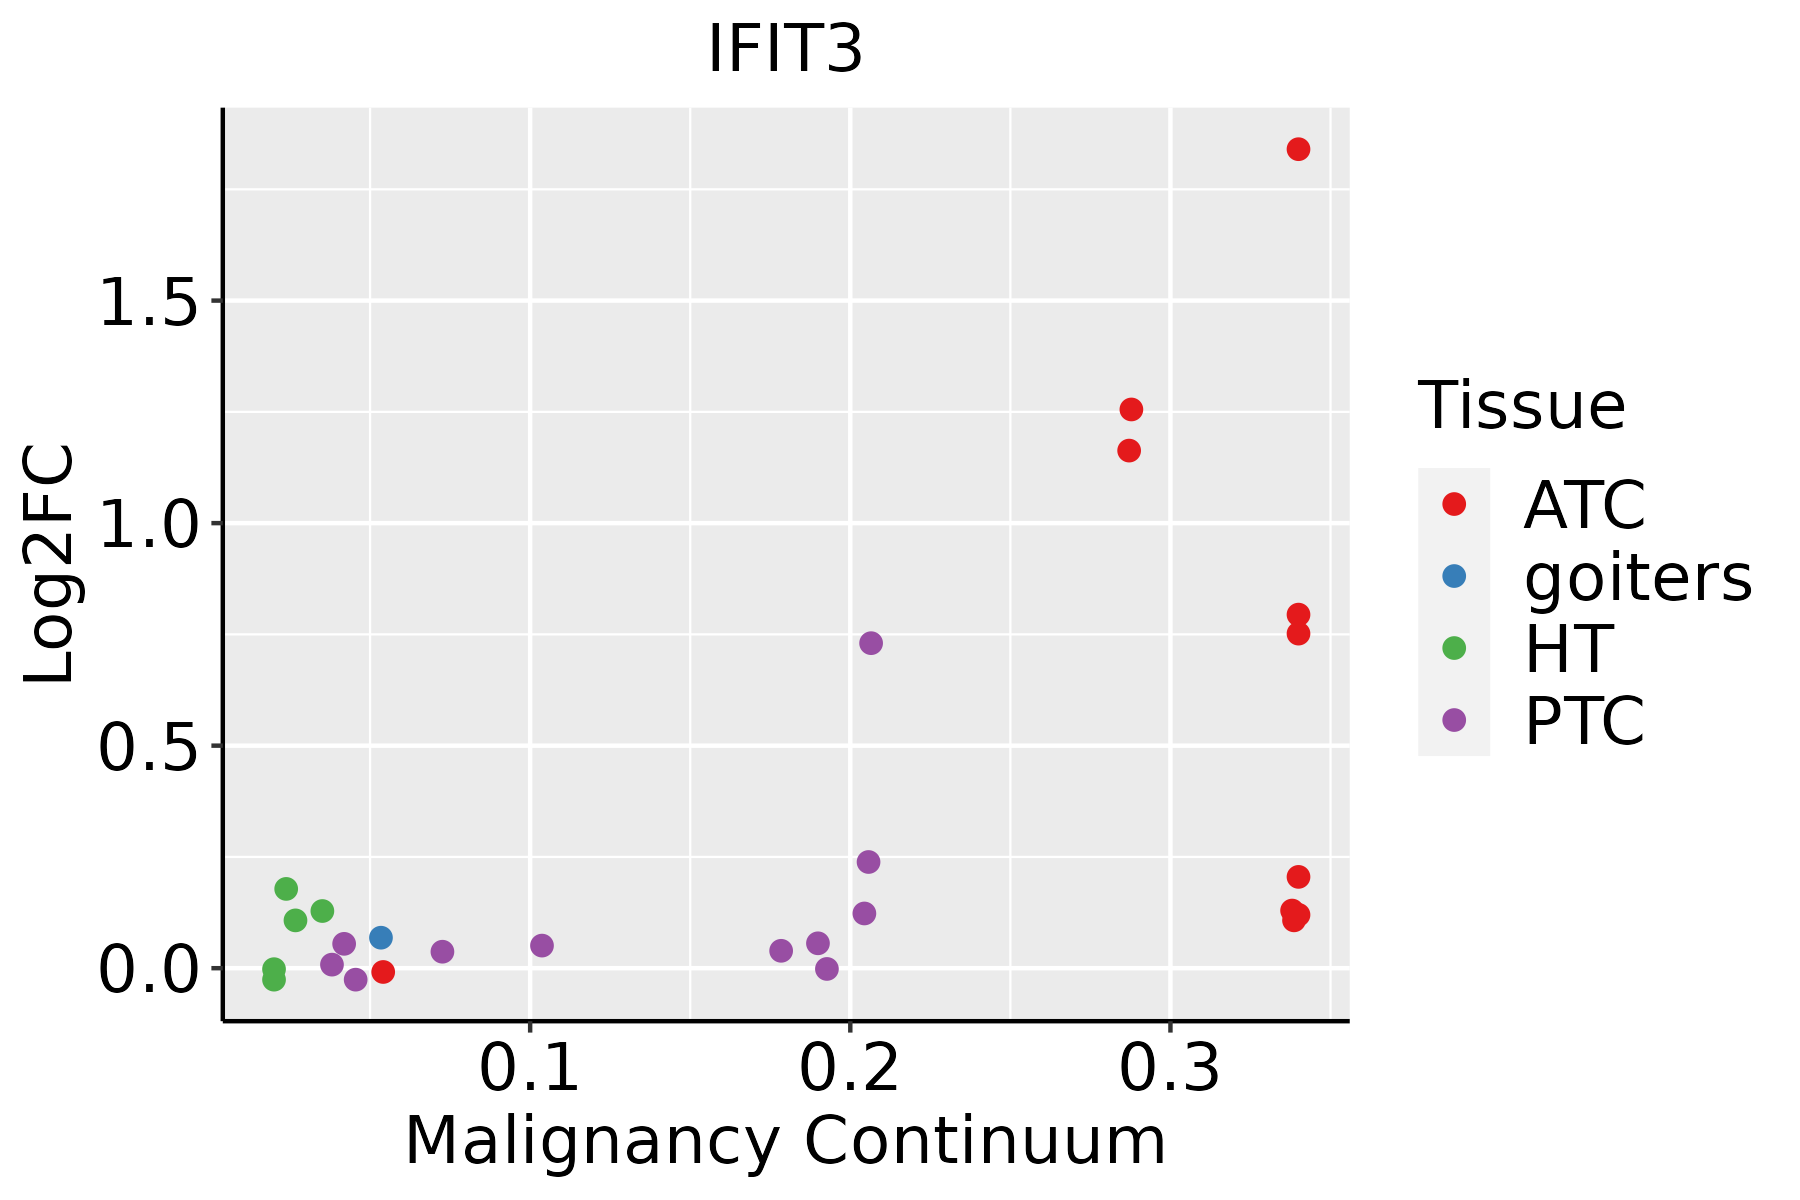 | ATC: Anaplastic thyroid cancer |
| HT: Hashimoto's thyroiditis | ||
| PTC: Papillary thyroid cancer |
| ∗log2FC in expression of this searched gene in stem-like cells from each diseased tissue sample relative to stem-like cells in normal samples in each tissue plotted against the malignancy continuum. Samples are colored based on if they are from different disease stage. |
Top |
Malignant transformation related pathway analysis |
| Find out the enriched GO biological processes and KEGG pathways involved in transition from healthy to precancer to cancer |
| Tissue | Disease Stage | Enriched GO biological Processes |
| Colorectum | AD |  |
| Colorectum | SER |  |
| Colorectum | MSS |  |
| Colorectum | MSI-H |  |
| Colorectum | FAP |  |
| ∗Top 15 enriched GO BP terms are showed in the bar plot of each disease state in each tissue. Each row represents a significant GO biological process which is colored according to the -log10(p.adjust). |
| Page: 1 2 3 4 5 6 7 8 9 |
| GO ID | Tissue | Disease Stage | Description | Gene Ratio | Bg Ratio | pvalue | p.adjust | Count |
| GO:00096157 | Breast | IDC | response to virus | 47/1434 | 367/18723 | 3.53e-04 | 5.16e-03 | 47 |
| GO:00354552 | Breast | IDC | response to interferon-alpha | 7/1434 | 21/18723 | 6.80e-04 | 8.36e-03 | 7 |
| GO:000961512 | Breast | DCIS | response to virus | 45/1390 | 367/18723 | 6.16e-04 | 7.82e-03 | 45 |
| GO:003545511 | Breast | DCIS | response to interferon-alpha | 6/1390 | 21/18723 | 3.40e-03 | 2.85e-02 | 6 |
| GO:0009615 | Colorectum | MSI-H | response to virus | 40/1319 | 367/18723 | 3.99e-03 | 4.61e-02 | 40 |
| GO:000961518 | Esophagus | ESCC | response to virus | 238/8552 | 367/18723 | 6.65e-14 | 3.32e-12 | 238 |
| GO:00516075 | Esophagus | ESCC | defense response to virus | 171/8552 | 265/18723 | 3.91e-10 | 1.05e-08 | 171 |
| GO:01405465 | Esophagus | ESCC | defense response to symbiont | 171/8552 | 265/18723 | 3.91e-10 | 1.05e-08 | 171 |
| GO:00354555 | Esophagus | ESCC | response to interferon-alpha | 17/8552 | 21/18723 | 1.03e-03 | 5.19e-03 | 17 |
| GO:00096155 | Liver | Cirrhotic | response to virus | 126/4634 | 367/18723 | 2.10e-05 | 2.77e-04 | 126 |
| GO:0035455 | Liver | Cirrhotic | response to interferon-alpha | 11/4634 | 21/18723 | 5.89e-03 | 2.95e-02 | 11 |
| GO:0051607 | Liver | Cirrhotic | defense response to virus | 84/4634 | 265/18723 | 6.02e-03 | 3.00e-02 | 84 |
| GO:0140546 | Liver | Cirrhotic | defense response to symbiont | 84/4634 | 265/18723 | 6.02e-03 | 3.00e-02 | 84 |
| GO:000961511 | Liver | HCC | response to virus | 210/7958 | 367/18723 | 7.32e-09 | 1.86e-07 | 210 |
| GO:00516071 | Liver | HCC | defense response to virus | 151/7958 | 265/18723 | 1.27e-06 | 1.85e-05 | 151 |
| GO:01405461 | Liver | HCC | defense response to symbiont | 151/7958 | 265/18723 | 1.27e-06 | 1.85e-05 | 151 |
| GO:000961515 | Oral cavity | OSCC | response to virus | 215/7305 | 367/18723 | 1.63e-14 | 9.41e-13 | 215 |
| GO:00516074 | Oral cavity | OSCC | defense response to virus | 154/7305 | 265/18723 | 1.96e-10 | 5.63e-09 | 154 |
| GO:01405464 | Oral cavity | OSCC | defense response to symbiont | 154/7305 | 265/18723 | 1.96e-10 | 5.63e-09 | 154 |
| GO:00354554 | Oral cavity | OSCC | response to interferon-alpha | 16/7305 | 21/18723 | 5.99e-04 | 3.39e-03 | 16 |
| Page: 1 2 |
| Pathway ID | Tissue | Disease Stage | Description | Gene Ratio | Bg Ratio | pvalue | p.adjust | qvalue | Count |
| Page: 1 |
Top |
Cell-cell communication analysis |
| Identification of potential cell-cell interactions between two cell types and their ligand-receptor pairs for different disease states |
| Ligand | Receptor | LRpair | Pathway | Tissue | Disease Stage |
| Page: 1 |
Top |
Single-cell gene regulatory network inference analysis |
| Find out the significant the regulons (TFs) and the target genes of each regulon across cell types for different disease states |
| TF | Cell Type | Tissue | Disease Stage | Target Gene | RSS | Regulon Activity |
| ∗The dot plots of a searched regulon are shown for all cell subpopulations in each disease state of each tissue based on the regulon specific score inferred using pySCENIC and by calculating the average expression. |
| Page: 1 |
Top |
Somatic mutation of malignant transformation related genes |
| Annotation of somatic variants for genes involved in malignant transformation |
| Hugo Symbol | Variant Class | Variant Classification | dbSNP RS | HGVSc | HGVSp | HGVSp Short | SWISSPROT | BIOTYPE | SIFT | PolyPhen | Tumor Sample Barcode | Tissue | Histology | Sex | Age | Stage | Therapy Types | Drugs | Outcome |
| IFIT3 | SNV | Missense_Mutation | novel | c.953N>T | p.Ser318Leu | p.S318L | O14879 | protein_coding | tolerated(1) | benign(0) | TCGA-AN-A046-01 | Breast | breast invasive carcinoma | Female | >=65 | I/II | Unknown | Unknown | SD |
| IFIT3 | SNV | Missense_Mutation | novel | c.562N>C | p.Glu188Gln | p.E188Q | O14879 | protein_coding | tolerated(0.75) | benign(0.005) | TCGA-E2-A2P6-01 | Breast | breast invasive carcinoma | Female | >=65 | I/II | Hormone Therapy | anastrozole | SD |
| IFIT3 | SNV | Missense_Mutation | novel | c.380N>G | p.Phe127Cys | p.F127C | O14879 | protein_coding | deleterious(0) | probably_damaging(0.971) | TCGA-AA-3984-01 | Colorectum | colon adenocarcinoma | Female | <65 | I/II | Unknown | Unknown | SD |
| IFIT3 | SNV | Missense_Mutation | c.1357N>G | p.Ile453Val | p.I453V | O14879 | protein_coding | tolerated(0.23) | benign(0.024) | TCGA-AA-A010-01 | Colorectum | colon adenocarcinoma | Female | <65 | I/II | Chemotherapy | folinic | CR | |
| IFIT3 | SNV | Missense_Mutation | novel | c.1094G>A | p.Cys365Tyr | p.C365Y | O14879 | protein_coding | tolerated(0.06) | possibly_damaging(0.492) | TCGA-AD-5900-01 | Colorectum | colon adenocarcinoma | Male | >=65 | I/II | Unknown | Unknown | SD |
| IFIT3 | SNV | Missense_Mutation | c.95N>T | p.Arg32Met | p.R32M | O14879 | protein_coding | tolerated(0.22) | benign(0.06) | TCGA-AD-6895-01 | Colorectum | colon adenocarcinoma | Male | >=65 | III/IV | Unknown | Unknown | SD | |
| IFIT3 | SNV | Missense_Mutation | novel | c.634N>A | p.Leu212Ile | p.L212I | O14879 | protein_coding | deleterious(0.02) | probably_damaging(0.983) | TCGA-AG-A002-01 | Colorectum | rectum adenocarcinoma | Male | <65 | I/II | Unknown | Unknown | SD |
| IFIT3 | SNV | Missense_Mutation | novel | c.166T>G | p.Leu56Val | p.L56V | O14879 | protein_coding | deleterious(0) | probably_damaging(0.926) | TCGA-F5-6814-01 | Colorectum | rectum adenocarcinoma | Male | <65 | I/II | Unknown | Unknown | SD |
| IFIT3 | insertion | Frame_Shift_Ins | novel | c.1167_1168insA | p.Ser392IlefsTer3 | p.S392Ifs*3 | O14879 | protein_coding | TCGA-D5-6530-01 | Colorectum | colon adenocarcinoma | Male | <65 | I/II | Unknown | Unknown | SD | ||
| IFIT3 | deletion | Frame_Shift_Del | novel | c.1336_1337delCT | p.Leu446LysfsTer16 | p.L446Kfs*16 | O14879 | protein_coding | TCGA-G4-6299-01 | Colorectum | colon adenocarcinoma | Male | >=65 | III/IV | Ancillary | leucovorin | SD |
| Page: 1 2 3 4 5 |
Top |
Related drugs of malignant transformation related genes |
| Identification of chemicals and drugs interact with genes involved in malignant transfromation |
| (DGIdb 4.0) |
| Entrez ID | Symbol | Category | Interaction Types | Drug Claim Name | Drug Name | PMIDs |
| Page: 1 |

Copyright 2023-Present -The University of Texas Health Science Center at Houston |