Schematic overview of the cellular and molecular mechanisms involved in the cancer progression, including the proposed cellular and molecular mechanisms in cancer cells trajectory. AT1: alveolar type 1 cells; AT2: alveolar type 2 cells; AAH: atypical adenomatous hyperplasia; AIS: adenocarcinoma in situ; MIA: minimally invasive adenocarcinoma; IA: invasive adenocarcinoma; EMT: epithelial-mesenchymal transition

Home

Download

Statistics

Help

Contact

Center for Computational Systems Medicine
leaf

Gene summary

leaf

Malignant transformation analysis

leaf

Malignant transformation related pathway analysis

leaf

Cell-cell communication analysis

leaf

Single-cell gene regulatory network inference analysis

leaf

Somatic mutation of malignant transformation related genes

leaf

Related drugs of malignant transformation related genes

Gene: HTATSF1

Gene summary for HTATSF1

check button Gene summary.

Gene informationSpeciesHuman
Gene symbol

HTATSF1

Gene ID

27336

Gene nameHIV-1 Tat specific factor 1
Gene AliasTAT-SF1
CytomapXq26.3
Gene Typeprotein-coding
GO ID

GO:0000375

UniProtAcc

O43719


Top

Malignant transformation analysis

check button Identification of the aberrant gene expression in precancerous and cancerous lesions by comparing the gene expression of stem-like cells in diseased tissues with normal stem cells
check button Malignant transformation involving gene list.
Entrez IDSymbolReplicatesSpeciesOrganTissueAdj P-valueLog2FCMalignancy
27336HTATSF1P44T-EHumanEsophagusESCC1.81e-144.26e-010.1096
27336HTATSF1P47T-EHumanEsophagusESCC4.19e-153.09e-010.1067
27336HTATSF1P48T-EHumanEsophagusESCC3.47e-193.61e-010.0959
27336HTATSF1P49T-EHumanEsophagusESCC3.33e-131.64e+000.1768
27336HTATSF1P52T-EHumanEsophagusESCC1.64e-336.86e-010.1555
27336HTATSF1P54T-EHumanEsophagusESCC1.90e-153.12e-010.0975
27336HTATSF1P56T-EHumanEsophagusESCC6.43e-151.60e+000.1613
27336HTATSF1P57T-EHumanEsophagusESCC2.34e-214.14e-010.0926
27336HTATSF1P61T-EHumanEsophagusESCC2.60e-205.70e-010.099
27336HTATSF1P62T-EHumanEsophagusESCC1.09e-468.25e-010.1302
27336HTATSF1P65T-EHumanEsophagusESCC6.74e-307.06e-010.0978
27336HTATSF1P74T-EHumanEsophagusESCC7.70e-196.25e-010.1479
27336HTATSF1P75T-EHumanEsophagusESCC8.54e-398.09e-010.1125
27336HTATSF1P76T-EHumanEsophagusESCC4.64e-235.29e-010.1207
27336HTATSF1P79T-EHumanEsophagusESCC5.94e-539.67e-010.1154
27336HTATSF1P80T-EHumanEsophagusESCC1.87e-491.52e+000.155
27336HTATSF1P82T-EHumanEsophagusESCC1.45e-148.27e-010.1072
27336HTATSF1P83T-EHumanEsophagusESCC4.04e-277.69e-010.1738
27336HTATSF1P84T-EHumanEsophagusESCC9.31e-149.23e-010.0933
27336HTATSF1P89T-EHumanEsophagusESCC2.69e-111.08e+000.1752
Page: 1 2 3 4 5 6 

check button Transcriptomic changes along malignancy continuum.
TissueExpression DynamicsAbbreviation
EsophagusThe image shows the transcriptomic changes along malignancy continuum.log2FC in expression of this searched gene in stem-like cells from each diseased tissue sample relative to stem-like cells in normal samples in each tissue plotted against the malignancy continuum. Samples are colored based on if they are from different disease stage.
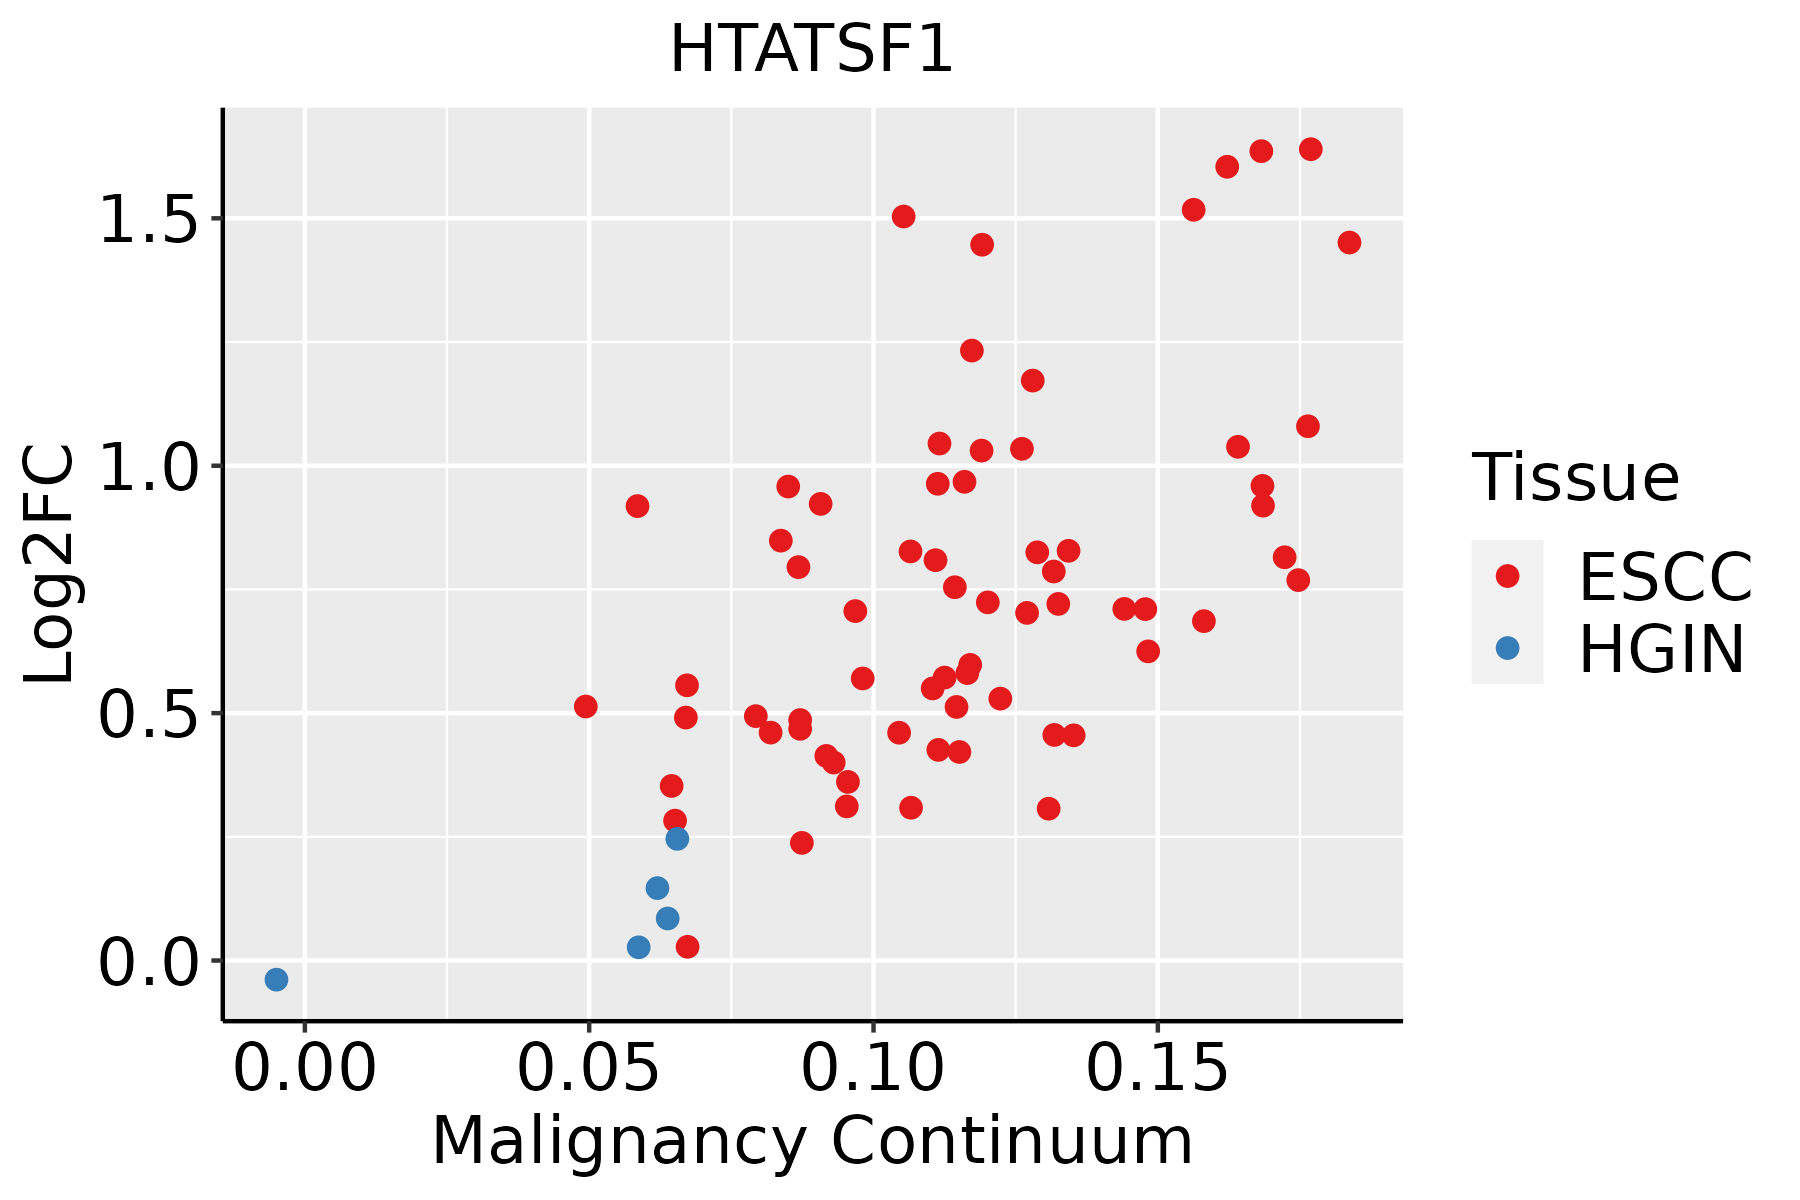
ESCC: Esophageal squamous cell carcinoma
HGIN: High-grade intraepithelial neoplasias
LGIN: Low-grade intraepithelial neoplasias
LiverThe image shows the transcriptomic changes along malignancy continuum.log2FC in expression of this searched gene in stem-like cells from each diseased tissue sample relative to stem-like cells in normal samples in each tissue plotted against the malignancy continuum. Samples are colored based on if they are from different disease stage.HCC: Hepatocellular carcinoma
NAFLD: Non-alcoholic fatty liver disease
Oral CavityThe image shows the transcriptomic changes along malignancy continuum.log2FC in expression of this searched gene in stem-like cells from each diseased tissue sample relative to stem-like cells in normal samples in each tissue plotted against the malignancy continuum. Samples are colored based on if they are from different disease stage.
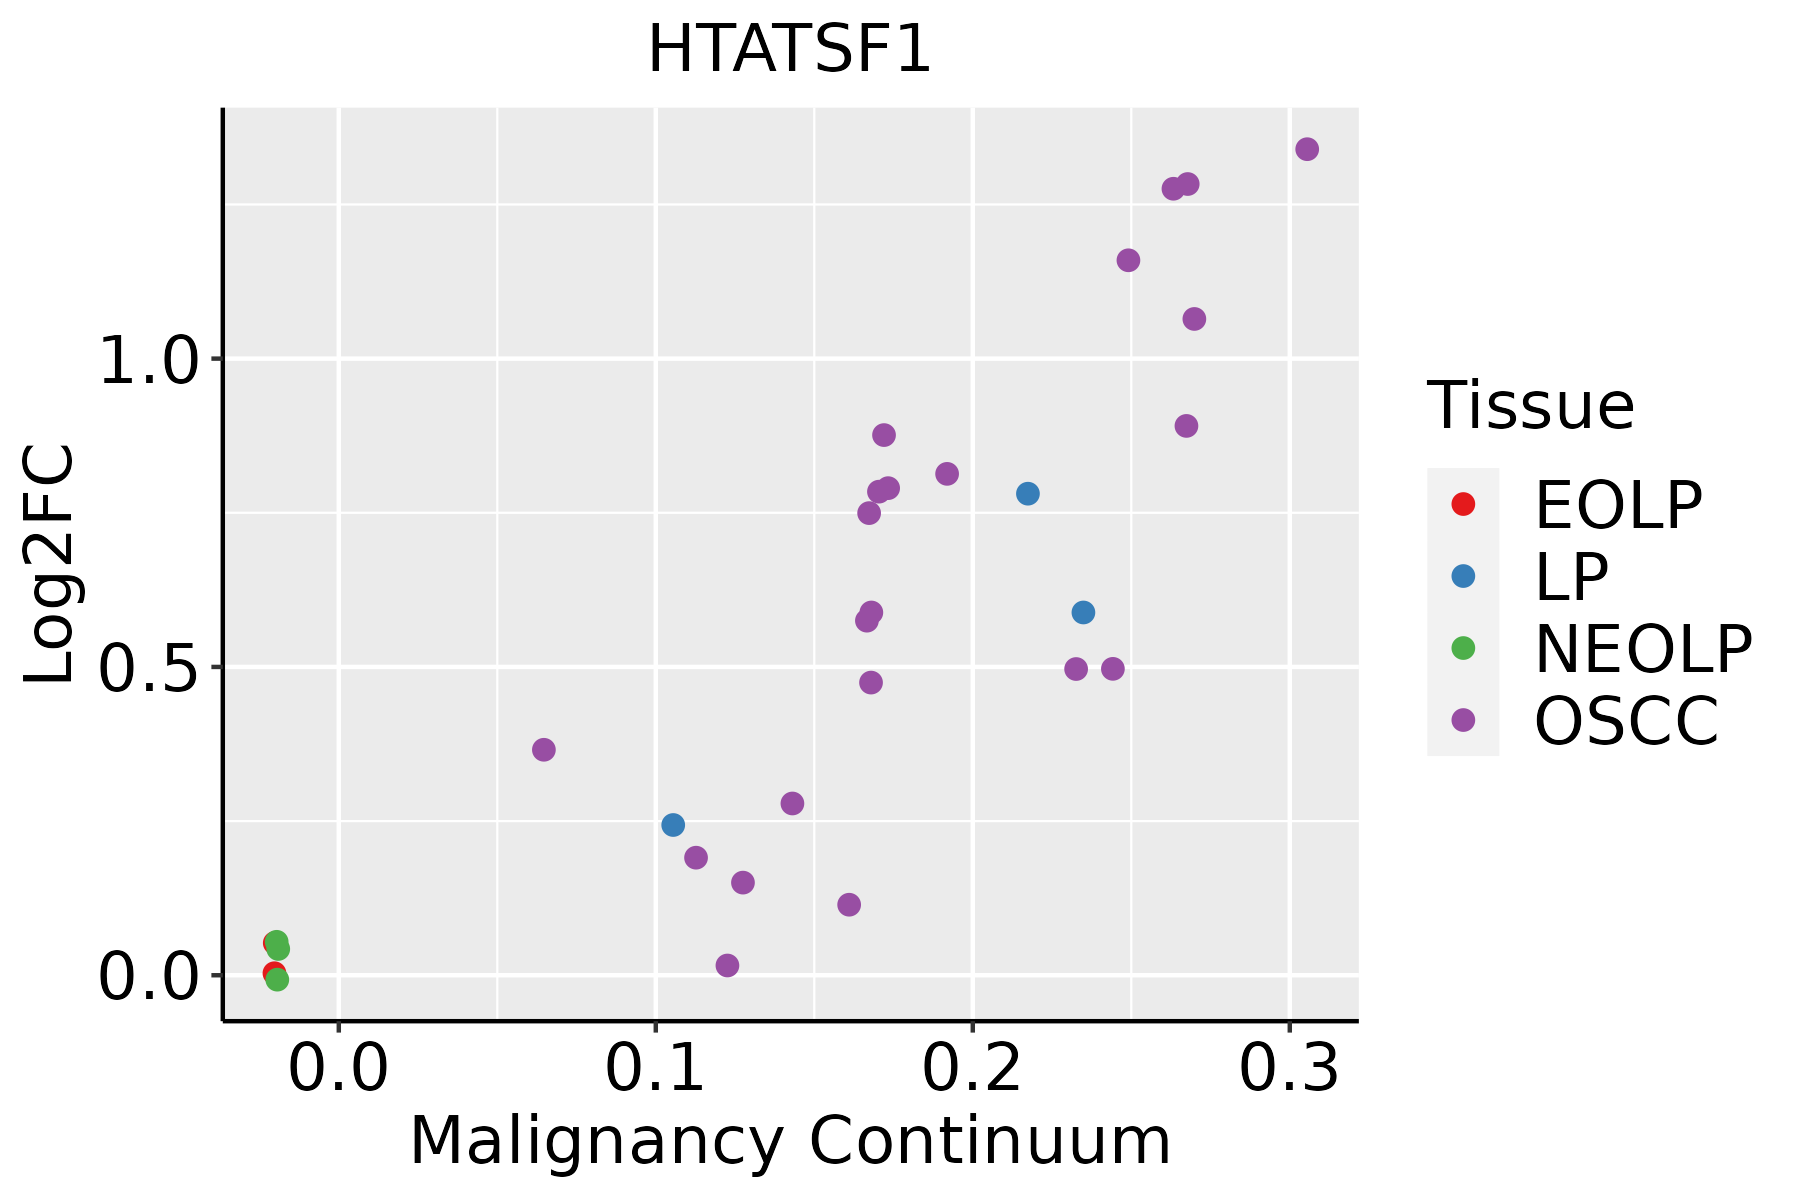
EOLP: Erosive Oral lichen planus
LP: leukoplakia
NEOLP: Non-erosive oral lichen planus
OSCC: Oral squamous cell carcinoma
SkinThe image shows the transcriptomic changes along malignancy continuum.log2FC in expression of this searched gene in stem-like cells from each diseased tissue sample relative to stem-like cells in normal samples in each tissue plotted against the malignancy continuum. Samples are colored based on if they are from different disease stage.
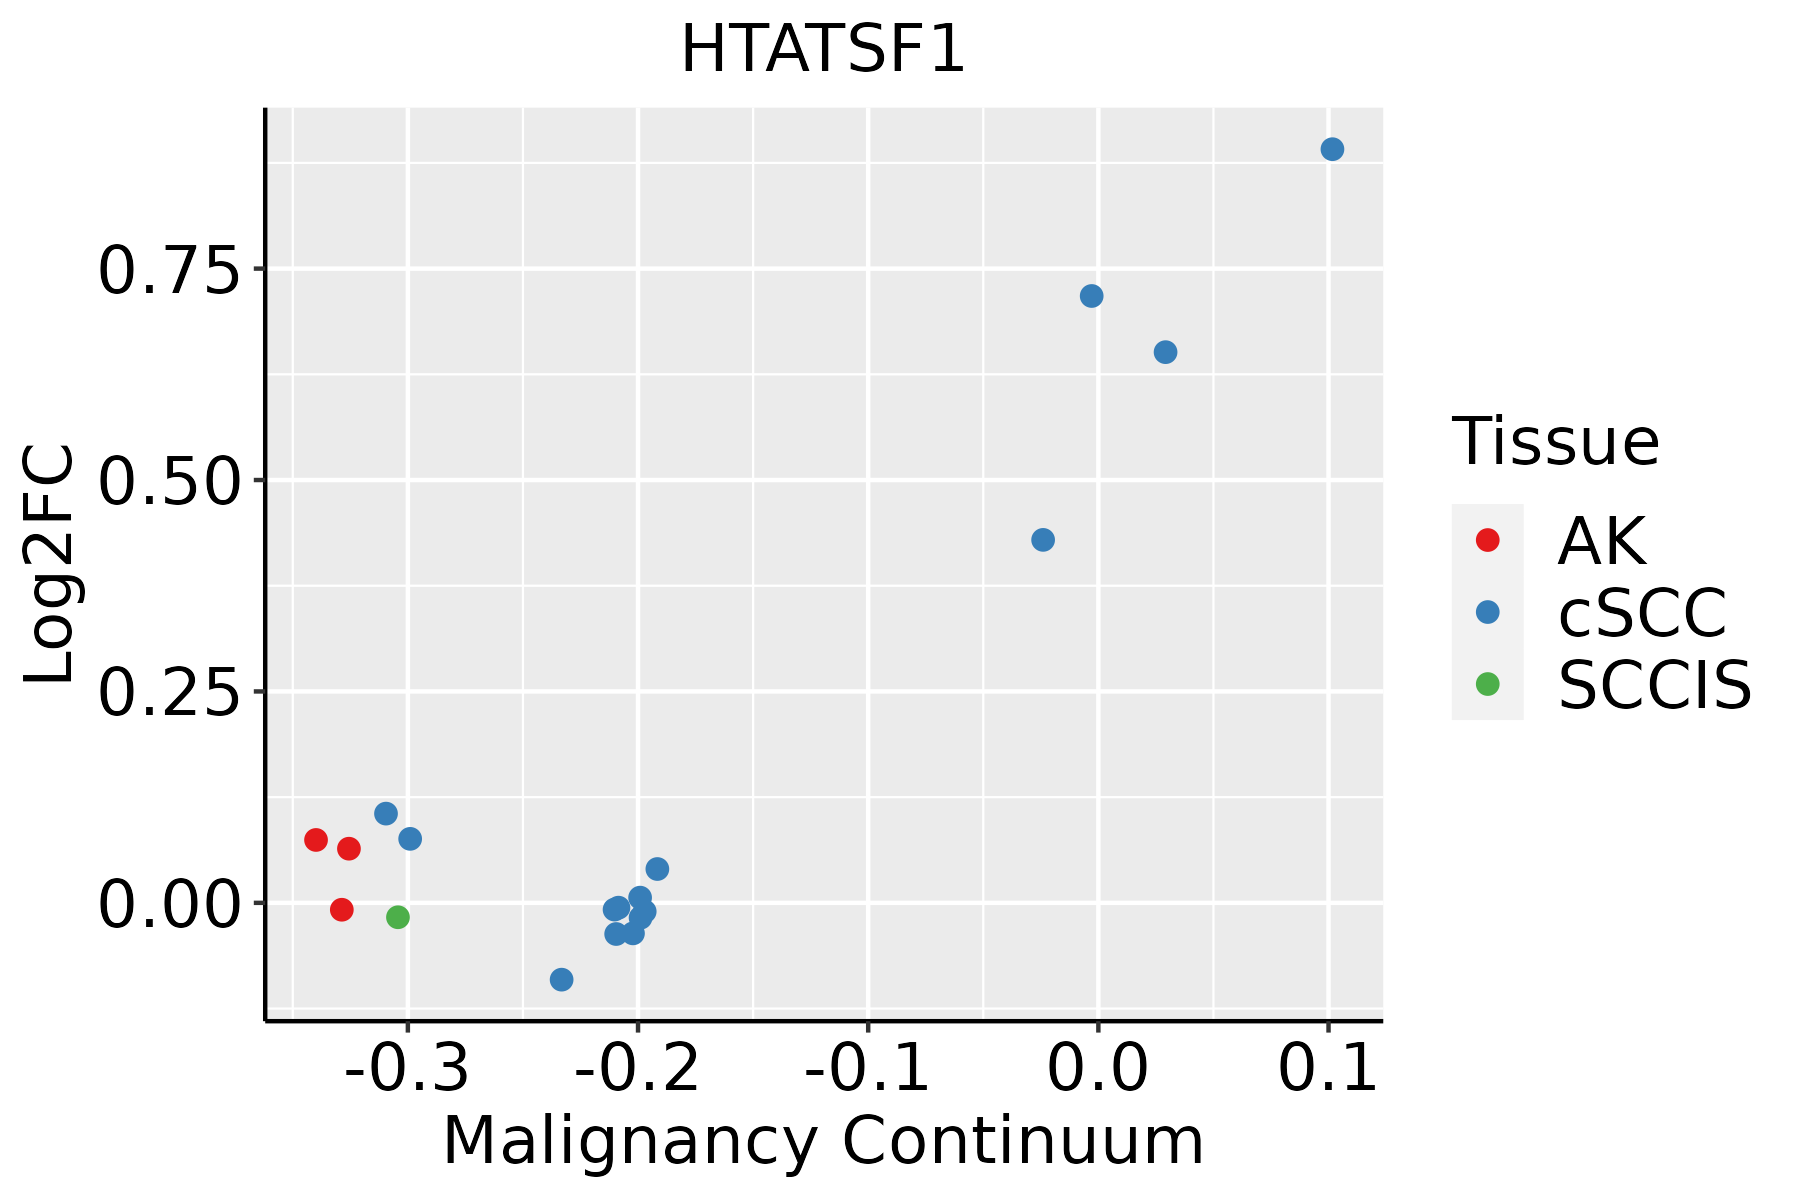
AK: Actinic keratosis
cSCC: Cutaneous squamous cell carcinoma
SCCIS:squamous cell carcinoma in situ
ThyroidThe image shows the transcriptomic changes along malignancy continuum.log2FC in expression of this searched gene in stem-like cells from each diseased tissue sample relative to stem-like cells in normal samples in each tissue plotted against the malignancy continuum. Samples are colored based on if they are from different disease stage.
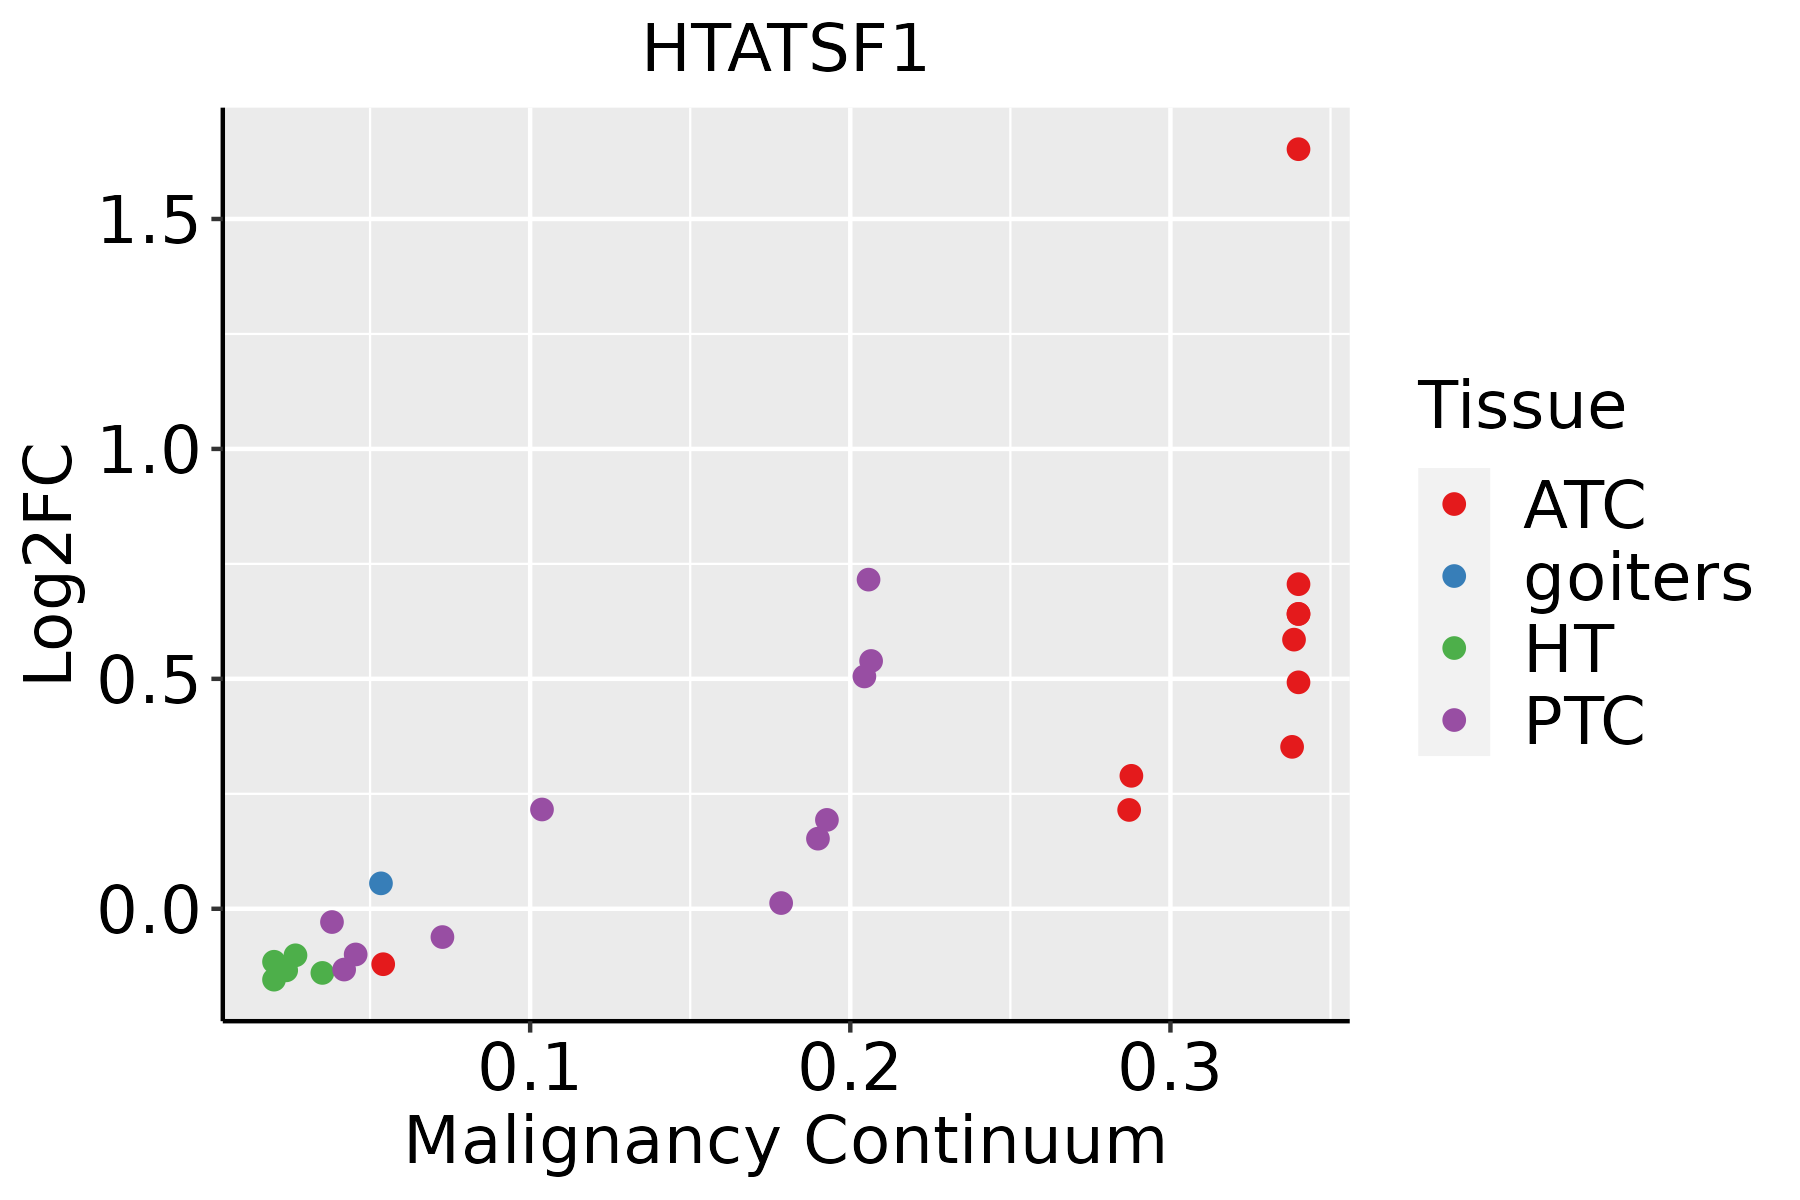
ATC: Anaplastic thyroid cancer
HT: Hashimoto's thyroiditis
PTC: Papillary thyroid cancer
∗log2FC in expression of this searched gene in stem-like cells from each diseased tissue sample relative to stem-like cells in normal samples in each tissue plotted against the malignancy continuum. Samples are colored based on if they are from different disease stage.

Top

Malignant transformation related pathway analysis

check buttonFind out the enriched GO biological processes and KEGG pathways involved in transition from healthy to precancer to cancer
check button Figure of enriched GO biological processes.
TissueDisease StageEnriched GO biological Processes
ColorectumADGO analysis - Figure of enriched GO biological processes: Top 15 enriched GO BP terms are showed in the bar plot of each disease state in each tissue. Each row represents a significant GO biological process which is colored according to the -log10(p.adjust).
ColorectumSERGO analysis - Figure of enriched GO biological processes: Top 15 enriched GO BP terms are showed in the bar plot of each disease state in each tissue. Each row represents a significant GO biological process which is colored according to the -log10(p.adjust).
ColorectumMSSGO analysis - Figure of enriched GO biological processes: Top 15 enriched GO BP terms are showed in the bar plot of each disease state in each tissue. Each row represents a significant GO biological process which is colored according to the -log10(p.adjust).
ColorectumMSI-HGO analysis - Figure of enriched GO biological processes: Top 15 enriched GO BP terms are showed in the bar plot of each disease state in each tissue. Each row represents a significant GO biological process which is colored according to the -log10(p.adjust).
ColorectumFAPGO analysis - Figure of enriched GO biological processes: Top 15 enriched GO BP terms are showed in the bar plot of each disease state in each tissue. Each row represents a significant GO biological process which is colored according to the -log10(p.adjust).
∗Top 15 enriched GO BP terms are showed in the bar plot of each disease state in each tissue. Each row represents a significant GO biological process which is colored according to the -log10(p.adjust).
Page: 1 2 3 4 5 6 7 8 9 

check button Enriched GO biological processes.
GO IDTissueDisease StageDescriptionGene RatioBg Ratiopvaluep.adjustCount
GO:0008380111EsophagusESCCRNA splicing336/8552434/187231.74e-423.67e-39336
GO:0000375111EsophagusESCCRNA splicing, via transesterification reactions248/8552324/187233.05e-301.49e-27248
GO:0000377111EsophagusESCCRNA splicing, via transesterification reactions with bulged adenosine as nucleophile244/8552320/187232.52e-291.07e-26244
GO:0000398111EsophagusESCCmRNA splicing, via spliceosome244/8552320/187232.52e-291.07e-26244
GO:0016032111EsophagusESCCviral process301/8552415/187233.34e-291.32e-26301
GO:0019058111EsophagusESCCviral life cycle226/8552317/187231.17e-201.76e-18226
GO:0019079111EsophagusESCCviral genome replication102/8552131/187234.31e-142.19e-12102
GO:000635414EsophagusESCCDNA-templated transcription, elongation76/855291/187238.35e-144.11e-1276
GO:003278412EsophagusESCCregulation of DNA-templated transcription, elongation45/855253/187233.64e-097.61e-0845
GO:000838012LiverCirrhoticRNA splicing229/4634434/187239.13e-372.86e-33229
GO:000037512LiverCirrhoticRNA splicing, via transesterification reactions175/4634324/187235.95e-307.47e-27175
GO:000037712LiverCirrhoticRNA splicing, via transesterification reactions with bulged adenosine as nucleophile172/4634320/187234.02e-293.60e-26172
GO:000039812LiverCirrhoticmRNA splicing, via spliceosome172/4634320/187234.02e-293.60e-26172
GO:001603212LiverCirrhoticviral process203/4634415/187235.40e-273.76e-24203
GO:001905812LiverCirrhoticviral life cycle148/4634317/187231.12e-171.64e-15148
GO:001907912LiverCirrhoticviral genome replication69/4634131/187235.77e-123.98e-1069
GO:00063544LiverCirrhoticDNA-templated transcription, elongation35/463491/187232.56e-031.53e-0235
GO:000838022LiverHCCRNA splicing313/7958434/187231.36e-361.73e-33313
GO:001603222LiverHCCviral process286/7958415/187234.41e-281.86e-25286
GO:000037522LiverHCCRNA splicing, via transesterification reactions228/7958324/187231.47e-244.06e-22228
Page: 1 2 3 4 

check button Enriched KEGG pathways.
Pathway IDTissueDisease StageDescriptionGene RatioBg Ratiopvaluep.adjustqvalueCount
Page: 1 

Top

Cell-cell communication analysis

check buttonIdentification of potential cell-cell interactions between two cell types and their ligand-receptor pairs for different disease states
LigandReceptorLRpairPathwayTissueDisease Stage
Page: 1 

Top

Single-cell gene regulatory network inference analysis

check buttonFind out the significant the regulons (TFs) and the target genes of each regulon across cell types for different disease states
TFCell TypeTissueDisease StageTarget GeneRSSRegulon Activity
∗The dot plots of a searched regulon are shown for all cell subpopulations in each disease state of each tissue based on the regulon specific score inferred using pySCENIC and by calculating the average expression.
Page: 1 

Top

Somatic mutation of malignant transformation related genes

check buttonAnnotation of somatic variants for genes involved in malignant transformation
Hugo SymbolVariant ClassVariant ClassificationdbSNP RSHGVScHGVSpHGVSp ShortSWISSPROTBIOTYPESIFTPolyPhenTumor Sample BarcodeTissueHistologySexAgeStageTherapy TypesDrugsOutcome
HTATSF1SNVMissense_Mutationc.613N>Ap.Glu205Lysp.E205KO43719protein_codingdeleterious(0.02)probably_damaging(0.936)TCGA-A2-A04T-01Breastbreast invasive carcinomaFemale<65I/IIChemotherapycyclophosphamideSD
HTATSF1SNVMissense_Mutationc.856N>Ap.Glu286Lysp.E286KO43719protein_codingdeleterious(0)probably_damaging(0.929)TCGA-A2-A0CL-01Breastbreast invasive carcinomaFemale<65III/IVChemotherapycytoxanSD
HTATSF1SNVMissense_Mutationnovelc.2172G>Tp.Arg724Serp.R724SO43719protein_codingdeleterious_low_confidence(0.03)benign(0.001)TCGA-A7-A0DB-01Breastbreast invasive carcinomaFemale<65I/IIHormone TherapyarimidexSD
HTATSF1SNVMissense_Mutationc.1007G>Cp.Trp336Serp.W336SO43719protein_codingdeleterious(0.02)probably_damaging(0.995)TCGA-A7-A13E-01Breastbreast invasive carcinomaFemale<65I/IITargeted Molecular therapybevacizumabPD
HTATSF1SNVMissense_Mutationc.1807N>Ap.Glu603Lysp.E603KO43719protein_codingdeleterious_low_confidence(0.01)benign(0)TCGA-A8-A09Z-01Breastbreast invasive carcinomaFemale>=65I/IIUnknownUnknownSD
HTATSF1SNVMissense_Mutationc.1355N>Tp.Ser452Ilep.S452IO43719protein_codingdeleterious_low_confidence(0.01)benign(0.003)TCGA-AO-A0JG-01Breastbreast invasive carcinomaFemale<65III/IVChemotherapydoxorubicinSD
HTATSF1SNVMissense_Mutationc.2002N>Tp.Ala668Serp.A668SO43719protein_codingtolerated_low_confidence(0.1)benign(0.058)TCGA-B6-A0RS-01Breastbreast invasive carcinomaFemale<65I/IIUnknownUnknownPD
HTATSF1SNVMissense_Mutationnovelc.761G>Ap.Arg254Glnp.R254QO43719protein_codingtolerated(0.08)benign(0.014)TCGA-B6-A401-01Breastbreast invasive carcinomaFemale<65I/IIChemotherapycyclophosphamideSD
HTATSF1SNVMissense_Mutationc.1402N>Ap.Glu468Lysp.E468KO43719protein_codingtolerated_low_confidence(0.14)benign(0.432)TCGA-C8-A12T-01Breastbreast invasive carcinomaFemale<65I/IIUnknownUnknownSD
HTATSF1SNVMissense_Mutationc.1582N>Ap.Glu528Lysp.E528KO43719protein_codingtolerated_low_confidence(0.15)benign(0.013)TCGA-D8-A13Y-01Breastbreast invasive carcinomaFemale<65I/IIChemotherapydoxorubicinSD
Page: 1 2 3 4 5 6 7 8 9 10 11 12 13 14 

Top

Related drugs of malignant transformation related genes

check buttonIdentification of chemicals and drugs interact with genes involved in malignant transfromation
(DGIdb 4.0)
Entrez IDSymbolCategoryInteraction TypesDrug Claim NameDrug NamePMIDs
Page: 1