
|
|||||
|
 | |
| |
| |
| |
| |
| |
|
Gene: HSD17B1 |
Gene summary for HSD17B1 |
| Gene information | Species | Human | Gene symbol | HSD17B1 | Gene ID | 3292 |
| Gene name | hydroxysteroid 17-beta dehydrogenase 1 | |
| Gene Alias | 17-beta-HSD | |
| Cytomap | 17q21.2 | |
| Gene Type | protein-coding | GO ID | GO:0001501 | UniProtAcc | P14061 |
Top |
Malignant transformation analysis |
| Identification of the aberrant gene expression in precancerous and cancerous lesions by comparing the gene expression of stem-like cells in diseased tissues with normal stem cells |
| Entrez ID | Symbol | Replicates | Species | Organ | Tissue | Adj P-value | Log2FC | Malignancy |
| 3292 | HSD17B1 | C43 | Human | Oral cavity | OSCC | 7.94e-07 | 1.46e-01 | 0.1704 |
| 3292 | HSD17B1 | C46 | Human | Oral cavity | OSCC | 7.43e-05 | 2.55e-01 | 0.1673 |
| 3292 | HSD17B1 | C51 | Human | Oral cavity | OSCC | 3.06e-28 | 1.25e+00 | 0.2674 |
| 3292 | HSD17B1 | C06 | Human | Oral cavity | OSCC | 2.93e-06 | 1.08e+00 | 0.2699 |
| 3292 | HSD17B1 | C08 | Human | Oral cavity | OSCC | 3.47e-20 | 4.41e-01 | 0.1919 |
| 3292 | HSD17B1 | LP17 | Human | Oral cavity | LP | 4.84e-03 | 3.99e-01 | 0.2349 |
| 3292 | HSD17B1 | SYSMH1 | Human | Oral cavity | OSCC | 8.17e-16 | 2.76e-01 | 0.1127 |
| 3292 | HSD17B1 | SYSMH2 | Human | Oral cavity | OSCC | 3.53e-22 | 5.41e-01 | 0.2326 |
| 3292 | HSD17B1 | SYSMH3 | Human | Oral cavity | OSCC | 1.08e-32 | 6.81e-01 | 0.2442 |
| 3292 | HSD17B1 | SYSMH4 | Human | Oral cavity | OSCC | 6.16e-09 | 8.81e-02 | 0.1226 |
| 3292 | HSD17B1 | SYSMH5 | Human | Oral cavity | OSCC | 1.96e-04 | 1.32e-01 | 0.0647 |
| Page: 1 2 3 |
| Tissue | Expression Dynamics | Abbreviation |
| Esophagus | 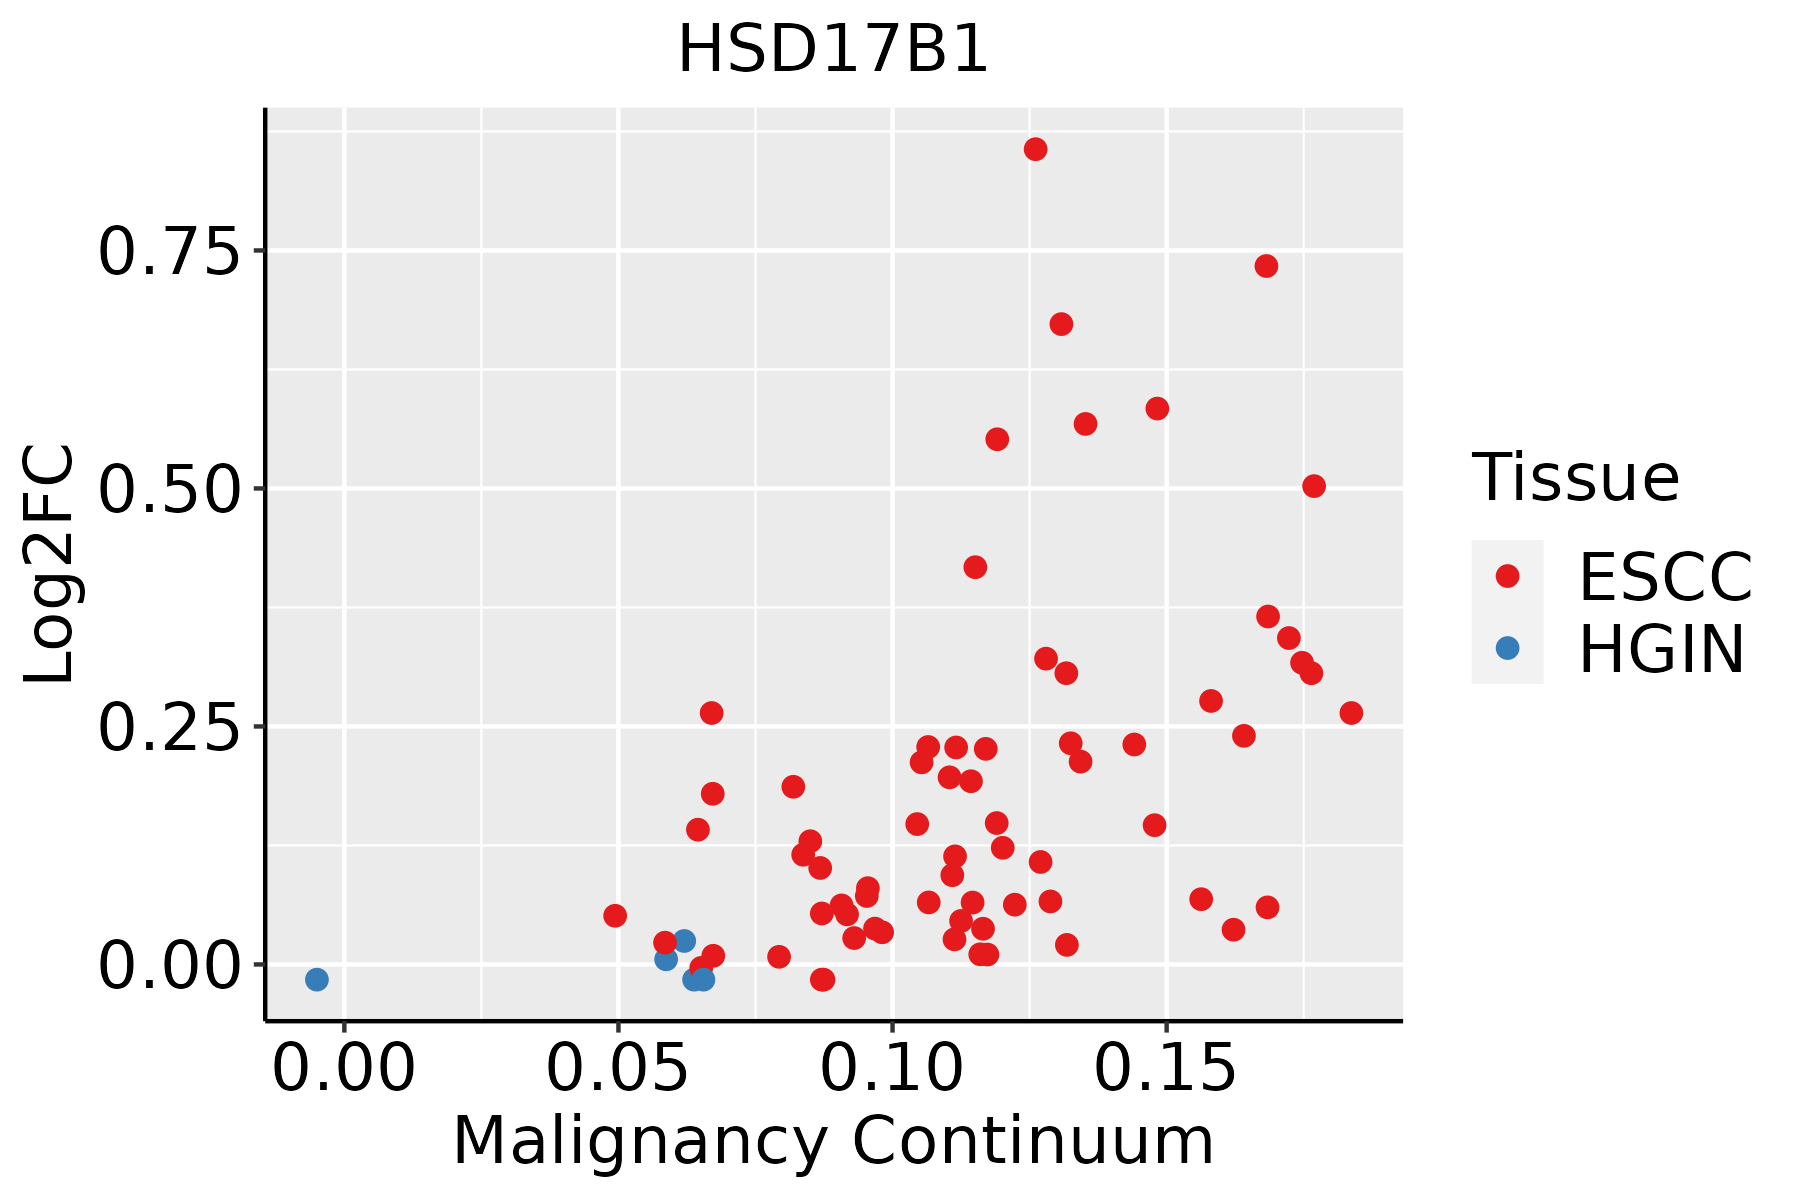 | ESCC: Esophageal squamous cell carcinoma |
| HGIN: High-grade intraepithelial neoplasias | ||
| LGIN: Low-grade intraepithelial neoplasias | ||
| Oral Cavity |  | EOLP: Erosive Oral lichen planus |
| LP: leukoplakia | ||
| NEOLP: Non-erosive oral lichen planus | ||
| OSCC: Oral squamous cell carcinoma |
| ∗log2FC in expression of this searched gene in stem-like cells from each diseased tissue sample relative to stem-like cells in normal samples in each tissue plotted against the malignancy continuum. Samples are colored based on if they are from different disease stage. |
Top |
Malignant transformation related pathway analysis |
| Find out the enriched GO biological processes and KEGG pathways involved in transition from healthy to precancer to cancer |
| Tissue | Disease Stage | Enriched GO biological Processes |
| Colorectum | AD |  |
| Colorectum | SER |  |
| Colorectum | MSS |  |
| Colorectum | MSI-H |  |
| Colorectum | FAP |  |
| ∗Top 15 enriched GO BP terms are showed in the bar plot of each disease state in each tissue. Each row represents a significant GO biological process which is colored according to the -log10(p.adjust). |
| Page: 1 2 3 4 5 6 7 8 9 |
| GO ID | Tissue | Disease Stage | Description | Gene Ratio | Bg Ratio | pvalue | p.adjust | Count |
| GO:00344705 | Breast | Precancer | ncRNA processing | 42/1080 | 395/18723 | 9.91e-05 | 1.83e-03 | 42 |
| GO:00346604 | Breast | Precancer | ncRNA metabolic process | 45/1080 | 485/18723 | 1.15e-03 | 1.26e-02 | 45 |
| GO:00463946 | Breast | Precancer | carboxylic acid biosynthetic process | 32/1080 | 314/18723 | 1.30e-03 | 1.38e-02 | 32 |
| GO:00723304 | Breast | Precancer | monocarboxylic acid biosynthetic process | 24/1080 | 214/18723 | 1.41e-03 | 1.48e-02 | 24 |
| GO:00160536 | Breast | Precancer | organic acid biosynthetic process | 32/1080 | 316/18723 | 1.44e-03 | 1.50e-02 | 32 |
| GO:00066944 | Breast | IDC | steroid biosynthetic process | 25/1434 | 173/18723 | 1.56e-03 | 1.56e-02 | 25 |
| GO:007233012 | Breast | IDC | monocarboxylic acid biosynthetic process | 29/1434 | 214/18723 | 1.91e-03 | 1.83e-02 | 29 |
| GO:001605313 | Breast | IDC | organic acid biosynthetic process | 39/1434 | 316/18723 | 2.13e-03 | 1.99e-02 | 39 |
| GO:004639413 | Breast | IDC | carboxylic acid biosynthetic process | 38/1434 | 314/18723 | 3.39e-03 | 2.83e-02 | 38 |
| GO:001605322 | Breast | DCIS | organic acid biosynthetic process | 38/1390 | 316/18723 | 2.22e-03 | 2.04e-02 | 38 |
| GO:007233022 | Breast | DCIS | monocarboxylic acid biosynthetic process | 28/1390 | 214/18723 | 2.43e-03 | 2.18e-02 | 28 |
| GO:004639422 | Breast | DCIS | carboxylic acid biosynthetic process | 37/1390 | 314/18723 | 3.56e-03 | 2.92e-02 | 37 |
| GO:003447011 | Breast | DCIS | ncRNA processing | 44/1390 | 395/18723 | 4.56e-03 | 3.49e-02 | 44 |
| GO:000669411 | Breast | DCIS | steroid biosynthetic process | 23/1390 | 173/18723 | 4.63e-03 | 3.52e-02 | 23 |
| GO:001081010 | Cervix | CC | regulation of cell-substrate adhesion | 69/2311 | 221/18723 | 8.57e-14 | 5.69e-11 | 69 |
| GO:00315898 | Cervix | CC | cell-substrate adhesion | 96/2311 | 363/18723 | 1.48e-13 | 8.85e-11 | 96 |
| GO:004578510 | Cervix | CC | positive regulation of cell adhesion | 101/2311 | 437/18723 | 1.96e-10 | 3.08e-08 | 101 |
| GO:001081110 | Cervix | CC | positive regulation of cell-substrate adhesion | 34/2311 | 123/18723 | 3.66e-06 | 9.68e-05 | 34 |
| GO:00196939 | Cervix | CC | ribose phosphate metabolic process | 72/2311 | 396/18723 | 4.49e-04 | 4.48e-03 | 72 |
| GO:00092599 | Cervix | CC | ribonucleotide metabolic process | 70/2311 | 385/18723 | 5.35e-04 | 5.18e-03 | 70 |
| Page: 1 2 3 4 5 6 7 8 9 10 11 12 13 14 15 16 17 18 19 20 21 22 23 24 25 26 27 28 29 30 31 32 33 34 35 |
| Pathway ID | Tissue | Disease Stage | Description | Gene Ratio | Bg Ratio | pvalue | p.adjust | qvalue | Count |
| Page: 1 |
Top |
Cell-cell communication analysis |
| Identification of potential cell-cell interactions between two cell types and their ligand-receptor pairs for different disease states |
| Ligand | Receptor | LRpair | Pathway | Tissue | Disease Stage |
| Page: 1 |
Top |
Single-cell gene regulatory network inference analysis |
| Find out the significant the regulons (TFs) and the target genes of each regulon across cell types for different disease states |
| TF | Cell Type | Tissue | Disease Stage | Target Gene | RSS | Regulon Activity |
| ∗The dot plots of a searched regulon are shown for all cell subpopulations in each disease state of each tissue based on the regulon specific score inferred using pySCENIC and by calculating the average expression. |
| Page: 1 |
Top |
Somatic mutation of malignant transformation related genes |
| Annotation of somatic variants for genes involved in malignant transformation |
| Hugo Symbol | Variant Class | Variant Classification | dbSNP RS | HGVSc | HGVSp | HGVSp Short | SWISSPROT | BIOTYPE | SIFT | PolyPhen | Tumor Sample Barcode | Tissue | Histology | Sex | Age | Stage | Therapy Types | Drugs | Outcome |
| HSD17B1 | SNV | Missense_Mutation | novel | c.367N>A | p.Leu123Met | p.L123M | protein_coding | deleterious(0.04) | possibly_damaging(0.697) | TCGA-2W-A8YY-01 | Cervix | cervical & endocervical cancer | Female | <65 | I/II | Chemotherapy | cisplatin | CR | |
| HSD17B1 | SNV | Missense_Mutation | c.400N>A | p.Gly134Ser | p.G134S | protein_coding | tolerated(0.13) | benign(0.206) | TCGA-AZ-6601-01 | Colorectum | colon adenocarcinoma | Male | >=65 | I/II | Unknown | Unknown | PD | ||
| HSD17B1 | SNV | Missense_Mutation | c.144N>T | p.Glu48Asp | p.E48D | protein_coding | tolerated(0.07) | possibly_damaging(0.717) | TCGA-G4-6302-01 | Colorectum | colon adenocarcinoma | Female | >=65 | I/II | Unknown | Unknown | SD | ||
| HSD17B1 | SNV | Missense_Mutation | c.609G>T | p.Glu203Asp | p.E203D | protein_coding | tolerated(0.62) | benign(0) | TCGA-AP-A0LM-01 | Endometrium | uterine corpus endometrioid carcinoma | Female | <65 | III/IV | Chemotherapy | cisplatin | SD | ||
| HSD17B1 | SNV | Missense_Mutation | rs773613890 | c.530N>G | p.Phe177Cys | p.F177C | protein_coding | deleterious(0) | probably_damaging(0.975) | TCGA-AX-A2H2-01 | Endometrium | uterine corpus endometrioid carcinoma | Female | >=65 | I/II | Unknown | Unknown | SD | |
| HSD17B1 | SNV | Missense_Mutation | c.320N>T | p.Ala107Val | p.A107V | protein_coding | deleterious(0.02) | possibly_damaging(0.571) | TCGA-BG-A0M4-01 | Endometrium | uterine corpus endometrioid carcinoma | Female | <65 | I/II | Chemotherapy | carboplatin | SD | ||
| HSD17B1 | SNV | Missense_Mutation | novel | c.337N>A | p.Asp113Asn | p.D113N | protein_coding | deleterious(0.04) | benign(0.359) | TCGA-BG-A222-01 | Endometrium | uterine corpus endometrioid carcinoma | Female | <65 | I/II | Unknown | Unknown | SD | |
| HSD17B1 | SNV | Missense_Mutation | novel | c.283G>T | p.Gly95Cys | p.G95C | protein_coding | deleterious(0) | probably_damaging(0.998) | TCGA-EO-A3KX-01 | Endometrium | uterine corpus endometrioid carcinoma | Female | >=65 | I/II | Unknown | Unknown | SD | |
| HSD17B1 | SNV | Missense_Mutation | c.404N>G | p.Ser135Trp | p.S135W | protein_coding | tolerated(0.05) | benign(0.35) | TCGA-44-A47A-01 | Lung | lung adenocarcinoma | Female | >=65 | I/II | Unknown | Unknown | PD | ||
| HSD17B1 | SNV | Missense_Mutation | c.868C>T | p.Pro290Ser | p.P290S | protein_coding | tolerated(0.15) | benign(0.023) | TCGA-86-A4JF-01 | Lung | lung adenocarcinoma | Male | <65 | I/II | Chemotherapy | unknown | PD |
| Page: 1 2 |
Top |
Related drugs of malignant transformation related genes |
| Identification of chemicals and drugs interact with genes involved in malignant transfromation |
| (DGIdb 4.0) |
| Entrez ID | Symbol | Category | Interaction Types | Drug Claim Name | Drug Name | PMIDs |
| Page: 1 |

Copyright 2023-Present -The University of Texas Health Science Center at Houston |