
|
|||||
|
 | |
| |
| |
| |
| |
| |
|
Gene: HPS1 |
Gene summary for HPS1 |
| Gene information | Species | Human | Gene symbol | HPS1 | Gene ID | 3257 |
| Gene name | HPS1 biogenesis of lysosomal organelles complex 3 subunit 1 | |
| Gene Alias | BLOC3S1 | |
| Cytomap | 10q24.2 | |
| Gene Type | protein-coding | GO ID | GO:0003008 | UniProtAcc | Q658M9 |
Top |
Malignant transformation analysis |
| Identification of the aberrant gene expression in precancerous and cancerous lesions by comparing the gene expression of stem-like cells in diseased tissues with normal stem cells |
| Entrez ID | Symbol | Replicates | Species | Organ | Tissue | Adj P-value | Log2FC | Malignancy |
| 3257 | HPS1 | P21T-E | Human | Esophagus | ESCC | 5.47e-34 | 5.93e-01 | 0.1617 |
| 3257 | HPS1 | P22T-E | Human | Esophagus | ESCC | 2.13e-38 | 6.63e-01 | 0.1236 |
| 3257 | HPS1 | P23T-E | Human | Esophagus | ESCC | 4.14e-39 | 1.02e+00 | 0.108 |
| 3257 | HPS1 | P24T-E | Human | Esophagus | ESCC | 7.65e-28 | 4.03e-01 | 0.1287 |
| 3257 | HPS1 | P26T-E | Human | Esophagus | ESCC | 5.89e-30 | 7.14e-01 | 0.1276 |
| 3257 | HPS1 | P27T-E | Human | Esophagus | ESCC | 3.94e-47 | 9.59e-01 | 0.1055 |
| 3257 | HPS1 | P28T-E | Human | Esophagus | ESCC | 5.68e-24 | 6.41e-01 | 0.1149 |
| 3257 | HPS1 | P30T-E | Human | Esophagus | ESCC | 1.49e-34 | 1.18e+00 | 0.137 |
| 3257 | HPS1 | P31T-E | Human | Esophagus | ESCC | 8.30e-36 | 6.48e-01 | 0.1251 |
| 3257 | HPS1 | P32T-E | Human | Esophagus | ESCC | 1.39e-24 | 3.73e-01 | 0.1666 |
| 3257 | HPS1 | P36T-E | Human | Esophagus | ESCC | 9.50e-16 | 5.34e-01 | 0.1187 |
| 3257 | HPS1 | P37T-E | Human | Esophagus | ESCC | 8.93e-23 | 4.47e-01 | 0.1371 |
| 3257 | HPS1 | P38T-E | Human | Esophagus | ESCC | 1.38e-10 | 2.17e-01 | 0.127 |
| 3257 | HPS1 | P39T-E | Human | Esophagus | ESCC | 1.15e-19 | 4.02e-01 | 0.0894 |
| 3257 | HPS1 | P40T-E | Human | Esophagus | ESCC | 2.01e-16 | 5.19e-01 | 0.109 |
| 3257 | HPS1 | P42T-E | Human | Esophagus | ESCC | 2.95e-20 | 5.42e-01 | 0.1175 |
| 3257 | HPS1 | P44T-E | Human | Esophagus | ESCC | 3.46e-18 | 4.07e-01 | 0.1096 |
| 3257 | HPS1 | P47T-E | Human | Esophagus | ESCC | 2.48e-25 | 3.59e-01 | 0.1067 |
| 3257 | HPS1 | P48T-E | Human | Esophagus | ESCC | 1.12e-20 | 4.78e-01 | 0.0959 |
| 3257 | HPS1 | P49T-E | Human | Esophagus | ESCC | 2.37e-14 | 1.51e+00 | 0.1768 |
| Page: 1 2 3 4 5 6 7 |
| Tissue | Expression Dynamics | Abbreviation |
| Colorectum (GSE201348) |  | FAP: Familial adenomatous polyposis |
| CRC: Colorectal cancer | ||
| Colorectum (HTA11) |  | AD: Adenomas |
| SER: Sessile serrated lesions | ||
| MSI-H: Microsatellite-high colorectal cancer | ||
| MSS: Microsatellite stable colorectal cancer | ||
| Esophagus |  | ESCC: Esophageal squamous cell carcinoma |
| HGIN: High-grade intraepithelial neoplasias | ||
| LGIN: Low-grade intraepithelial neoplasias | ||
| Liver | 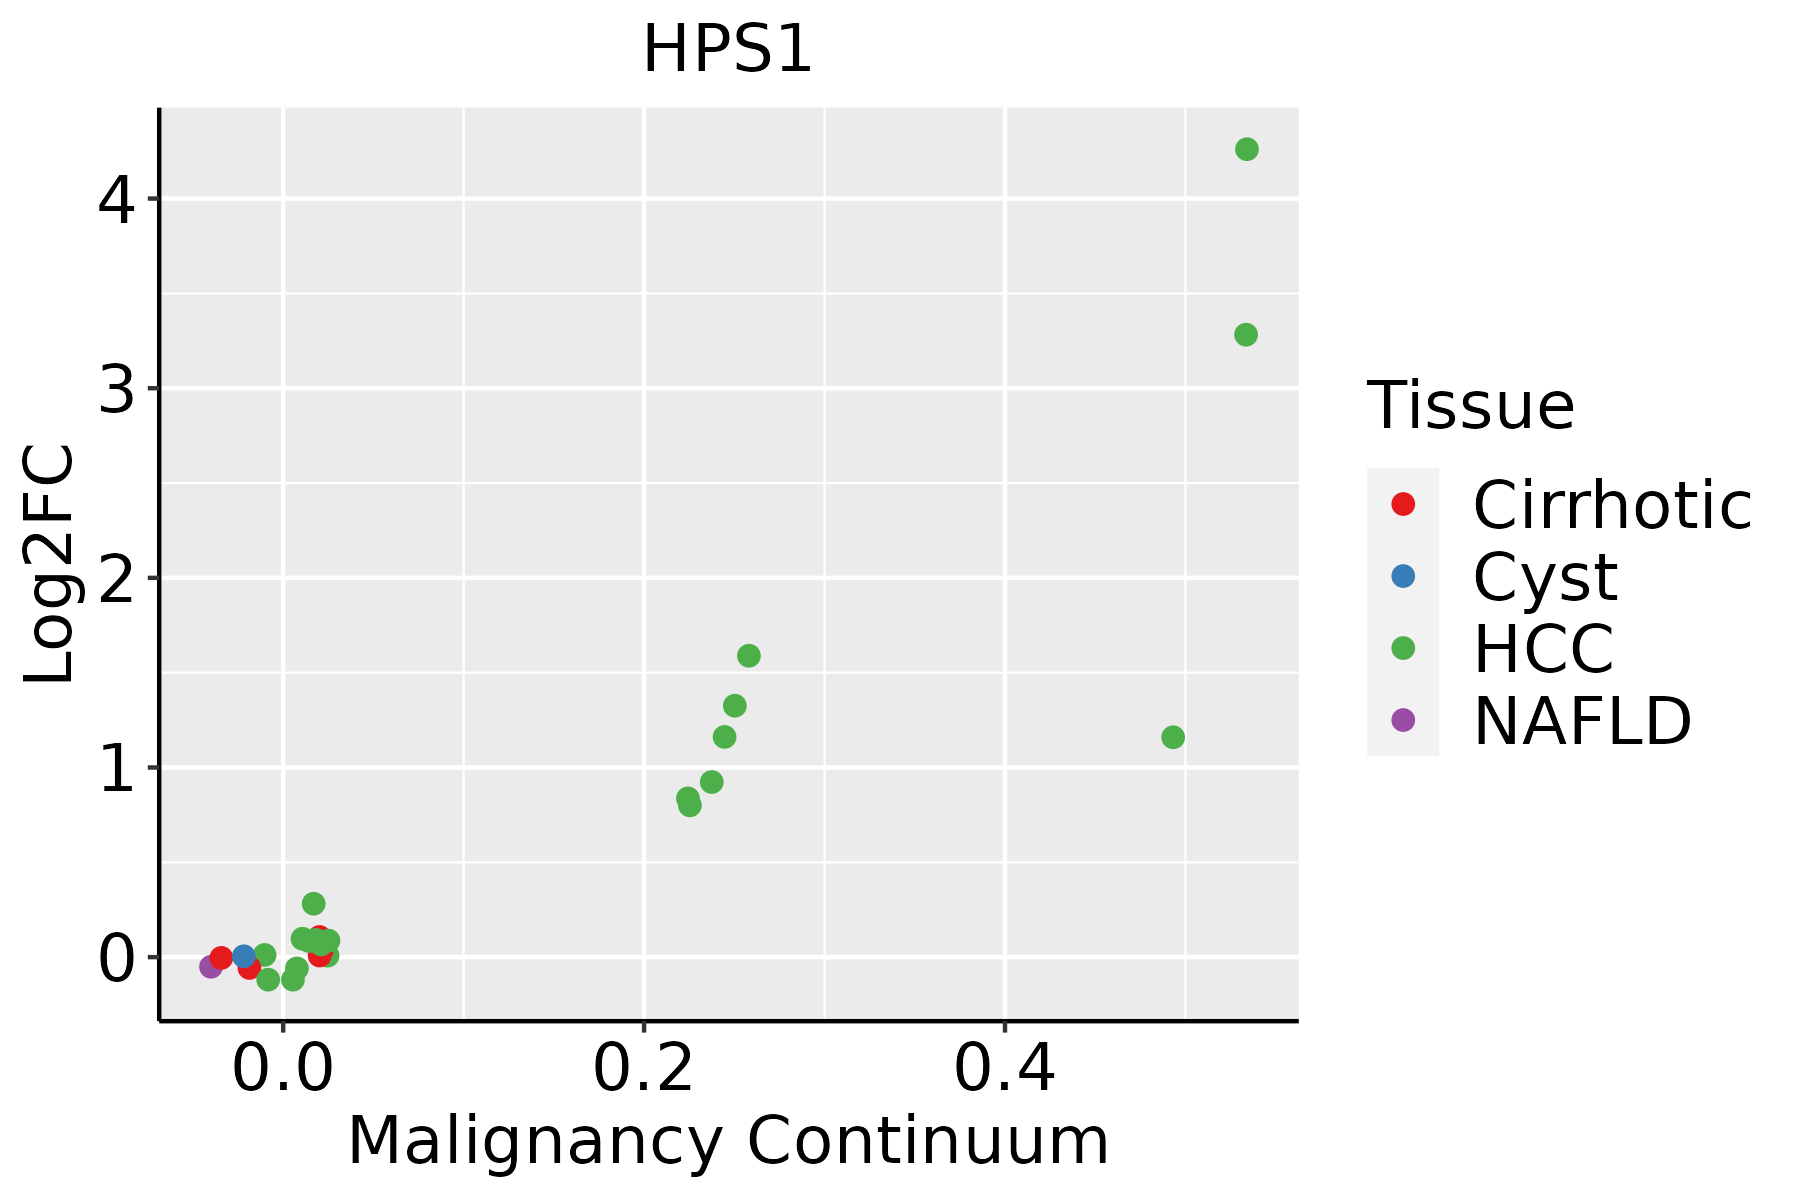 | HCC: Hepatocellular carcinoma |
| NAFLD: Non-alcoholic fatty liver disease | ||
| Oral Cavity | 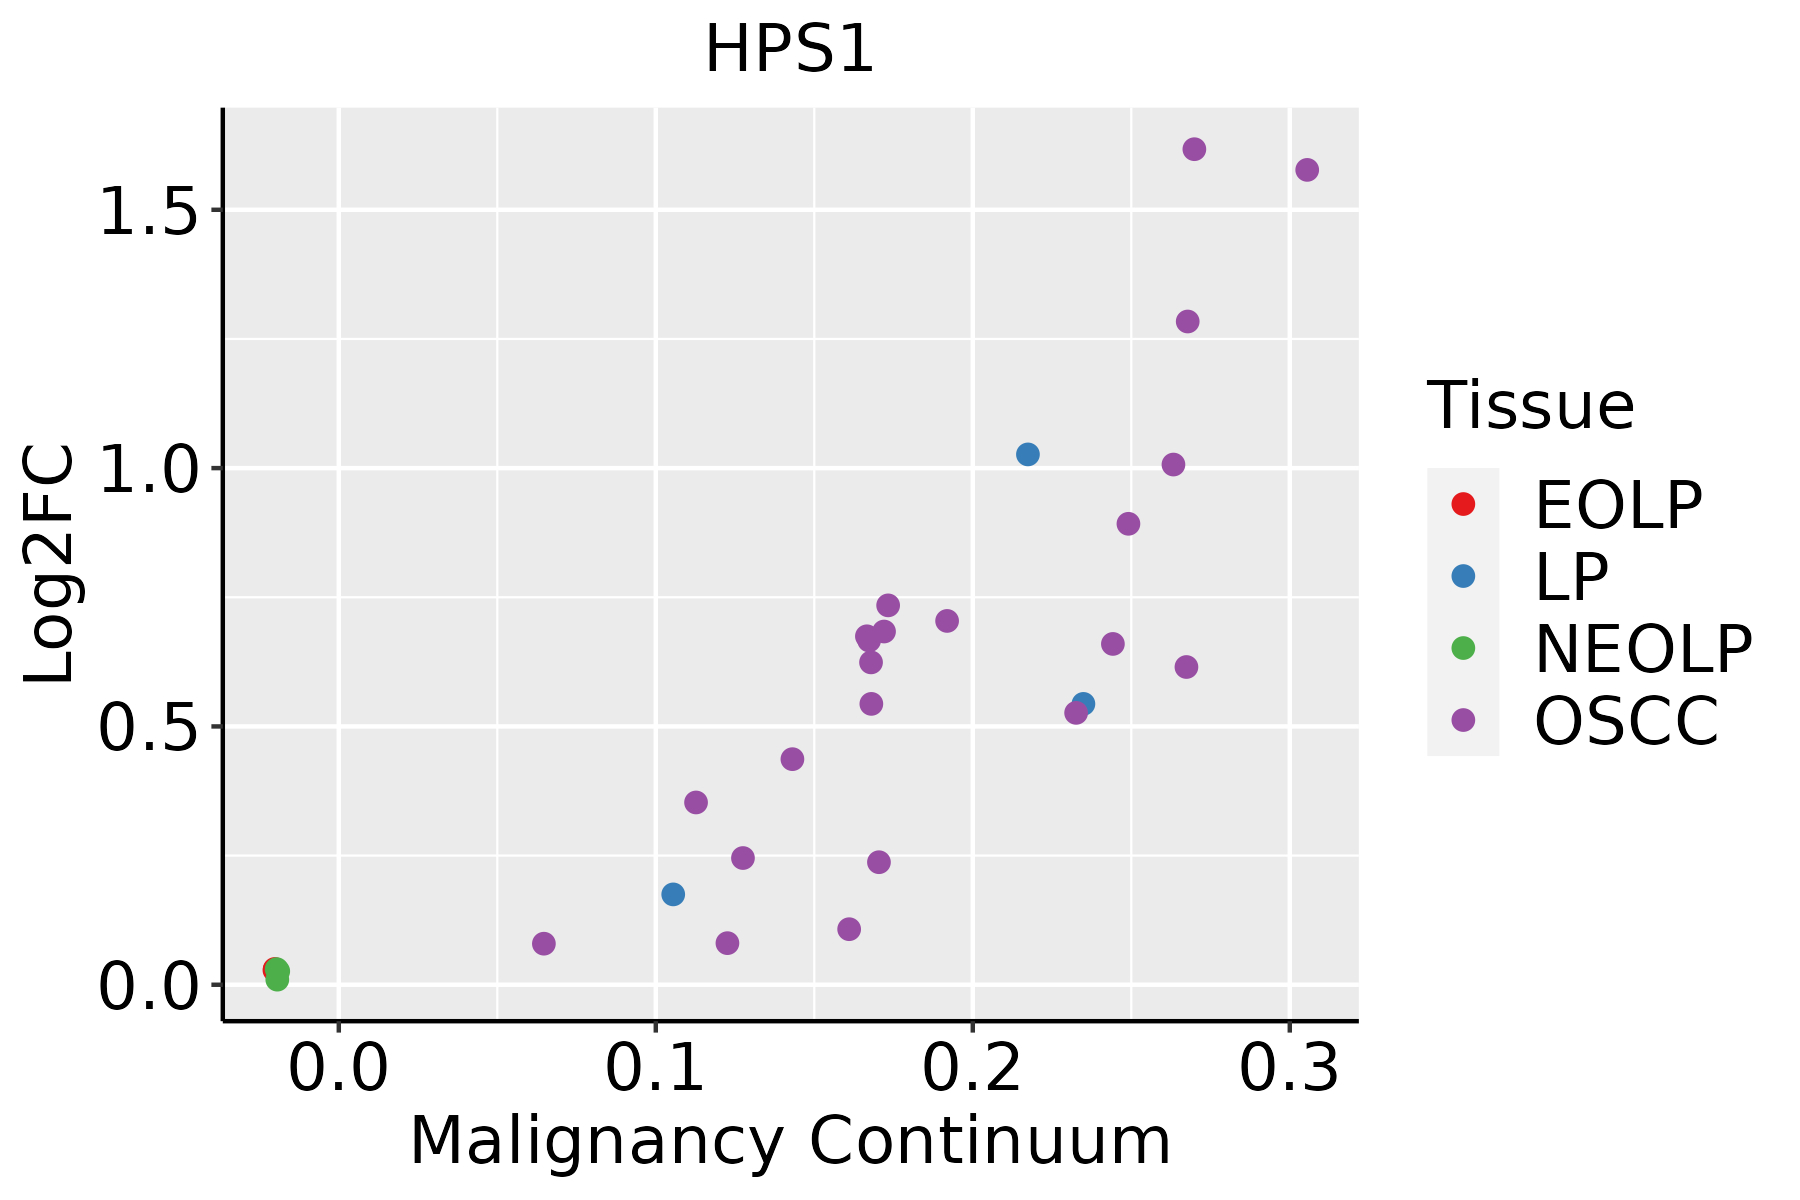 | EOLP: Erosive Oral lichen planus |
| LP: leukoplakia | ||
| NEOLP: Non-erosive oral lichen planus | ||
| OSCC: Oral squamous cell carcinoma | ||
| Skin |  | AK: Actinic keratosis |
| cSCC: Cutaneous squamous cell carcinoma | ||
| SCCIS:squamous cell carcinoma in situ | ||
| Thyroid | 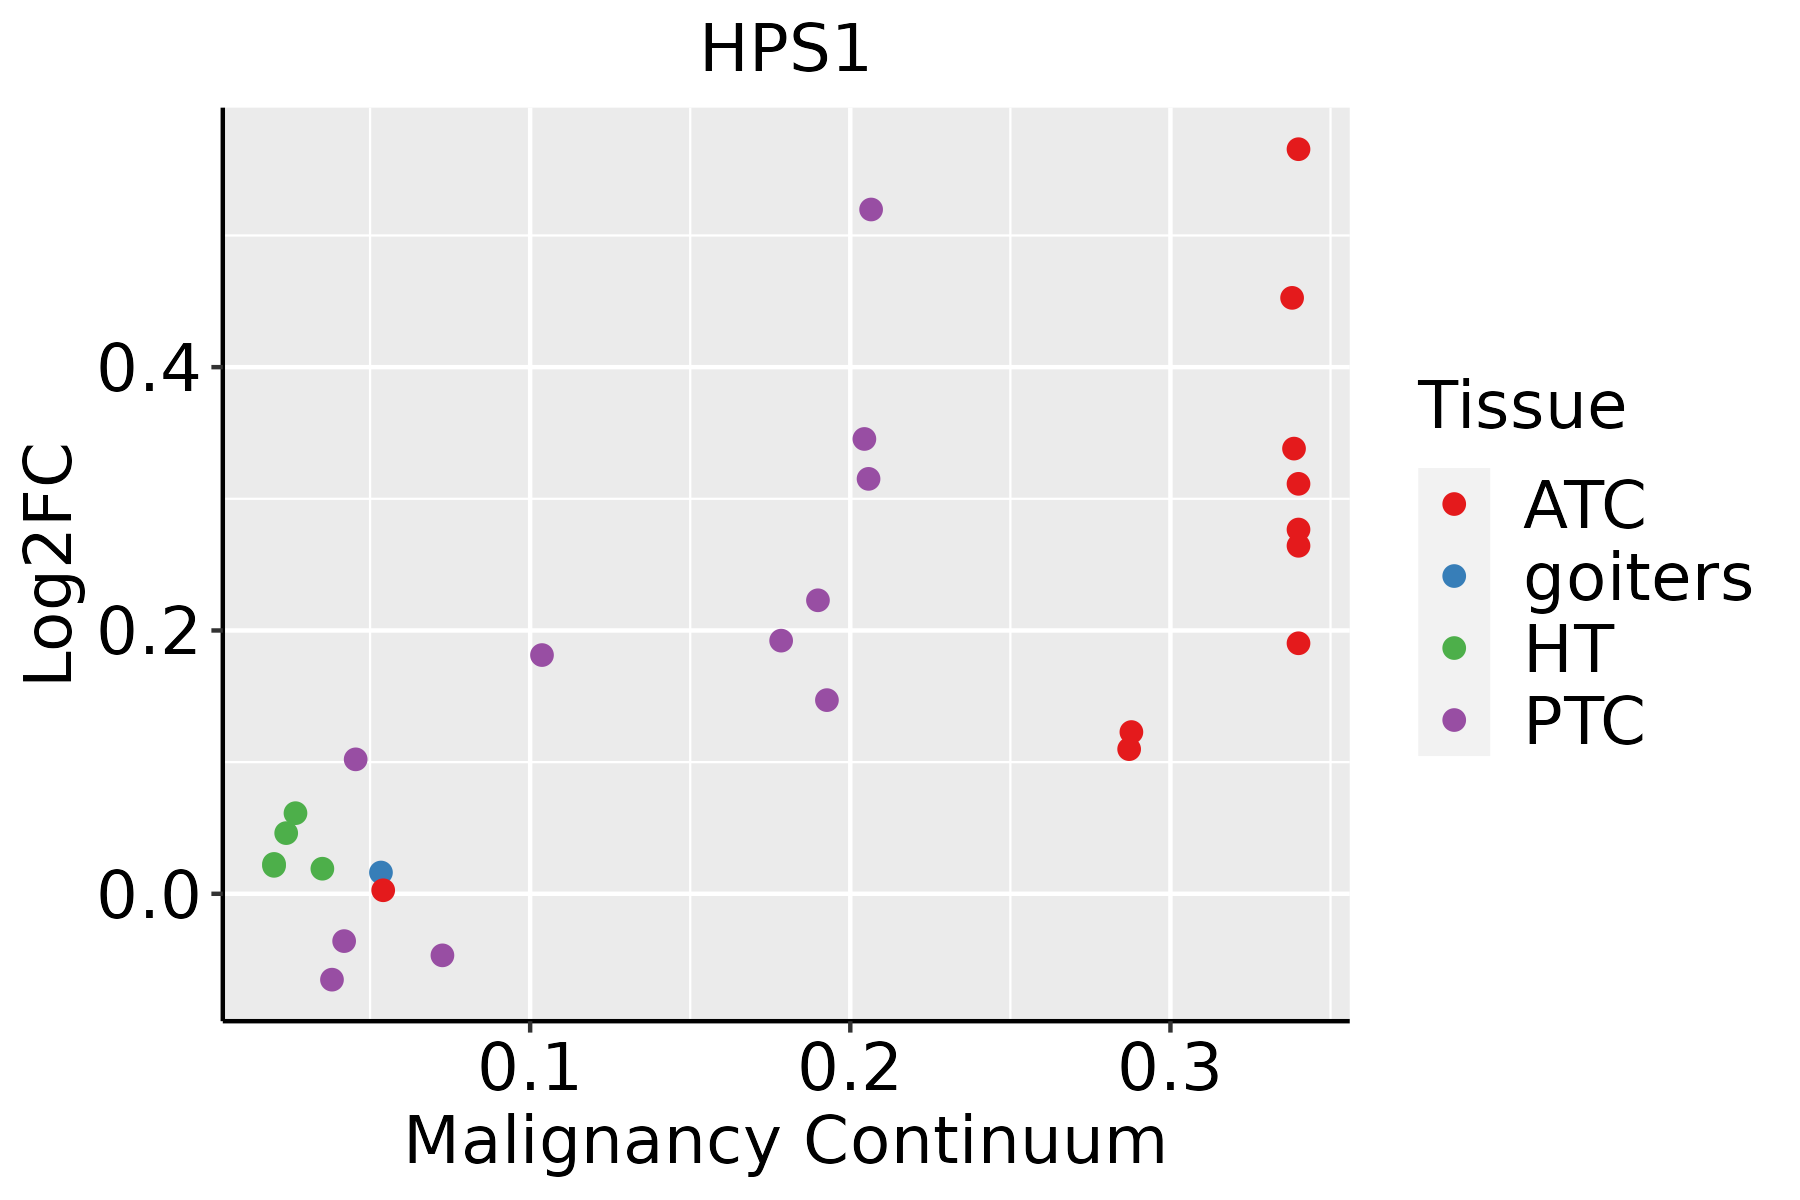 | ATC: Anaplastic thyroid cancer |
| HT: Hashimoto's thyroiditis | ||
| PTC: Papillary thyroid cancer |
| ∗log2FC in expression of this searched gene in stem-like cells from each diseased tissue sample relative to stem-like cells in normal samples in each tissue plotted against the malignancy continuum. Samples are colored based on if they are from different disease stage. |
Top |
Malignant transformation related pathway analysis |
| Find out the enriched GO biological processes and KEGG pathways involved in transition from healthy to precancer to cancer |
| Tissue | Disease Stage | Enriched GO biological Processes |
| Colorectum | AD |  |
| Colorectum | SER |  |
| Colorectum | MSS |  |
| Colorectum | MSI-H |  |
| Colorectum | FAP |  |
| ∗Top 15 enriched GO BP terms are showed in the bar plot of each disease state in each tissue. Each row represents a significant GO biological process which is colored according to the -log10(p.adjust). |
| Page: 1 2 3 4 5 6 7 8 9 |
| GO ID | Tissue | Disease Stage | Description | Gene Ratio | Bg Ratio | pvalue | p.adjust | Count |
| GO:0016050 | Colorectum | AD | vesicle organization | 101/3918 | 300/18723 | 1.65e-07 | 7.17e-06 | 101 |
| GO:0007033 | Colorectum | AD | vacuole organization | 53/3918 | 180/18723 | 4.18e-03 | 2.89e-02 | 53 |
| GO:00160501 | Colorectum | SER | vesicle organization | 69/2897 | 300/18723 | 3.59e-04 | 5.61e-03 | 69 |
| GO:00160502 | Colorectum | MSS | vesicle organization | 93/3467 | 300/18723 | 1.04e-07 | 4.97e-06 | 93 |
| GO:00070331 | Colorectum | MSS | vacuole organization | 48/3467 | 180/18723 | 4.32e-03 | 3.07e-02 | 48 |
| GO:001605014 | Esophagus | ESCC | vesicle organization | 211/8552 | 300/18723 | 2.85e-18 | 2.87e-16 | 211 |
| GO:000703314 | Esophagus | ESCC | vacuole organization | 127/8552 | 180/18723 | 1.04e-11 | 3.85e-10 | 127 |
| GO:00070403 | Esophagus | ESCC | lysosome organization | 53/8552 | 74/18723 | 5.34e-06 | 5.57e-05 | 53 |
| GO:00801713 | Esophagus | ESCC | lytic vacuole organization | 53/8552 | 74/18723 | 5.34e-06 | 5.57e-05 | 53 |
| GO:00330593 | Esophagus | ESCC | cellular pigmentation | 40/8552 | 53/18723 | 9.67e-06 | 9.21e-05 | 40 |
| GO:00487531 | Esophagus | ESCC | pigment granule organization | 23/8552 | 29/18723 | 2.25e-04 | 1.40e-03 | 23 |
| GO:00324381 | Esophagus | ESCC | melanosome organization | 22/8552 | 28/18723 | 3.95e-04 | 2.26e-03 | 22 |
| GO:00434731 | Esophagus | ESCC | pigmentation | 59/8552 | 98/18723 | 2.64e-03 | 1.12e-02 | 59 |
| GO:001605011 | Liver | Cirrhotic | vesicle organization | 133/4634 | 300/18723 | 7.35e-14 | 6.41e-12 | 133 |
| GO:00070332 | Liver | Cirrhotic | vacuole organization | 80/4634 | 180/18723 | 5.73e-09 | 2.25e-07 | 80 |
| GO:0007040 | Liver | Cirrhotic | lysosome organization | 35/4634 | 74/18723 | 2.10e-05 | 2.77e-04 | 35 |
| GO:0080171 | Liver | Cirrhotic | lytic vacuole organization | 35/4634 | 74/18723 | 2.10e-05 | 2.77e-04 | 35 |
| GO:001605021 | Liver | HCC | vesicle organization | 194/7958 | 300/18723 | 5.58e-15 | 3.97e-13 | 194 |
| GO:000703311 | Liver | HCC | vacuole organization | 119/7958 | 180/18723 | 1.22e-10 | 4.25e-09 | 119 |
| GO:00070401 | Liver | HCC | lysosome organization | 47/7958 | 74/18723 | 2.13e-04 | 1.63e-03 | 47 |
| Page: 1 2 3 |
| Pathway ID | Tissue | Disease Stage | Description | Gene Ratio | Bg Ratio | pvalue | p.adjust | qvalue | Count |
| Page: 1 |
Top |
Cell-cell communication analysis |
| Identification of potential cell-cell interactions between two cell types and their ligand-receptor pairs for different disease states |
| Ligand | Receptor | LRpair | Pathway | Tissue | Disease Stage |
| Page: 1 |
Top |
Single-cell gene regulatory network inference analysis |
| Find out the significant the regulons (TFs) and the target genes of each regulon across cell types for different disease states |
| TF | Cell Type | Tissue | Disease Stage | Target Gene | RSS | Regulon Activity |
| ∗The dot plots of a searched regulon are shown for all cell subpopulations in each disease state of each tissue based on the regulon specific score inferred using pySCENIC and by calculating the average expression. |
| Page: 1 |
Top |
Somatic mutation of malignant transformation related genes |
| Annotation of somatic variants for genes involved in malignant transformation |
| Hugo Symbol | Variant Class | Variant Classification | dbSNP RS | HGVSc | HGVSp | HGVSp Short | SWISSPROT | BIOTYPE | SIFT | PolyPhen | Tumor Sample Barcode | Tissue | Histology | Sex | Age | Stage | Therapy Types | Drugs | Outcome |
| HPS1 | SNV | Missense_Mutation | rs780626717 | c.529N>T | p.Pro177Ser | p.P177S | Q92902 | protein_coding | deleterious(0.01) | possibly_damaging(0.731) | TCGA-A2-A0SY-01 | Breast | breast invasive carcinoma | Female | <65 | III/IV | Hormone Therapy | arimidex | SD |
| HPS1 | SNV | Missense_Mutation | rs541655491 | c.1123N>C | p.Trp375Arg | p.W375R | Q92902 | protein_coding | deleterious(0) | probably_damaging(1) | TCGA-A8-A07Z-01 | Breast | breast invasive carcinoma | Female | >=65 | I/II | Unspecific | Exemestane | SD |
| HPS1 | SNV | Missense_Mutation | rs759982308 | c.403C>T | p.Arg135Trp | p.R135W | Q92902 | protein_coding | deleterious(0) | probably_damaging(1) | TCGA-AO-A128-01 | Breast | breast invasive carcinoma | Female | <65 | I/II | Chemotherapy | doxorubicin | SD |
| HPS1 | SNV | Missense_Mutation | c.191N>C | p.Lys64Thr | p.K64T | Q92902 | protein_coding | deleterious(0.01) | probably_damaging(0.999) | TCGA-C8-A132-01 | Breast | breast invasive carcinoma | Female | <65 | I/II | Unknown | Unknown | SD | |
| HPS1 | deletion | In_Frame_Del | novel | c.1200_1217delNNNNNNNNNNNNNNNNNN | p.Asp400_Leu405del | p.D400_L405del | Q92902 | protein_coding | TCGA-EW-A3U0-01 | Breast | breast invasive carcinoma | Female | <65 | III/IV | Chemotherapy | cisplatin | CR | ||
| HPS1 | SNV | Missense_Mutation | novel | c.268C>A | p.Leu90Met | p.L90M | Q92902 | protein_coding | deleterious(0) | probably_damaging(0.999) | TCGA-2W-A8YY-01 | Cervix | cervical & endocervical cancer | Female | <65 | I/II | Chemotherapy | cisplatin | CR |
| HPS1 | SNV | Missense_Mutation | rs373996305 | c.158C>T | p.Pro53Leu | p.P53L | Q92902 | protein_coding | deleterious(0) | probably_damaging(1) | TCGA-2W-A8YY-01 | Cervix | cervical & endocervical cancer | Female | <65 | I/II | Chemotherapy | cisplatin | CR |
| HPS1 | SNV | Missense_Mutation | novel | c.1900G>A | p.Asp634Asn | p.D634N | Q92902 | protein_coding | deleterious(0.02) | probably_damaging(0.985) | TCGA-AA-3939-01 | Colorectum | colon adenocarcinoma | Male | >=65 | I/II | Unknown | Unknown | SD |
| HPS1 | SNV | Missense_Mutation | c.886C>T | p.Leu296Phe | p.L296F | Q92902 | protein_coding | tolerated(0.48) | benign(0.009) | TCGA-AD-5900-01 | Colorectum | colon adenocarcinoma | Male | >=65 | I/II | Unknown | Unknown | SD | |
| HPS1 | SNV | Missense_Mutation | c.1724C>T | p.Ala575Val | p.A575V | Q92902 | protein_coding | deleterious(0) | probably_damaging(0.951) | TCGA-CK-5916-01 | Colorectum | colon adenocarcinoma | Female | >=65 | I/II | Unknown | Unknown | PD |
| Page: 1 2 3 4 5 6 |
Top |
Related drugs of malignant transformation related genes |
| Identification of chemicals and drugs interact with genes involved in malignant transfromation |
| (DGIdb 4.0) |
| Entrez ID | Symbol | Category | Interaction Types | Drug Claim Name | Drug Name | PMIDs |
| Page: 1 |

Copyright 2023-Present -The University of Texas Health Science Center at Houston |