
|
|||||
|
 | |
| |
| |
| |
| |
| |
|
Gene: HOXA10 |
Gene summary for HOXA10 |
| Gene information | Species | Human | Gene symbol | HOXA10 | Gene ID | 3206 |
| Gene name | homeobox A10 | |
| Gene Alias | HOX1 | |
| Cytomap | 7p15.2 | |
| Gene Type | protein-coding | GO ID | GO:0000003 | UniProtAcc | P31260 |
Top |
Malignant transformation analysis |
| Identification of the aberrant gene expression in precancerous and cancerous lesions by comparing the gene expression of stem-like cells in diseased tissues with normal stem cells |
| Entrez ID | Symbol | Replicates | Species | Organ | Tissue | Adj P-value | Log2FC | Malignancy |
| 3206 | HOXA10 | GSM6177621_NYU_UCEC2_lib1_lib1 | Human | Endometrium | EEC | 1.87e-14 | -2.82e-01 | -0.1934 |
| 3206 | HOXA10 | GSM6177622_NYU_UCEC3_lib1_lib1 | Human | Endometrium | EEC | 1.16e-36 | -7.08e-01 | -0.1917 |
| 3206 | HOXA10 | GSM6177622_NYU_UCEC3_lib2_lib2 | Human | Endometrium | EEC | 4.50e-40 | -6.78e-01 | -0.1916 |
| 3206 | HOXA10 | GSM6177623_NYU_UCEC3_Vis | Human | Endometrium | EEC | 4.16e-09 | -4.86e-01 | -0.1269 |
| 3206 | HOXA10 | LZE4T | Human | Esophagus | ESCC | 5.04e-06 | 2.04e-01 | 0.0811 |
| 3206 | HOXA10 | LZE5T | Human | Esophagus | ESCC | 6.93e-03 | 2.14e-01 | 0.0514 |
| 3206 | HOXA10 | LZE20T | Human | Esophagus | ESCC | 1.14e-03 | 1.67e-01 | 0.0662 |
| 3206 | HOXA10 | LZE22T | Human | Esophagus | ESCC | 4.19e-09 | 5.30e-01 | 0.068 |
| 3206 | HOXA10 | LZE24T | Human | Esophagus | ESCC | 2.10e-09 | 2.71e-01 | 0.0596 |
| 3206 | HOXA10 | LZE21T | Human | Esophagus | ESCC | 4.05e-02 | 2.91e-01 | 0.0655 |
| 3206 | HOXA10 | P2T-E | Human | Esophagus | ESCC | 1.02e-31 | 5.07e-01 | 0.1177 |
| 3206 | HOXA10 | P4T-E | Human | Esophagus | ESCC | 3.97e-30 | 6.26e-01 | 0.1323 |
| 3206 | HOXA10 | P5T-E | Human | Esophagus | ESCC | 9.44e-07 | 1.32e-01 | 0.1327 |
| 3206 | HOXA10 | P8T-E | Human | Esophagus | ESCC | 7.28e-26 | 4.70e-01 | 0.0889 |
| 3206 | HOXA10 | P9T-E | Human | Esophagus | ESCC | 1.96e-12 | 3.06e-01 | 0.1131 |
| 3206 | HOXA10 | P10T-E | Human | Esophagus | ESCC | 6.38e-31 | 4.93e-01 | 0.116 |
| 3206 | HOXA10 | P11T-E | Human | Esophagus | ESCC | 1.22e-04 | 3.54e-01 | 0.1426 |
| 3206 | HOXA10 | P12T-E | Human | Esophagus | ESCC | 3.95e-30 | 4.90e-01 | 0.1122 |
| 3206 | HOXA10 | P15T-E | Human | Esophagus | ESCC | 1.96e-05 | 1.44e-01 | 0.1149 |
| 3206 | HOXA10 | P16T-E | Human | Esophagus | ESCC | 1.00e-24 | 4.37e-01 | 0.1153 |
| Page: 1 2 3 4 5 6 |
| Tissue | Expression Dynamics | Abbreviation |
| Colorectum (GSE201348) | 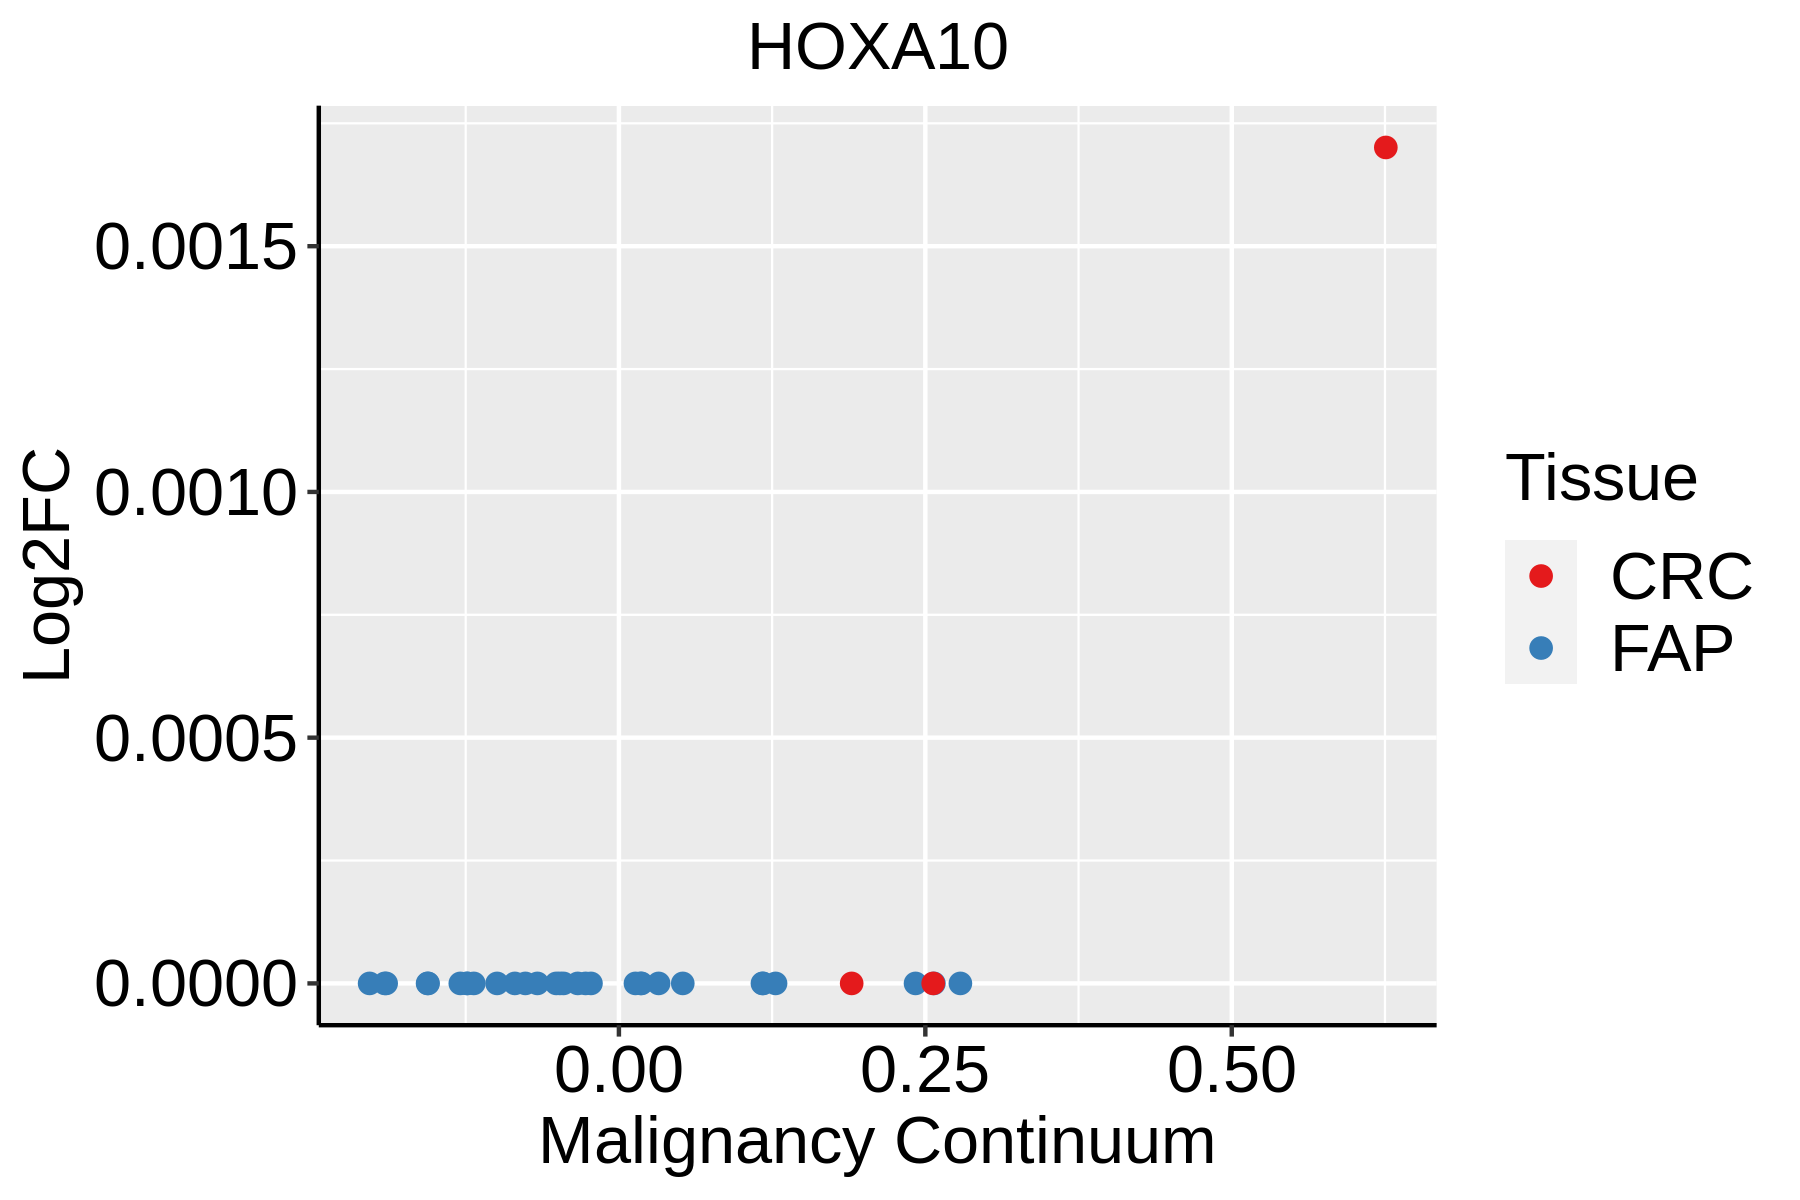 | FAP: Familial adenomatous polyposis |
| CRC: Colorectal cancer | ||
| Colorectum (HTA11) | 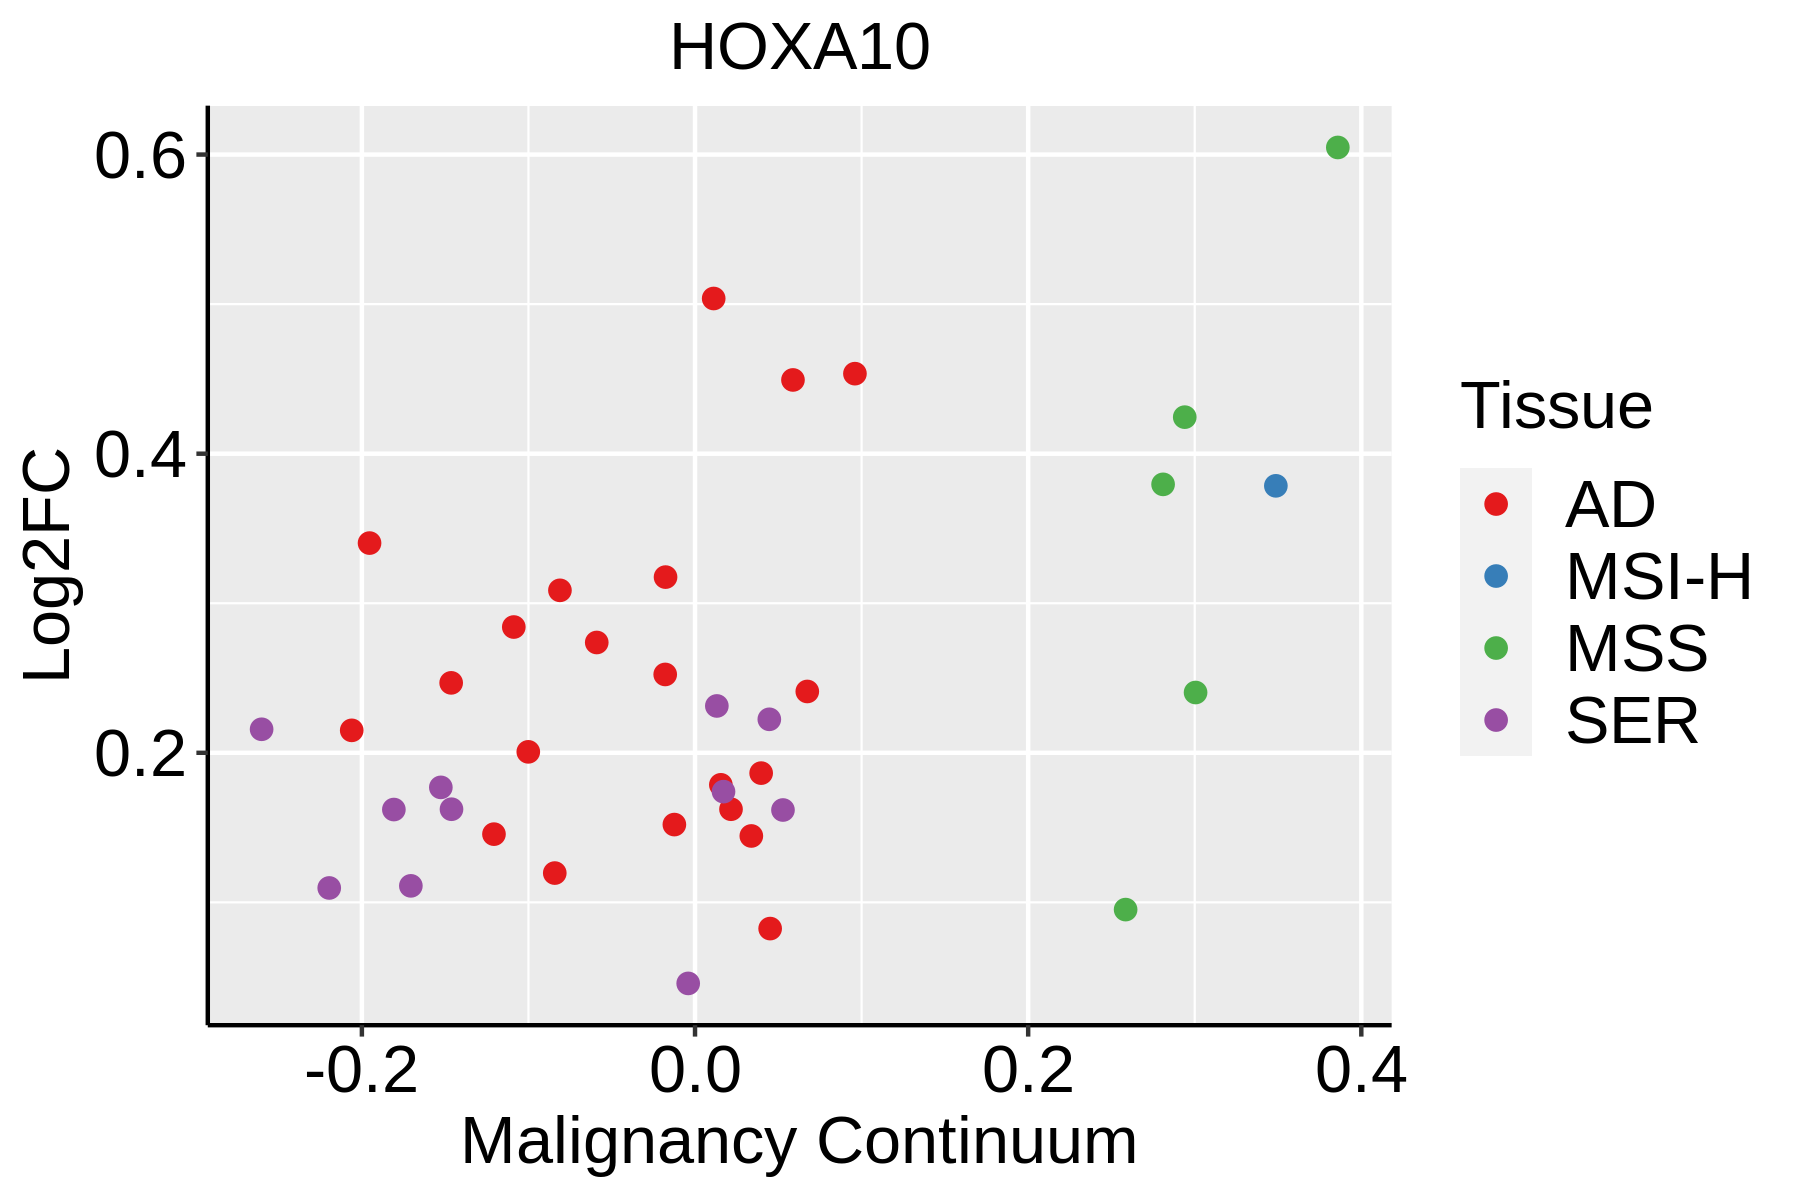 | AD: Adenomas |
| SER: Sessile serrated lesions | ||
| MSI-H: Microsatellite-high colorectal cancer | ||
| MSS: Microsatellite stable colorectal cancer | ||
| Endometrium | 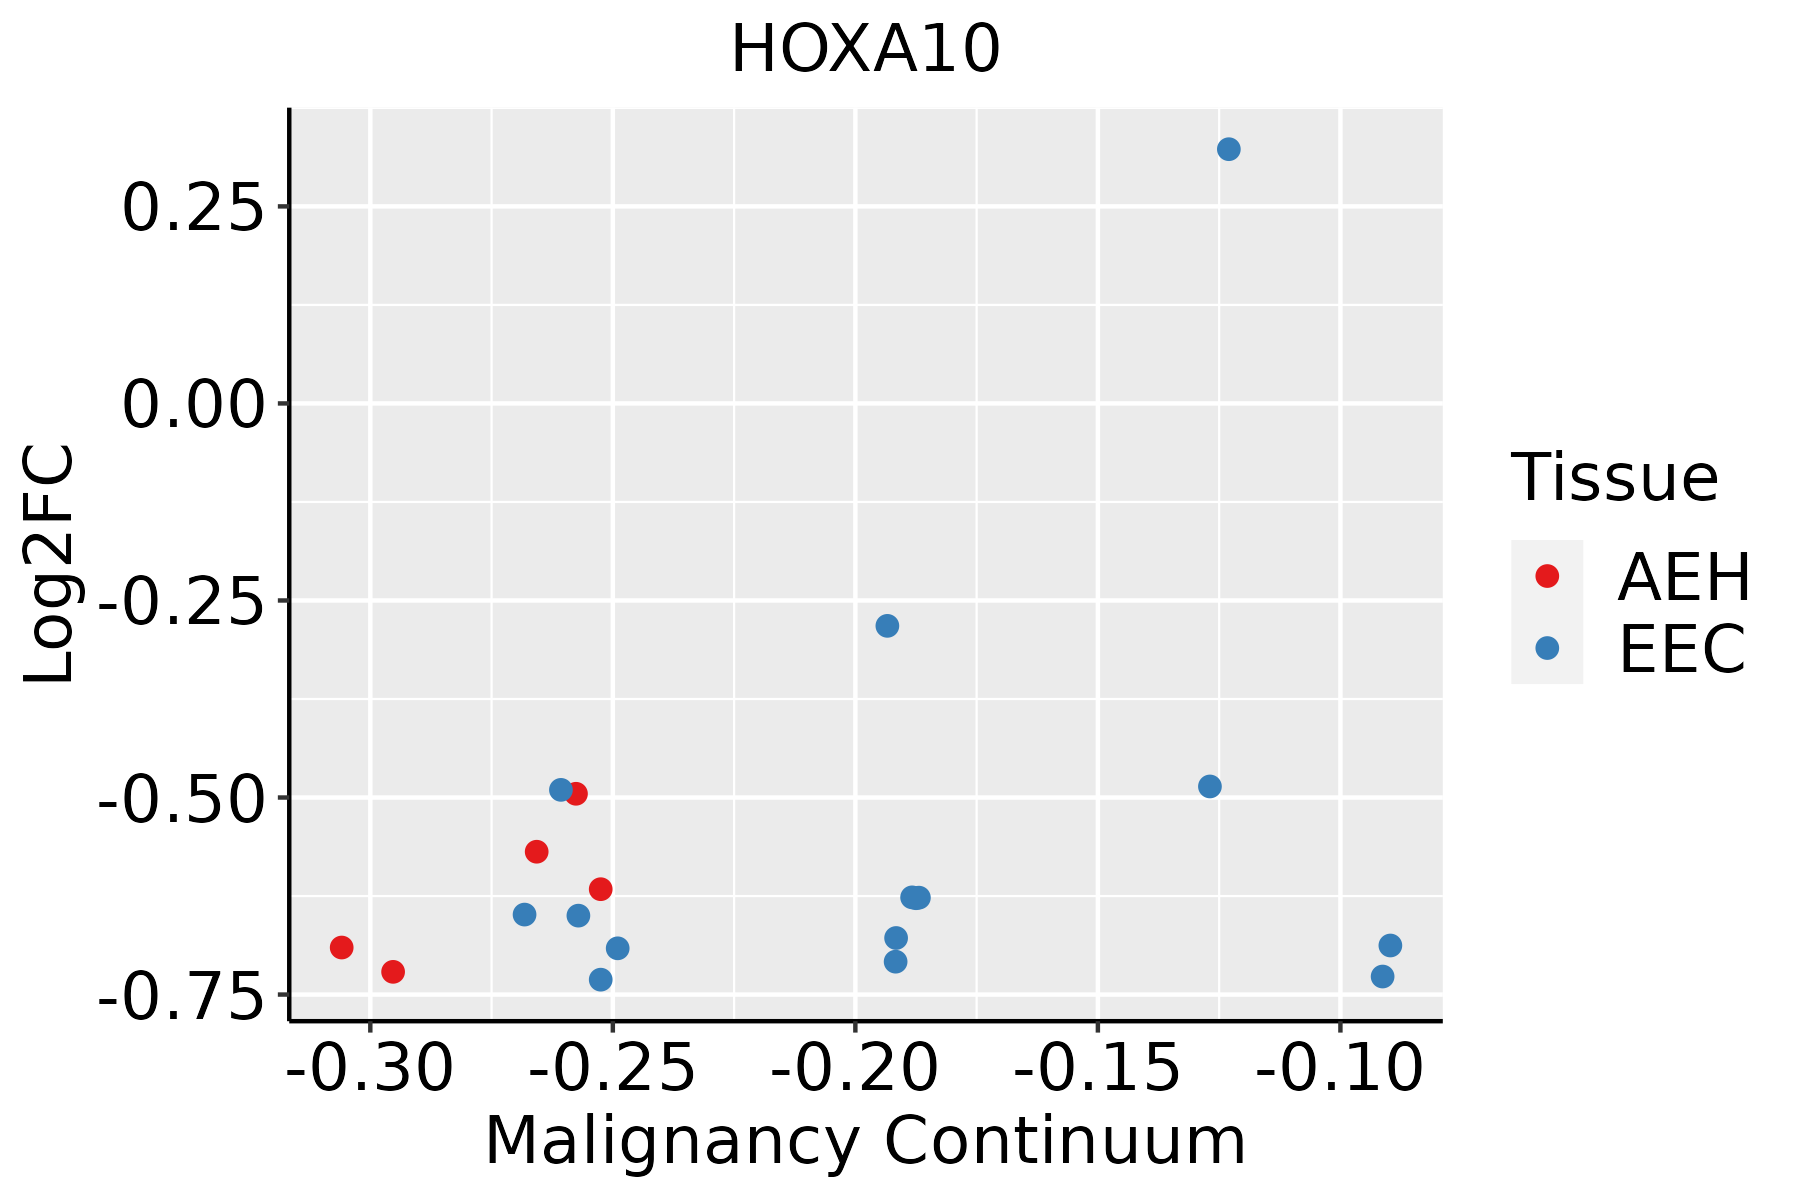 | AEH: Atypical endometrial hyperplasia |
| EEC: Endometrioid Cancer | ||
| Esophagus | 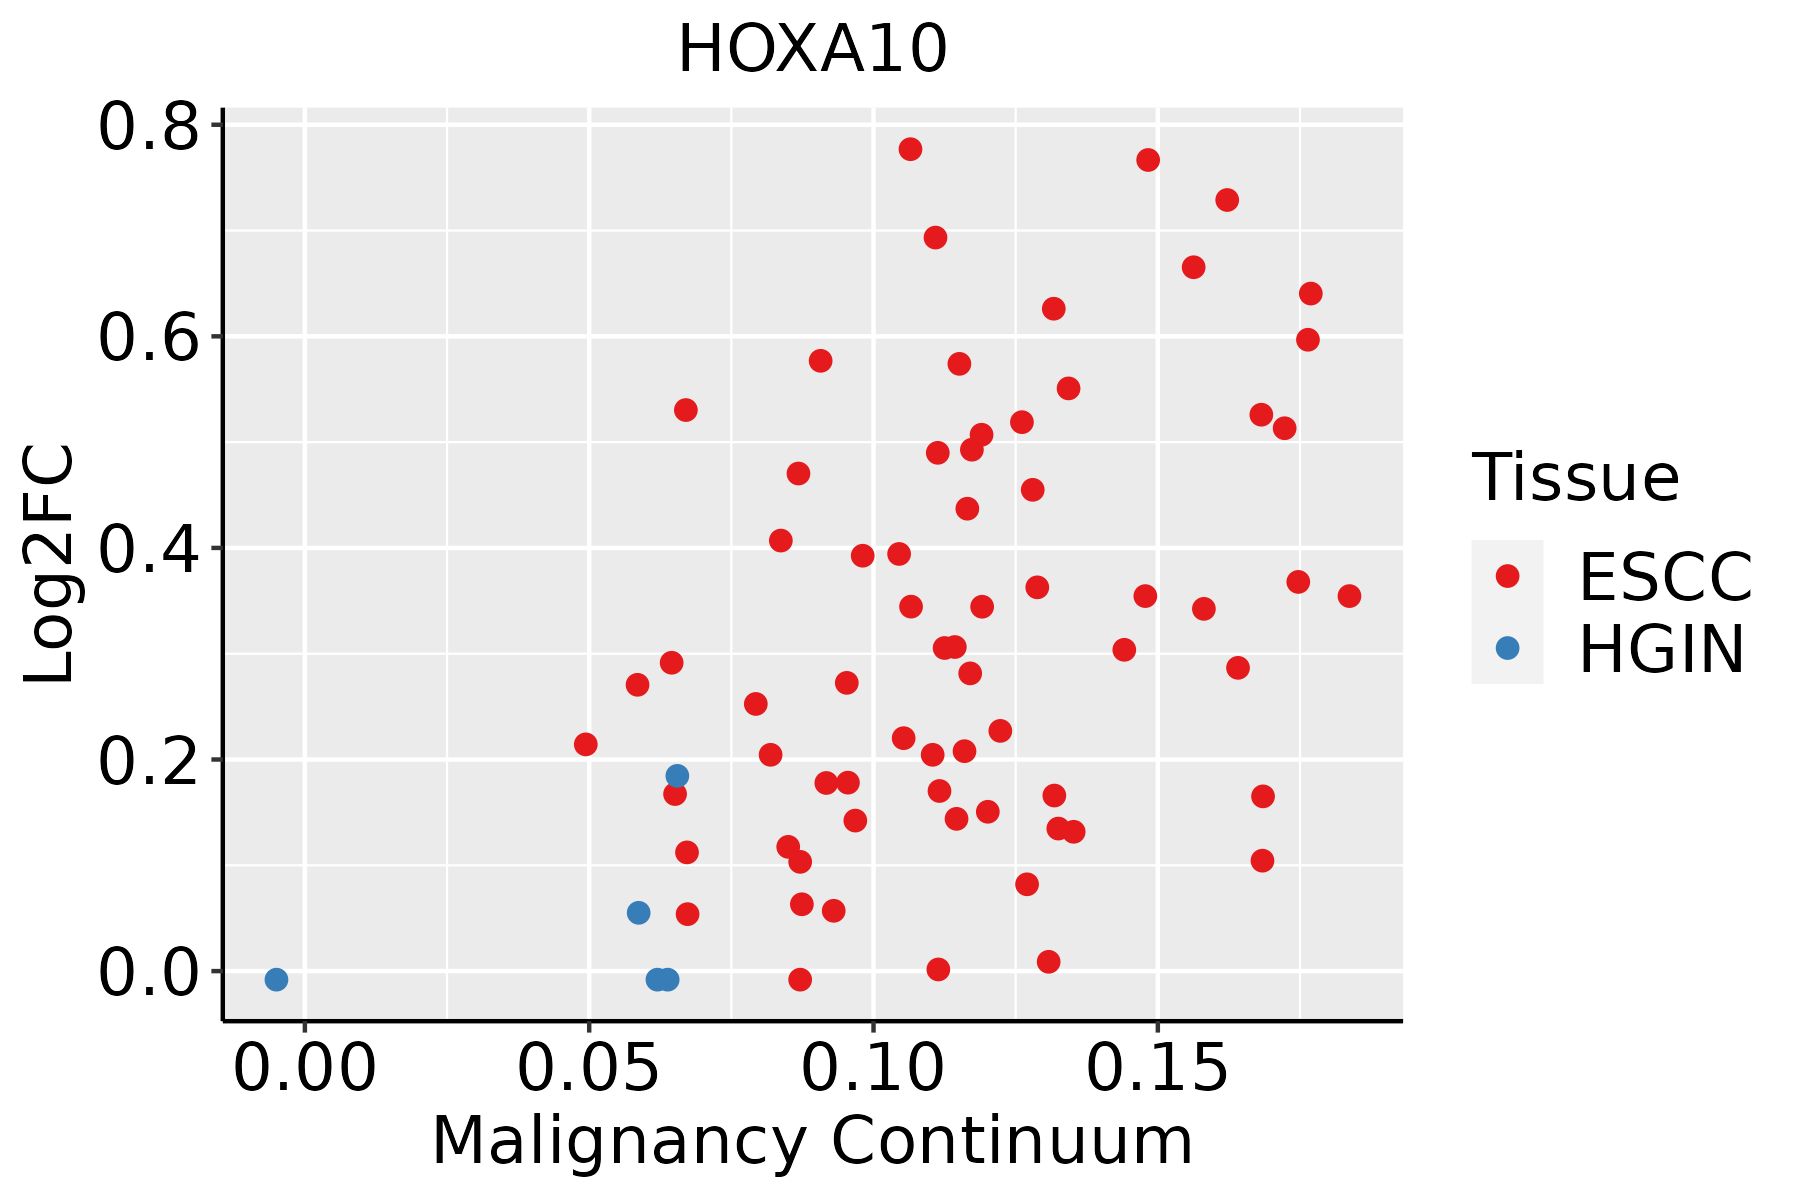 | ESCC: Esophageal squamous cell carcinoma |
| HGIN: High-grade intraepithelial neoplasias | ||
| LGIN: Low-grade intraepithelial neoplasias | ||
| Oral Cavity | 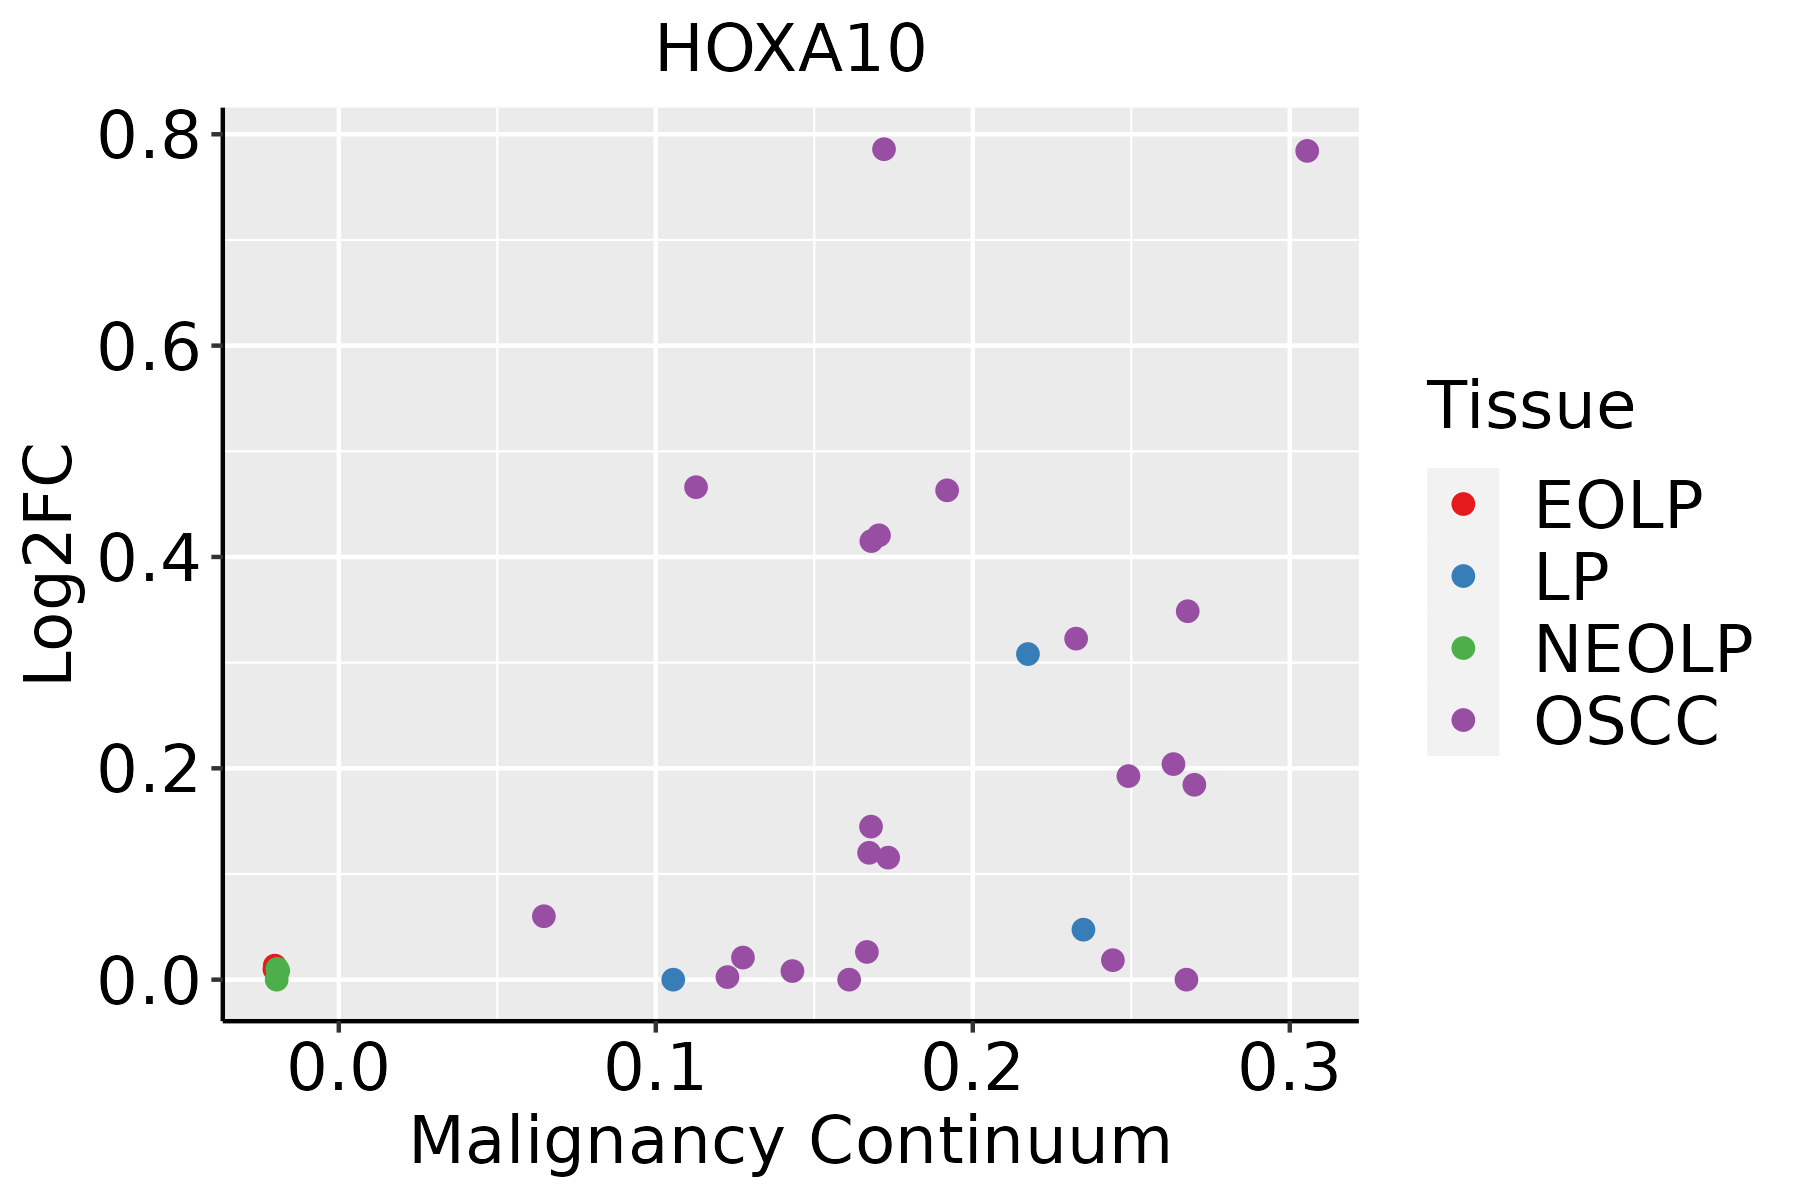 | EOLP: Erosive Oral lichen planus |
| LP: leukoplakia | ||
| NEOLP: Non-erosive oral lichen planus | ||
| OSCC: Oral squamous cell carcinoma | ||
| Prostate | 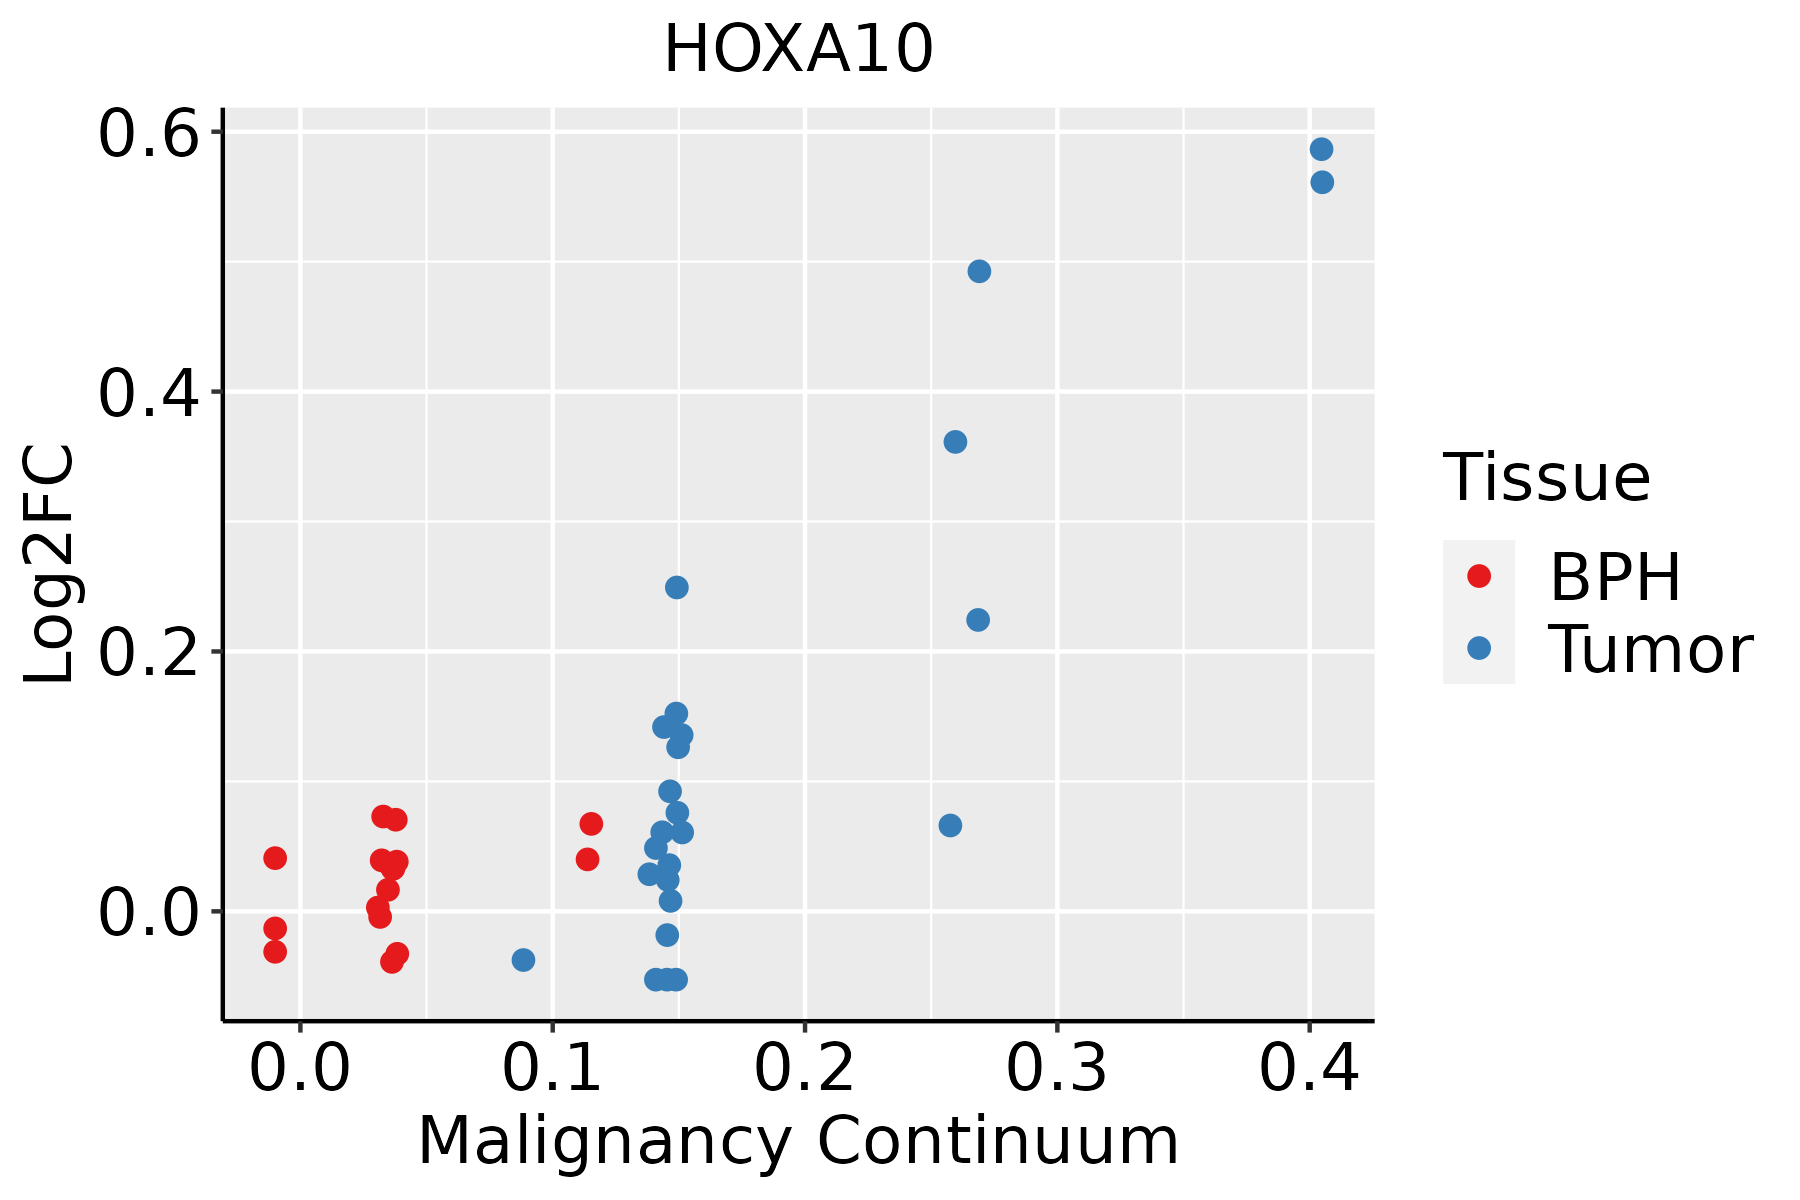 | BPH: Benign Prostatic Hyperplasia |
| Thyroid | 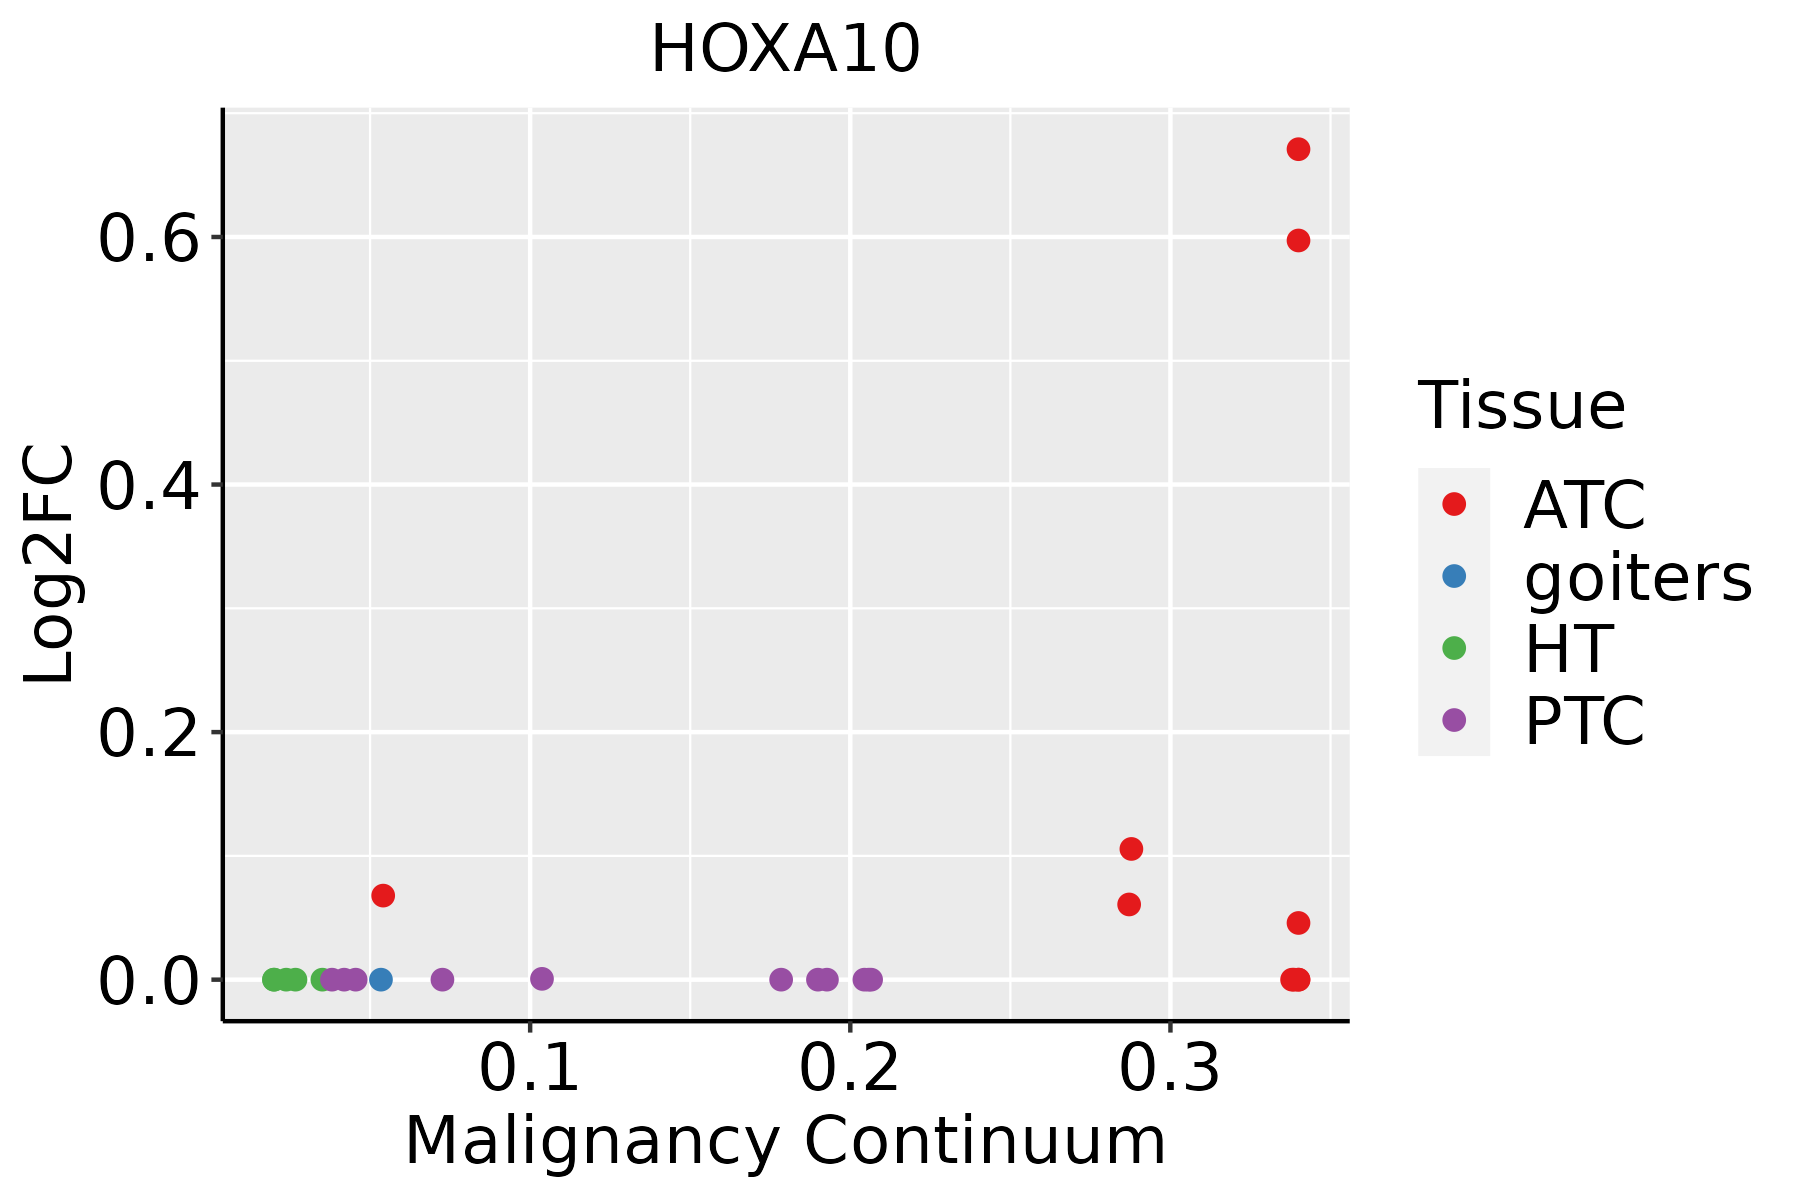 | ATC: Anaplastic thyroid cancer |
| HT: Hashimoto's thyroiditis | ||
| PTC: Papillary thyroid cancer |
| ∗log2FC in expression of this searched gene in stem-like cells from each diseased tissue sample relative to stem-like cells in normal samples in each tissue plotted against the malignancy continuum. Samples are colored based on if they are from different disease stage. |
Top |
Malignant transformation related pathway analysis |
| Find out the enriched GO biological processes and KEGG pathways involved in transition from healthy to precancer to cancer |
| Tissue | Disease Stage | Enriched GO biological Processes |
| Colorectum | AD |  |
| Colorectum | SER |  |
| Colorectum | MSS |  |
| Colorectum | MSI-H |  |
| Colorectum | FAP |  |
| ∗Top 15 enriched GO BP terms are showed in the bar plot of each disease state in each tissue. Each row represents a significant GO biological process which is colored according to the -log10(p.adjust). |
| Page: 1 2 3 4 5 6 7 8 9 |
| GO ID | Tissue | Disease Stage | Description | Gene Ratio | Bg Ratio | pvalue | p.adjust | Count |
| GO:0061458 | Colorectum | AD | reproductive system development | 116/3918 | 427/18723 | 1.11e-03 | 1.01e-02 | 116 |
| GO:0048608 | Colorectum | AD | reproductive structure development | 114/3918 | 424/18723 | 1.78e-03 | 1.47e-02 | 114 |
| GO:0048736 | Colorectum | AD | appendage development | 51/3918 | 172/18723 | 4.20e-03 | 2.89e-02 | 51 |
| GO:0060173 | Colorectum | AD | limb development | 51/3918 | 172/18723 | 4.20e-03 | 2.89e-02 | 51 |
| GO:00487361 | Colorectum | SER | appendage development | 42/2897 | 172/18723 | 1.43e-03 | 1.55e-02 | 42 |
| GO:00601731 | Colorectum | SER | limb development | 42/2897 | 172/18723 | 1.43e-03 | 1.55e-02 | 42 |
| GO:00614581 | Colorectum | SER | reproductive system development | 87/2897 | 427/18723 | 3.69e-03 | 3.07e-02 | 87 |
| GO:0035107 | Colorectum | SER | appendage morphogenesis | 33/2897 | 138/18723 | 6.10e-03 | 4.42e-02 | 33 |
| GO:0035108 | Colorectum | SER | limb morphogenesis | 33/2897 | 138/18723 | 6.10e-03 | 4.42e-02 | 33 |
| GO:00486081 | Colorectum | SER | reproductive structure development | 85/2897 | 424/18723 | 6.33e-03 | 4.56e-02 | 85 |
| GO:00614582 | Colorectum | MSS | reproductive system development | 115/3467 | 427/18723 | 9.86e-06 | 2.39e-04 | 115 |
| GO:00486082 | Colorectum | MSS | reproductive structure development | 113/3467 | 424/18723 | 1.94e-05 | 4.18e-04 | 113 |
| GO:00487362 | Colorectum | MSS | appendage development | 48/3467 | 172/18723 | 1.61e-03 | 1.46e-02 | 48 |
| GO:00601732 | Colorectum | MSS | limb development | 48/3467 | 172/18723 | 1.61e-03 | 1.46e-02 | 48 |
| GO:00614589 | Endometrium | AEH | reproductive system development | 88/2100 | 427/18723 | 9.50e-09 | 6.41e-07 | 88 |
| GO:00486089 | Endometrium | AEH | reproductive structure development | 87/2100 | 424/18723 | 1.43e-08 | 9.12e-07 | 87 |
| GO:00351073 | Endometrium | AEH | appendage morphogenesis | 29/2100 | 138/18723 | 6.06e-04 | 5.94e-03 | 29 |
| GO:00351083 | Endometrium | AEH | limb morphogenesis | 29/2100 | 138/18723 | 6.06e-04 | 5.94e-03 | 29 |
| GO:00487366 | Endometrium | AEH | appendage development | 33/2100 | 172/18723 | 1.41e-03 | 1.18e-02 | 33 |
| GO:00601736 | Endometrium | AEH | limb development | 33/2100 | 172/18723 | 1.41e-03 | 1.18e-02 | 33 |
| Page: 1 2 3 4 |
| Pathway ID | Tissue | Disease Stage | Description | Gene Ratio | Bg Ratio | pvalue | p.adjust | qvalue | Count |
| hsa052028 | Esophagus | ESCC | Transcriptional misregulation in cancer | 116/4205 | 193/8465 | 2.08e-03 | 5.95e-03 | 3.05e-03 | 116 |
| hsa0520213 | Esophagus | ESCC | Transcriptional misregulation in cancer | 116/4205 | 193/8465 | 2.08e-03 | 5.95e-03 | 3.05e-03 | 116 |
| hsa0520221 | Prostate | Tumor | Transcriptional misregulation in cancer | 59/1791 | 193/8465 | 1.22e-03 | 5.26e-03 | 3.26e-03 | 59 |
| hsa0520231 | Prostate | Tumor | Transcriptional misregulation in cancer | 59/1791 | 193/8465 | 1.22e-03 | 5.26e-03 | 3.26e-03 | 59 |
| Page: 1 |
Top |
Cell-cell communication analysis |
| Identification of potential cell-cell interactions between two cell types and their ligand-receptor pairs for different disease states |
| Ligand | Receptor | LRpair | Pathway | Tissue | Disease Stage |
| Page: 1 |
Top |
Single-cell gene regulatory network inference analysis |
| Find out the significant the regulons (TFs) and the target genes of each regulon across cell types for different disease states |
| TF | Cell Type | Tissue | Disease Stage | Target Gene | RSS | Regulon Activity |
| HOXA10 | INCAF | Breast | DCIS | ASPN,IL15RA,BNC2, etc. | 9.71e-02 |  |
| HOXA10 | ECM | Breast | Healthy | ASPN,IL15RA,BNC2, etc. | 3.40e-01 |  |
| HOXA10 | INCAF | Breast | Healthy | ASPN,IL15RA,BNC2, etc. | 1.32e-01 | |
| HOXA10 | INCAF | Breast | IDC | ASPN,IL15RA,BNC2, etc. | 5.49e-01 |  |
| HOXA10 | INCAF | Endometrium | ADJ | HOXA11,SFRP4,COL1A1, etc. | 6.29e-01 |  |
| HOXA10 | INCAF | Endometrium | AEH | HOXA11,SFRP4,COL1A1, etc. | 5.96e-01 |  |
| HOXA10 | INCAF | Endometrium | EEC | HOXA11,SFRP4,COL1A1, etc. | 4.18e-01 |  |
| HOXA10 | FIB | Endometrium | EEC | HOXA11,SFRP4,COL1A1, etc. | 3.61e-02 | |
| HOXA10 | INCAF | Endometrium | Healthy | HOXA11,SFRP4,COL1A1, etc. | 5.22e-01 |  |
| HOXA10 | MDSCs | Esophagus | ESCC | NDUFAF6,PHF1,DYRK4, etc. | 1.16e-01 |  |
| ∗The dot plots of a searched regulon are shown for all cell subpopulations in each disease state of each tissue based on the regulon specific score inferred using pySCENIC and by calculating the average expression. |
| Page: 1 2 |
Top |
Somatic mutation of malignant transformation related genes |
| Annotation of somatic variants for genes involved in malignant transformation |
| Hugo Symbol | Variant Class | Variant Classification | dbSNP RS | HGVSc | HGVSp | HGVSp Short | SWISSPROT | BIOTYPE | SIFT | PolyPhen | Tumor Sample Barcode | Tissue | Histology | Sex | Age | Stage | Therapy Types | Drugs | Outcome |
| HOXA10 | insertion | Frame_Shift_Ins | novel | c.974_975insCAAAT | p.Glu325AspfsTer3 | p.E325Dfs*3 | P31260 | protein_coding | TCGA-AN-A0AK-01 | Breast | breast invasive carcinoma | Female | >=65 | I/II | Unknown | Unknown | SD | ||
| HOXA10 | SNV | Missense_Mutation | novel | c.77C>T | p.Ala26Val | p.A26V | P31260 | protein_coding | deleterious(0.01) | probably_damaging(0.949) | TCGA-2W-A8YY-01 | Cervix | cervical & endocervical cancer | Female | <65 | I/II | Chemotherapy | cisplatin | CR |
| HOXA10 | SNV | Missense_Mutation | novel | c.617N>A | p.Ser206Asn | p.S206N | P31260 | protein_coding | tolerated(0.51) | benign(0) | TCGA-C5-A902-01 | Cervix | cervical & endocervical cancer | Female | <65 | I/II | Chemotherapy | cisplatin | SD |
| HOXA10 | SNV | Missense_Mutation | novel | c.1048G>A | p.Glu350Lys | p.E350K | P31260 | protein_coding | deleterious(0) | probably_damaging(1) | TCGA-VS-A9UU-01 | Cervix | cervical & endocervical cancer | Female | <65 | I/II | Chemotherapy | cisplatin | CR |
| HOXA10 | SNV | Missense_Mutation | novel | c.498G>T | p.Glu166Asp | p.E166D | P31260 | protein_coding | deleterious(0) | probably_damaging(0.987) | TCGA-CA-6717-01 | Colorectum | colon adenocarcinoma | Male | <65 | I/II | Chemotherapy | oxaliplatin | CR |
| HOXA10 | SNV | Missense_Mutation | c.1174N>C | p.Lys392Gln | p.K392Q | P31260 | protein_coding | deleterious(0) | probably_damaging(1) | TCGA-CK-6746-01 | Colorectum | colon adenocarcinoma | Female | >=65 | I/II | Unknown | Unknown | SD | |
| HOXA10 | SNV | Missense_Mutation | novel | c.1186C>G | p.Arg396Gly | p.R396G | P31260 | protein_coding | deleterious(0) | probably_damaging(0.995) | TCGA-A5-A0G1-01 | Endometrium | uterine corpus endometrioid carcinoma | Female | >=65 | I/II | Unknown | Unknown | SD |
| HOXA10 | SNV | Missense_Mutation | novel | c.1094G>A | p.Arg365Gln | p.R365Q | P31260 | protein_coding | deleterious(0) | probably_damaging(1) | TCGA-A5-A0G2-01 | Endometrium | uterine corpus endometrioid carcinoma | Female | <65 | III/IV | Unknown | Unknown | SD |
| HOXA10 | SNV | Missense_Mutation | c.1079A>G | p.Tyr360Cys | p.Y360C | P31260 | protein_coding | deleterious(0) | probably_damaging(1) | TCGA-AP-A051-01 | Endometrium | uterine corpus endometrioid carcinoma | Female | >=65 | I/II | Unknown | Unknown | SD | |
| HOXA10 | SNV | Missense_Mutation | novel | c.1176N>T | p.Lys392Asn | p.K392N | P31260 | protein_coding | deleterious(0) | probably_damaging(1) | TCGA-AP-A1DV-01 | Endometrium | uterine corpus endometrioid carcinoma | Female | <65 | I/II | Unknown | Unknown | SD |
| Page: 1 2 3 4 |
Top |
Related drugs of malignant transformation related genes |
| Identification of chemicals and drugs interact with genes involved in malignant transfromation |
| (DGIdb 4.0) |
| Entrez ID | Symbol | Category | Interaction Types | Drug Claim Name | Drug Name | PMIDs |
| Page: 1 |

Copyright 2023-Present -The University of Texas Health Science Center at Houston |