Schematic overview of the cellular and molecular mechanisms involved in the cancer progression, including the proposed cellular and molecular mechanisms in cancer cells trajectory. AT1: alveolar type 1 cells; AT2: alveolar type 2 cells; AAH: atypical adenomatous hyperplasia; AIS: adenocarcinoma in situ; MIA: minimally invasive adenocarcinoma; IA: invasive adenocarcinoma; EMT: epithelial-mesenchymal transition

Home

Download

Statistics

Help

Contact

Center for Computational Systems Medicine
leaf

Gene summary

leaf

Malignant transformation analysis

leaf

Malignant transformation related pathway analysis

leaf

Cell-cell communication analysis

leaf

Single-cell gene regulatory network inference analysis

leaf

Somatic mutation of malignant transformation related genes

leaf

Related drugs of malignant transformation related genes

Gene: HN1

Gene summary for HN1

check button Gene summary.

Gene informationSpeciesHuman
Gene symbol

HN1

Gene ID

51155

Gene nameJupiter microtubule associated homolog 1
Gene AliasARM2
Cytomap17q25.1
Gene Typeprotein-coding
GO ID

GO:0005575

UniProtAcc

Q9UK76


Top

Malignant transformation analysis

check button Identification of the aberrant gene expression in precancerous and cancerous lesions by comparing the gene expression of stem-like cells in diseased tissues with normal stem cells
check button Malignant transformation involving gene list.
Entrez IDSymbolReplicatesSpeciesOrganTissueAdj P-valueLog2FCMalignancy
51155HN1P2HumanBreastIDC4.78e-04-2.03e-010.21
51155HN1DCIS2HumanBreastDCIS6.25e-09-2.03e-010.0085
51155HN1HTA11_99999970781_79442HumanColorectumMSS3.23e-397.38e-010.294
51155HN1HTA11_99999965062_69753HumanColorectumMSI-H5.11e-131.14e+000.3487
51155HN1HTA11_99999965104_69814HumanColorectumMSS1.34e-288.09e-010.281
51155HN1HTA11_99999971662_82457HumanColorectumMSS1.20e-621.07e+000.3859
51155HN1HTA11_99999973899_84307HumanColorectumMSS2.25e-411.13e+000.2585
51155HN1HTA11_99999974143_84620HumanColorectumMSS6.22e-418.00e-010.3005
51155HN1LZE4THumanEsophagusESCC1.36e-02-3.77e-010.0811
51155HN1LZE8THumanEsophagusESCC3.97e-02-3.77e-010.067
51155HN1LZE20THumanEsophagusESCC3.31e-02-3.77e-010.0662
51155HN1LZE24THumanEsophagusESCC1.27e-04-3.77e-010.0596
51155HN1P1T-EHumanEsophagusESCC9.88e-141.23e+000.0875
51155HN1P2T-EHumanEsophagusESCC6.52e-421.27e+000.1177
51155HN1P4T-EHumanEsophagusESCC2.95e-692.25e+000.1323
51155HN1P5T-EHumanEsophagusESCC1.00e-782.18e+000.1327
51155HN1P8T-EHumanEsophagusESCC6.01e-441.41e+000.0889
51155HN1P9T-EHumanEsophagusESCC1.29e-652.05e+000.1131
51155HN1P10T-EHumanEsophagusESCC1.92e-952.37e+000.116
51155HN1P11T-EHumanEsophagusESCC6.39e-282.50e+000.1426
Page: 1 2 3 4 5 6 7 8 9 10 11 

check button Transcriptomic changes along malignancy continuum.
TissueExpression DynamicsAbbreviation
BreastThe image shows the transcriptomic changes along malignancy continuum.log2FC in expression of this searched gene in stem-like cells from each diseased tissue sample relative to stem-like cells in normal samples in each tissue plotted against the malignancy continuum. Samples are colored based on if they are from different disease stage.
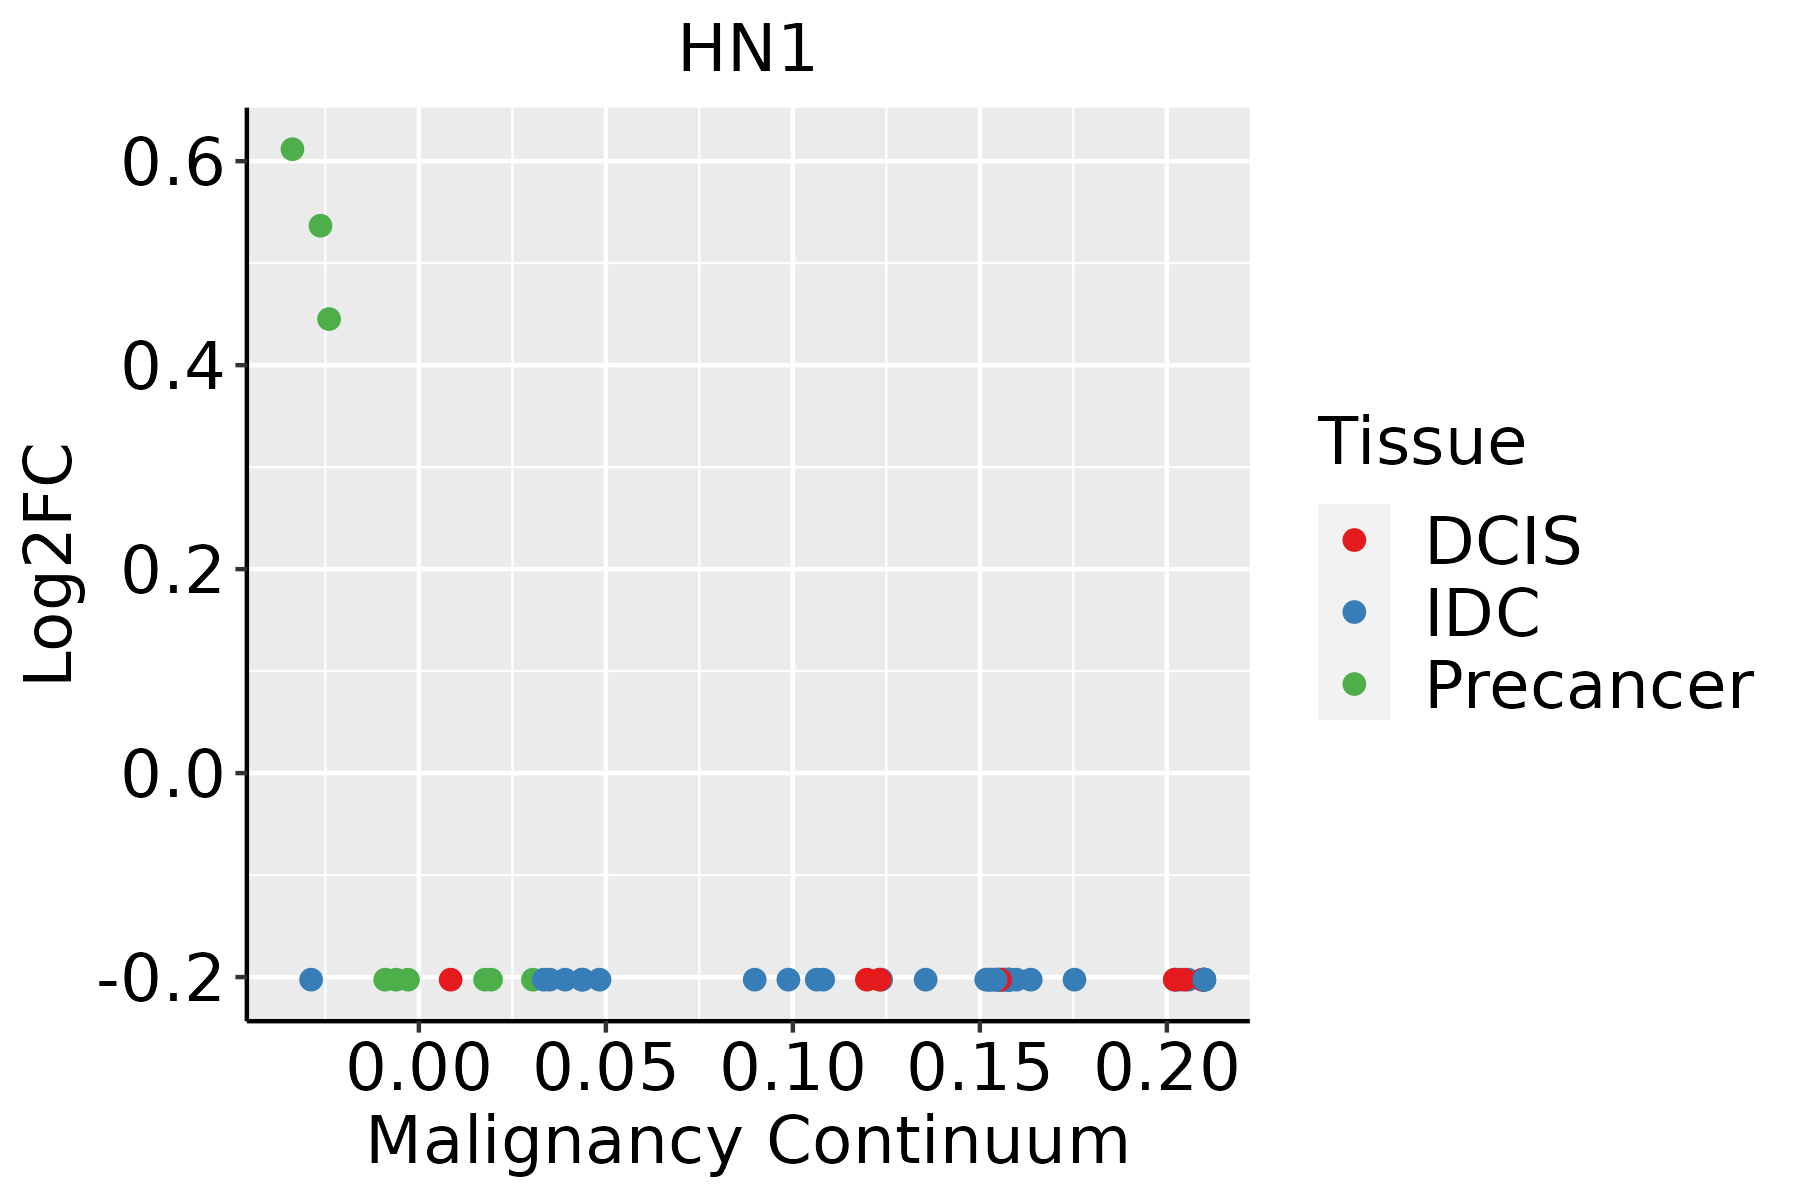
IDC: Invasive ductal carcinoma
DCIS: Ductal carcinoma in situ
Precancer(BRCA1-mut): Precancerous lesion from BRCA1 mutation carriers
Colorectum (GSE201348)The image shows the transcriptomic changes along malignancy continuum.log2FC in expression of this searched gene in stem-like cells from each diseased tissue sample relative to stem-like cells in normal samples in each tissue plotted against the malignancy continuum. Samples are colored based on if they are from different disease stage.FAP: Familial adenomatous polyposis
CRC: Colorectal cancer
Colorectum (HTA11)The image shows the transcriptomic changes along malignancy continuum.log2FC in expression of this searched gene in stem-like cells from each diseased tissue sample relative to stem-like cells in normal samples in each tissue plotted against the malignancy continuum. Samples are colored based on if they are from different disease stage.AD: Adenomas
SER: Sessile serrated lesions
MSI-H: Microsatellite-high colorectal cancer
MSS: Microsatellite stable colorectal cancer
EsophagusThe image shows the transcriptomic changes along malignancy continuum.log2FC in expression of this searched gene in stem-like cells from each diseased tissue sample relative to stem-like cells in normal samples in each tissue plotted against the malignancy continuum. Samples are colored based on if they are from different disease stage.
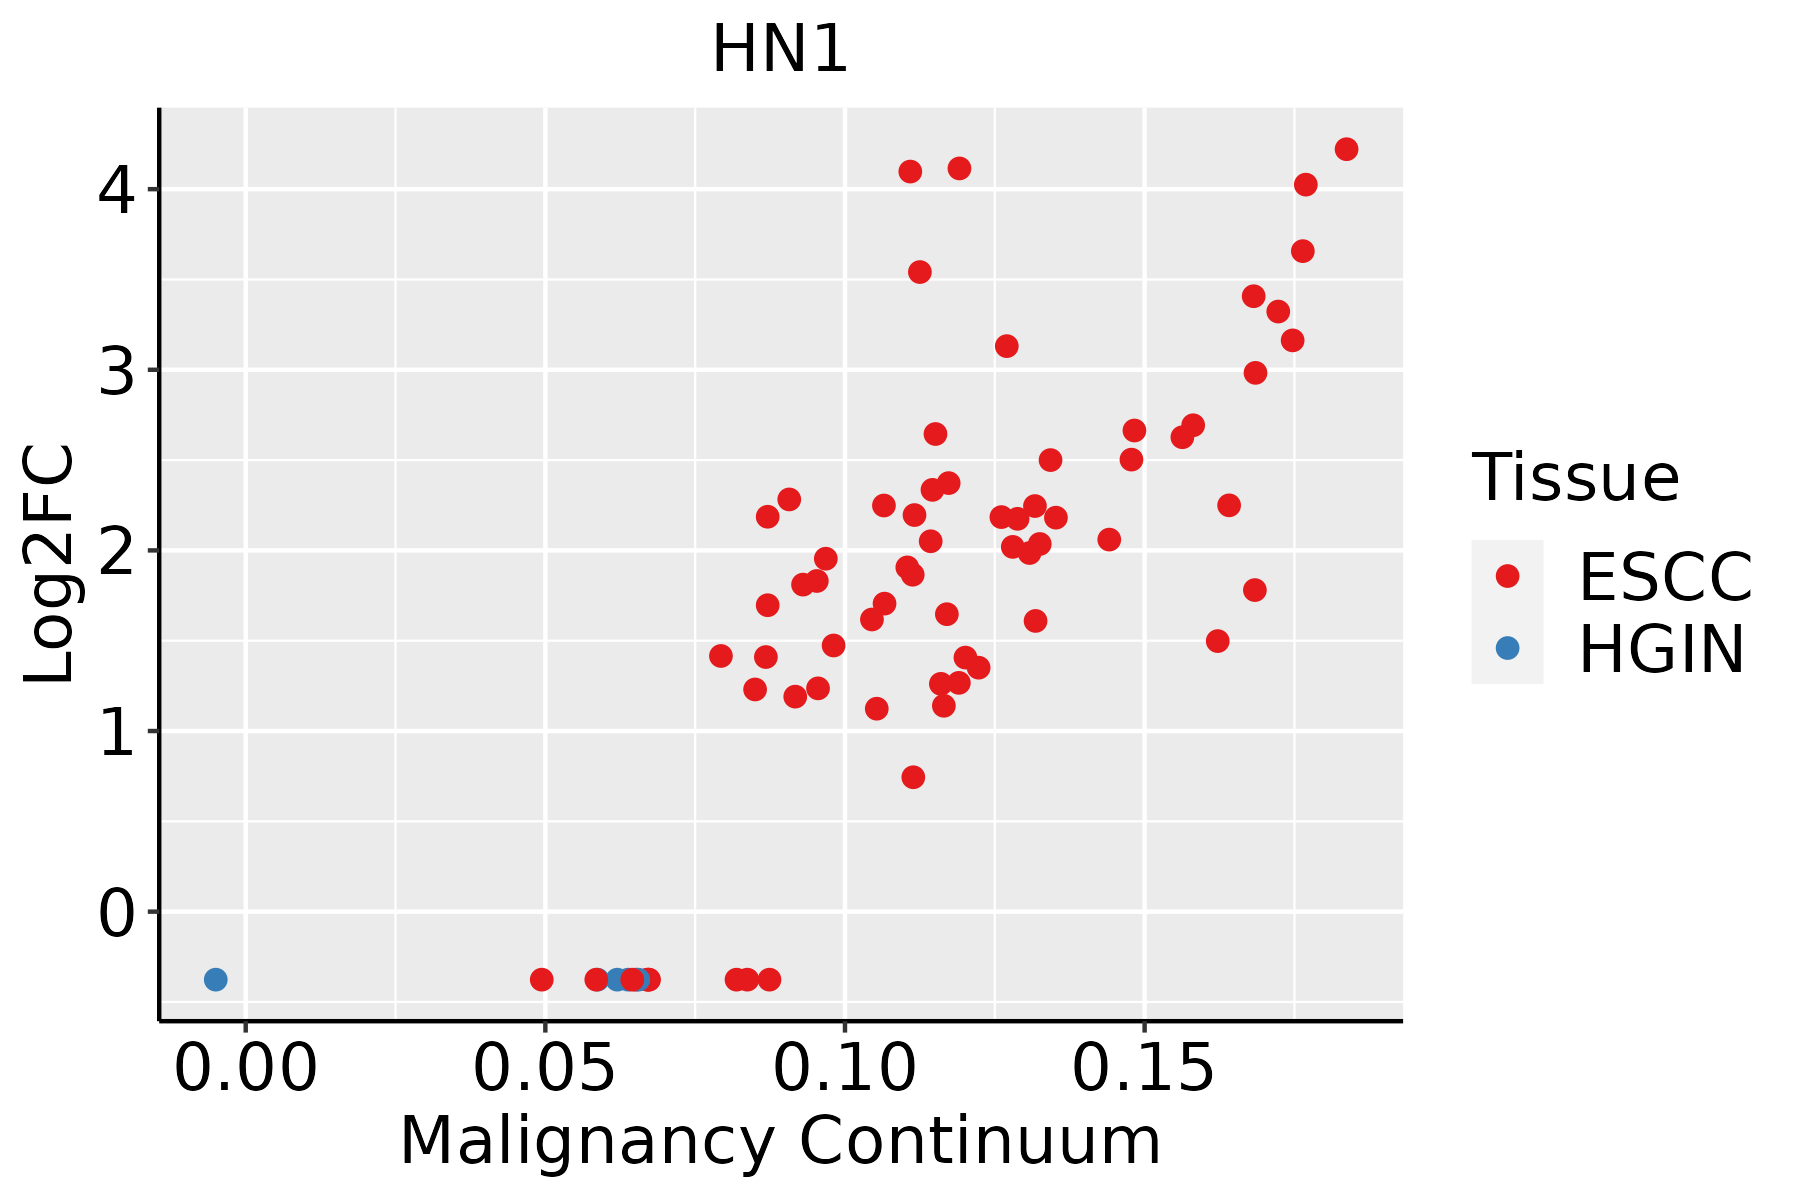
ESCC: Esophageal squamous cell carcinoma
HGIN: High-grade intraepithelial neoplasias
LGIN: Low-grade intraepithelial neoplasias
GCThe image shows the transcriptomic changes along malignancy continuum.log2FC in expression of this searched gene in stem-like cells from each diseased tissue sample relative to stem-like cells in normal samples in each tissue plotted against the malignancy continuum. Samples are colored based on if they are from different disease stage.CAG: Chronic atrophic gastritis
CAG with IM: Chronic atrophic gastritis with intestinal metaplasia
CSG: Chronic superficial gastritis
GC: Gastric cancer
SIM: Severe intestinal metaplasia
WIM: Wild intestinal metaplasia
LiverThe image shows the transcriptomic changes along malignancy continuum.log2FC in expression of this searched gene in stem-like cells from each diseased tissue sample relative to stem-like cells in normal samples in each tissue plotted against the malignancy continuum. Samples are colored based on if they are from different disease stage.
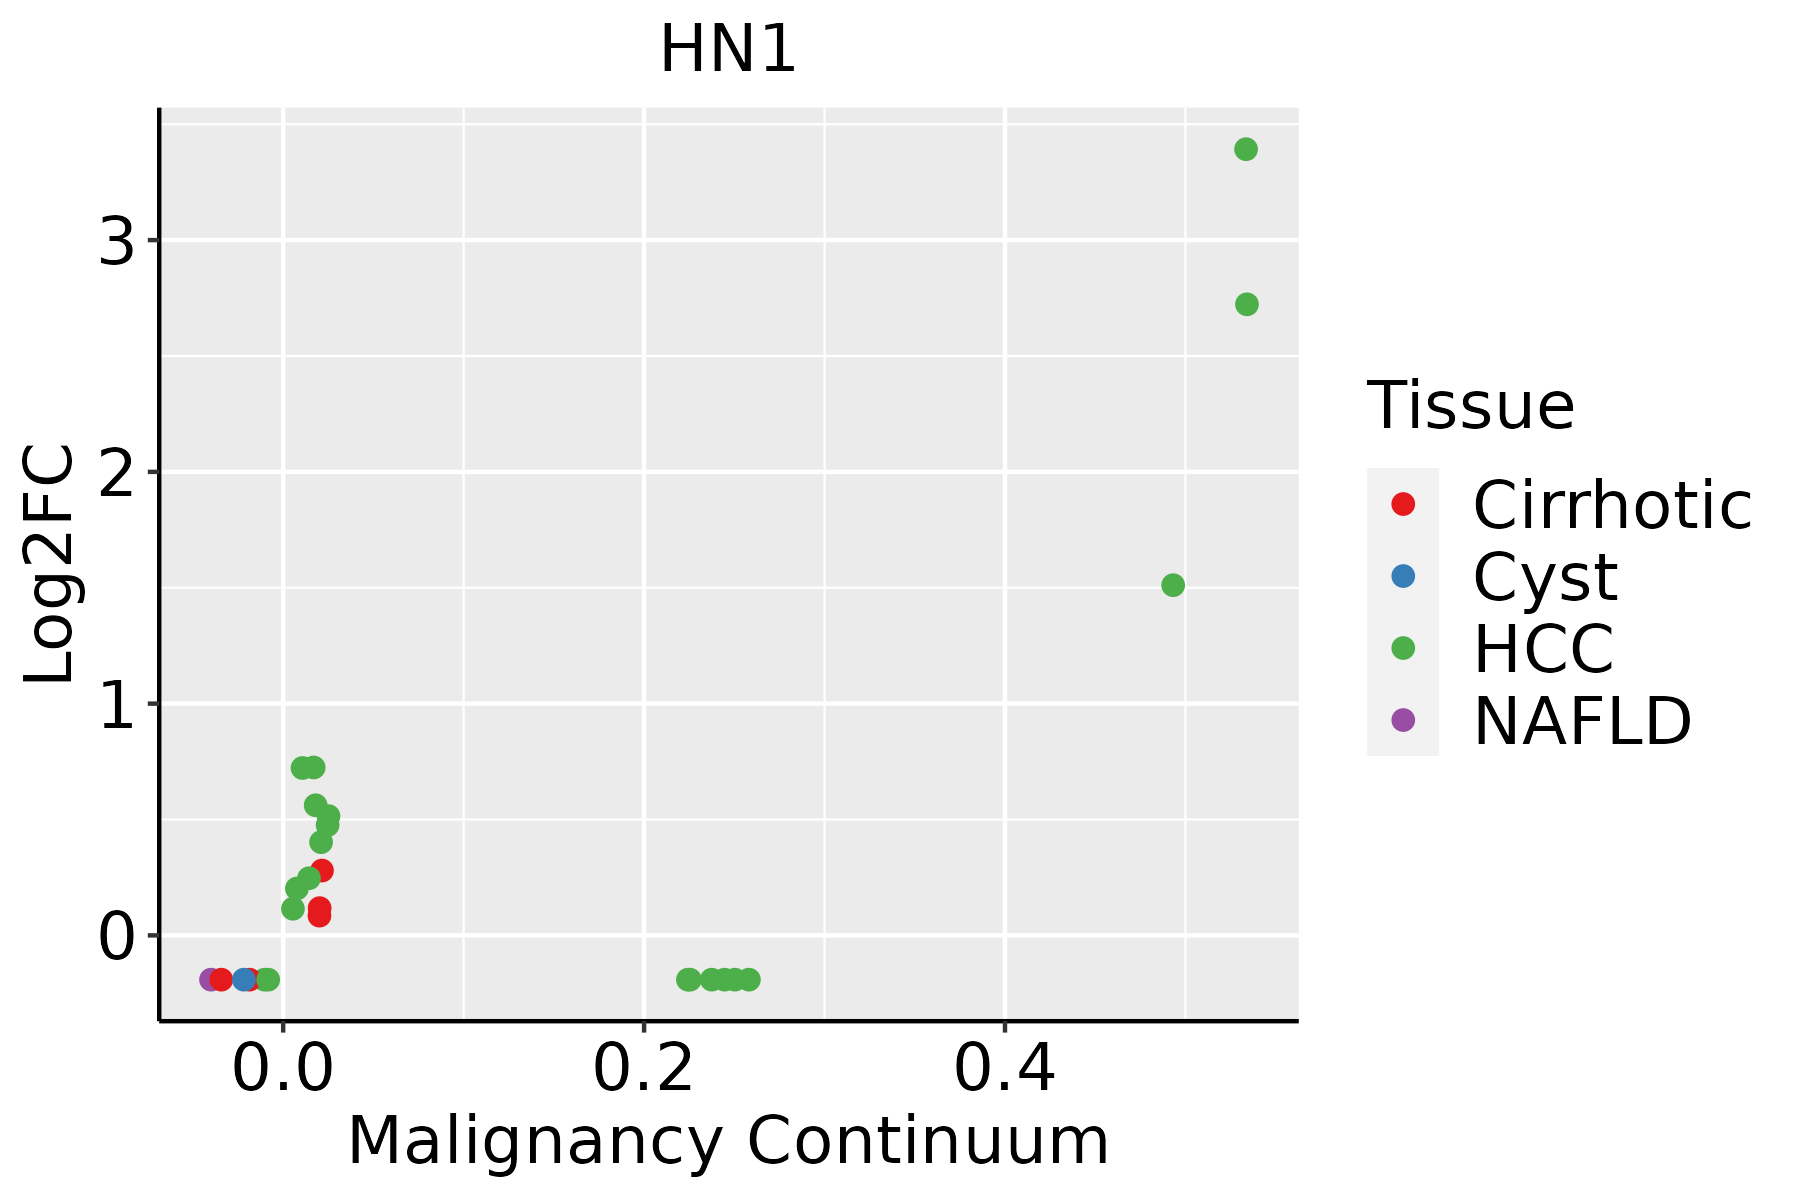
HCC: Hepatocellular carcinoma
NAFLD: Non-alcoholic fatty liver disease
Oral CavityThe image shows the transcriptomic changes along malignancy continuum.log2FC in expression of this searched gene in stem-like cells from each diseased tissue sample relative to stem-like cells in normal samples in each tissue plotted against the malignancy continuum. Samples are colored based on if they are from different disease stage.EOLP: Erosive Oral lichen planus
LP: leukoplakia
NEOLP: Non-erosive oral lichen planus
OSCC: Oral squamous cell carcinoma
ProstateThe image shows the transcriptomic changes along malignancy continuum.log2FC in expression of this searched gene in stem-like cells from each diseased tissue sample relative to stem-like cells in normal samples in each tissue plotted against the malignancy continuum. Samples are colored based on if they are from different disease stage.BPH: Benign Prostatic Hyperplasia
SkinThe image shows the transcriptomic changes along malignancy continuum.log2FC in expression of this searched gene in stem-like cells from each diseased tissue sample relative to stem-like cells in normal samples in each tissue plotted against the malignancy continuum. Samples are colored based on if they are from different disease stage.
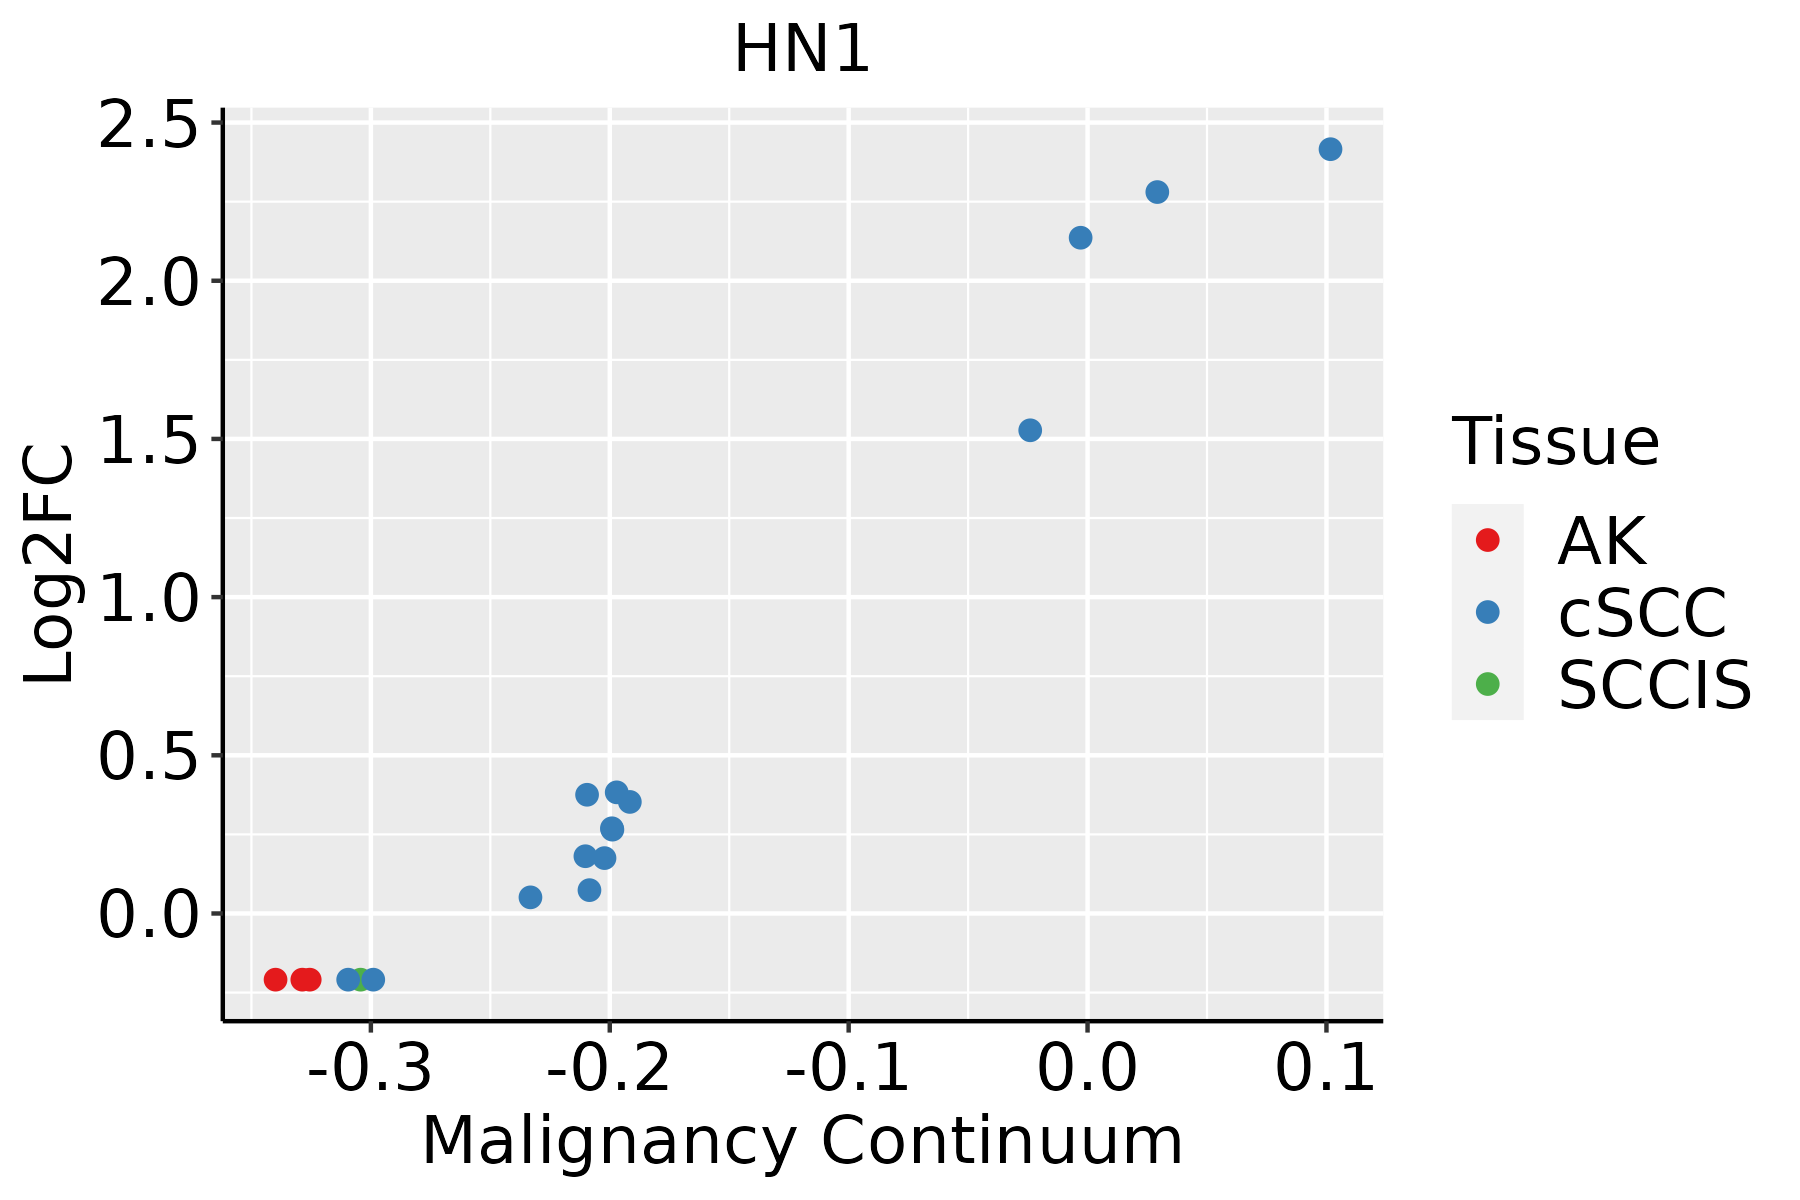
AK: Actinic keratosis
cSCC: Cutaneous squamous cell carcinoma
SCCIS:squamous cell carcinoma in situ
∗log2FC in expression of this searched gene in stem-like cells from each diseased tissue sample relative to stem-like cells in normal samples in each tissue plotted against the malignancy continuum. Samples are colored based on if they are from different disease stage.

Top

Malignant transformation related pathway analysis

check buttonFind out the enriched GO biological processes and KEGG pathways involved in transition from healthy to precancer to cancer
check button Figure of enriched GO biological processes.
TissueDisease StageEnriched GO biological Processes
ColorectumADGO analysis - Figure of enriched GO biological processes: Top 15 enriched GO BP terms are showed in the bar plot of each disease state in each tissue. Each row represents a significant GO biological process which is colored according to the -log10(p.adjust).
ColorectumSERGO analysis - Figure of enriched GO biological processes: Top 15 enriched GO BP terms are showed in the bar plot of each disease state in each tissue. Each row represents a significant GO biological process which is colored according to the -log10(p.adjust).
ColorectumMSSGO analysis - Figure of enriched GO biological processes: Top 15 enriched GO BP terms are showed in the bar plot of each disease state in each tissue. Each row represents a significant GO biological process which is colored according to the -log10(p.adjust).
ColorectumMSI-HGO analysis - Figure of enriched GO biological processes: Top 15 enriched GO BP terms are showed in the bar plot of each disease state in each tissue. Each row represents a significant GO biological process which is colored according to the -log10(p.adjust).
ColorectumFAPGO analysis - Figure of enriched GO biological processes: Top 15 enriched GO BP terms are showed in the bar plot of each disease state in each tissue. Each row represents a significant GO biological process which is colored according to the -log10(p.adjust).
∗Top 15 enriched GO BP terms are showed in the bar plot of each disease state in each tissue. Each row represents a significant GO biological process which is colored according to the -log10(p.adjust).
Page: 1 2 3 4 5 6 7 8 9 

check button Enriched GO biological processes.
GO IDTissueDisease StageDescriptionGene RatioBg Ratiopvaluep.adjustCount
GO:004217616EndometriumAEHregulation of protein catabolic process100/2100391/187239.58e-163.59e-13100
GO:190336216EndometriumAEHregulation of cellular protein catabolic process70/2100255/187235.40e-131.25e-1070
GO:001049816EndometriumAEHproteasomal protein catabolic process108/2100490/187232.73e-124.67e-10108
GO:190305016EndometriumAEHregulation of proteolysis involved in cellular protein catabolic process58/2100221/187233.58e-103.77e-0858
GO:006113616EndometriumAEHregulation of proteasomal protein catabolic process49/2100187/187238.64e-095.96e-0749
GO:000716310EndometriumAEHestablishment or maintenance of cell polarity54/2100218/187231.30e-088.47e-0754
GO:004217715EndometriumAEHnegative regulation of protein catabolic process34/2100121/187232.67e-071.17e-0534
GO:00074098EndometriumAEHaxonogenesis81/2100418/187235.54e-072.12e-0581
GO:00615648EndometriumAEHaxon development88/2100467/187236.39e-072.38e-0588
GO:190336310EndometriumAEHnegative regulation of cellular protein catabolic process24/210075/187231.18e-063.85e-0524
GO:00300109EndometriumAEHestablishment of cell polarity36/2100143/187232.19e-066.49e-0536
GO:00343299EndometriumAEHcell junction assembly78/2100420/187234.80e-061.24e-0478
GO:190305110EndometriumAEHnegative regulation of proteolysis involved in cellular protein catabolic process20/210064/187231.34e-052.88e-0420
GO:003133016EndometriumAEHnegative regulation of cellular catabolic process53/2100262/187231.40e-052.99e-0453
GO:00510567EndometriumAEHregulation of small GTPase mediated signal transduction59/2100302/187231.43e-053.03e-0459
GO:00482598EndometriumAEHregulation of receptor-mediated endocytosis28/2100110/187232.28e-054.35e-0428
GO:00072657EndometriumAEHRas protein signal transduction63/2100337/187233.09e-055.66e-0463
GO:00301009EndometriumAEHregulation of endocytosis44/2100211/187233.39e-056.05e-0444
GO:00068988EndometriumAEHreceptor-mediated endocytosis49/2100244/187233.54e-056.24e-0449
GO:000989515EndometriumAEHnegative regulation of catabolic process60/2100320/187234.32e-057.28e-0460
Page: 1 2 3 4 5 6 7 8 9 10 11 12 13 14 

check button Enriched KEGG pathways.
Pathway IDTissueDisease StageDescriptionGene RatioBg Ratiopvaluep.adjustqvalueCount
Page: 1 

Top

Cell-cell communication analysis

check buttonIdentification of potential cell-cell interactions between two cell types and their ligand-receptor pairs for different disease states
LigandReceptorLRpairPathwayTissueDisease Stage
Page: 1 

Top

Single-cell gene regulatory network inference analysis

check buttonFind out the significant the regulons (TFs) and the target genes of each regulon across cell types for different disease states
TFCell TypeTissueDisease StageTarget GeneRSSRegulon Activity
∗The dot plots of a searched regulon are shown for all cell subpopulations in each disease state of each tissue based on the regulon specific score inferred using pySCENIC and by calculating the average expression.
Page: 1 

Top

Somatic mutation of malignant transformation related genes

check buttonAnnotation of somatic variants for genes involved in malignant transformation
Hugo SymbolVariant ClassVariant ClassificationdbSNP RSHGVScHGVSpHGVSp ShortSWISSPROTBIOTYPESIFTPolyPhenTumor Sample BarcodeTissueHistologySexAgeStageTherapy TypesDrugsOutcome
HN1SNVMissense_Mutationrs765086350c.194N>Tp.Ser65Leup.S65LQ9UK76protein_codingdeleterious(0.01)benign(0.08)TCGA-LP-A7HU-01Cervixcervical & endocervical cancerFemale<65I/IIUnknownUnknownSD
HN1SNVMissense_Mutationnovelc.70N>Ap.Pro24Thrp.P24TQ9UK76protein_codingdeleterious(0)probably_damaging(0.998)TCGA-LP-A7HU-01Cervixcervical & endocervical cancerFemale<65I/IIUnknownUnknownSD
HN1SNVMissense_Mutationc.464N>Ap.Arg155Hisp.R155HQ9UK76protein_codingtolerated_low_confidence(0.08)benign(0.258)TCGA-AA-A01D-01Colorectumcolon adenocarcinomaFemale<65III/IVChemotherapycapecitabinePD
HN1SNVMissense_Mutationc.122N>Ap.Pro41Hisp.P41HQ9UK76protein_codingdeleterious(0)probably_damaging(0.925)TCGA-AP-A051-01Endometriumuterine corpus endometrioid carcinomaFemale>=65I/IIUnknownUnknownSD
HN1SNVMissense_Mutationrs758089157c.361C>Tp.Arg121Cysp.R121CQ9UK76protein_codingdeleterious_low_confidence(0.01)benign(0.319)TCGA-AX-A2HC-01Endometriumuterine corpus endometrioid carcinomaFemale<65III/IVChemotherapypaclitaxelPD
HN1SNVMissense_Mutationc.275C>Tp.Ser92Phep.S92FQ9UK76protein_codingdeleterious_low_confidence(0)possibly_damaging(0.471)TCGA-D1-A103-01Endometriumuterine corpus endometrioid carcinomaFemale>=65I/IIUnknownUnknownSD
HN1SNVMissense_Mutationrs371693377c.419C>Tp.Ala140Valp.A140VQ9UK76protein_codingtolerated_low_confidence(0.32)benign(0.003)TCGA-D1-A175-01Endometriumuterine corpus endometrioid carcinomaFemale<65I/IIChemotherapypaclitaxelSD
HN1SNVMissense_Mutationnovelc.73N>Tp.Gly25Cysp.G25CQ9UK76protein_codingdeleterious(0)probably_damaging(1)TCGA-DF-A2KN-01Endometriumuterine corpus endometrioid carcinomaFemaleUnknownI/IIUnknownUnknownSD
HN1insertionFrame_Shift_Insnovelc.415_416insCp.Leu139ProfsTer11p.L139Pfs*11Q9UK76protein_codingTCGA-EO-A3AU-01Endometriumuterine corpus endometrioid carcinomaFemale>=65I/IIUnknownUnknownPD
HN1SNVMissense_Mutationrs868058942c.64N>Tp.Arg22Trpp.R22WQ9UK76protein_codingdeleterious_low_confidence(0)probably_damaging(0.958)TCGA-BR-4370-01Stomachstomach adenocarcinomaFemale>=65I/IIUnknownUnknownSD
Page: 1 2 

Top

Related drugs of malignant transformation related genes

check buttonIdentification of chemicals and drugs interact with genes involved in malignant transfromation
(DGIdb 4.0)
Entrez IDSymbolCategoryInteraction TypesDrug Claim NameDrug NamePMIDs
Page: 1