
|
|||||
|
 | |
| |
| |
| |
| |
| |
|
Gene: HEATR1 |
Gene summary for HEATR1 |
| Gene information | Species | Human | Gene symbol | HEATR1 | Gene ID | 55127 |
| Gene name | HEAT repeat containing 1 | |
| Gene Alias | BAP28 | |
| Cytomap | 1q43 | |
| Gene Type | protein-coding | GO ID | GO:0000462 | UniProtAcc | A2VDI1 |
Top |
Malignant transformation analysis |
| Identification of the aberrant gene expression in precancerous and cancerous lesions by comparing the gene expression of stem-like cells in diseased tissues with normal stem cells |
| Entrez ID | Symbol | Replicates | Species | Organ | Tissue | Adj P-value | Log2FC | Malignancy |
| 55127 | HEATR1 | P61T-E | Human | Esophagus | ESCC | 2.92e-09 | 2.37e-01 | 0.099 |
| 55127 | HEATR1 | P62T-E | Human | Esophagus | ESCC | 1.04e-20 | 3.56e-01 | 0.1302 |
| 55127 | HEATR1 | P65T-E | Human | Esophagus | ESCC | 3.65e-13 | 1.75e-01 | 0.0978 |
| 55127 | HEATR1 | P74T-E | Human | Esophagus | ESCC | 6.97e-10 | 3.00e-01 | 0.1479 |
| 55127 | HEATR1 | P75T-E | Human | Esophagus | ESCC | 3.59e-19 | 2.95e-01 | 0.1125 |
| 55127 | HEATR1 | P76T-E | Human | Esophagus | ESCC | 1.65e-15 | 2.58e-01 | 0.1207 |
| 55127 | HEATR1 | P79T-E | Human | Esophagus | ESCC | 2.20e-11 | 2.29e-01 | 0.1154 |
| 55127 | HEATR1 | P80T-E | Human | Esophagus | ESCC | 2.31e-27 | 6.89e-01 | 0.155 |
| 55127 | HEATR1 | P82T-E | Human | Esophagus | ESCC | 2.08e-08 | 2.95e-01 | 0.1072 |
| 55127 | HEATR1 | P83T-E | Human | Esophagus | ESCC | 4.66e-19 | 5.57e-01 | 0.1738 |
| 55127 | HEATR1 | P84T-E | Human | Esophagus | ESCC | 3.49e-02 | 1.25e-01 | 0.0933 |
| 55127 | HEATR1 | P89T-E | Human | Esophagus | ESCC | 3.53e-08 | 6.07e-01 | 0.1752 |
| 55127 | HEATR1 | P91T-E | Human | Esophagus | ESCC | 1.10e-11 | 9.25e-01 | 0.1828 |
| 55127 | HEATR1 | P107T-E | Human | Esophagus | ESCC | 4.11e-31 | 6.98e-01 | 0.171 |
| 55127 | HEATR1 | P126T-E | Human | Esophagus | ESCC | 1.08e-02 | 3.50e-01 | 0.1125 |
| 55127 | HEATR1 | P127T-E | Human | Esophagus | ESCC | 3.08e-13 | 1.94e-01 | 0.0826 |
| 55127 | HEATR1 | P128T-E | Human | Esophagus | ESCC | 1.89e-21 | 6.18e-01 | 0.1241 |
| 55127 | HEATR1 | P130T-E | Human | Esophagus | ESCC | 4.15e-53 | 9.30e-01 | 0.1676 |
| 55127 | HEATR1 | HCC1_Meng | Human | Liver | HCC | 7.81e-57 | 1.12e-01 | 0.0246 |
| 55127 | HEATR1 | HCC2_Meng | Human | Liver | HCC | 4.03e-09 | 3.53e-02 | 0.0107 |
| Page: 1 2 3 4 5 |
| Tissue | Expression Dynamics | Abbreviation |
| Esophagus |  | ESCC: Esophageal squamous cell carcinoma |
| HGIN: High-grade intraepithelial neoplasias | ||
| LGIN: Low-grade intraepithelial neoplasias | ||
| Liver | 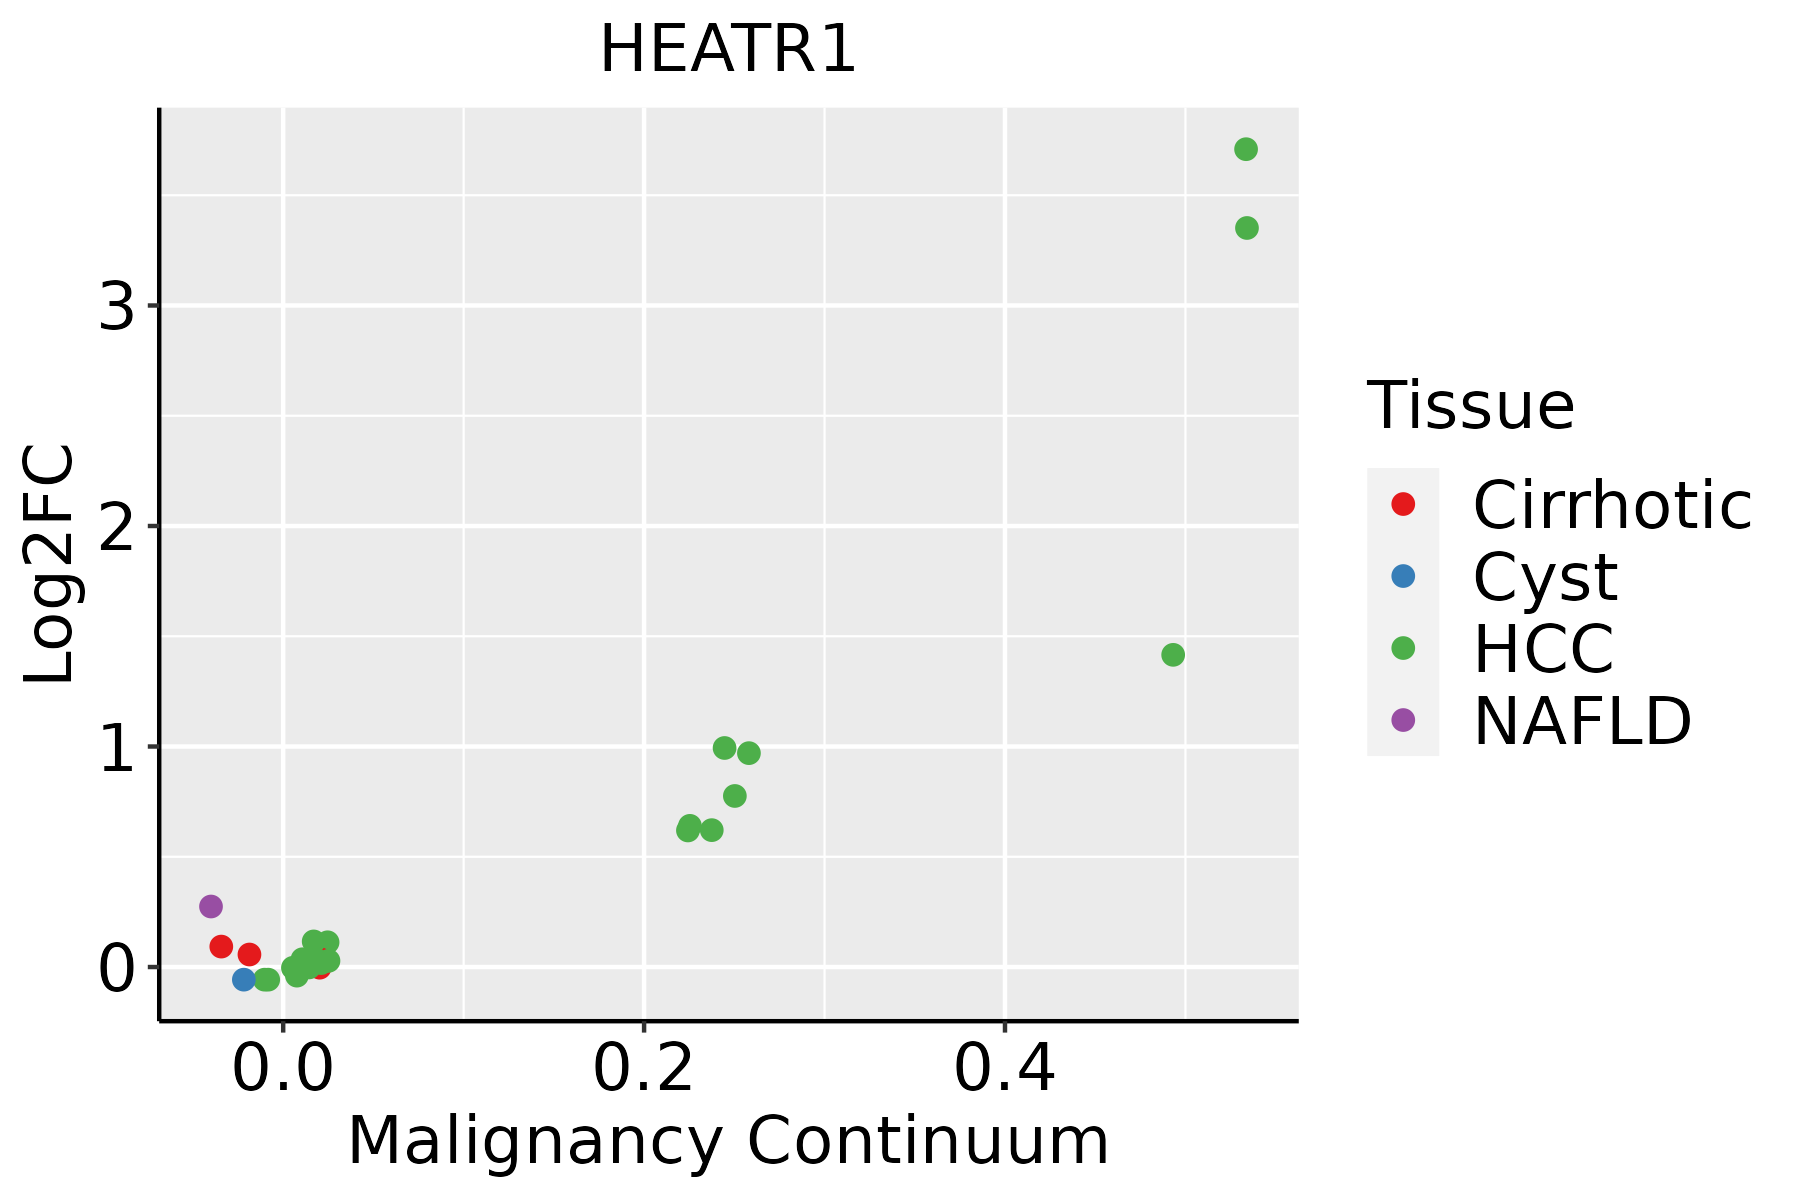 | HCC: Hepatocellular carcinoma |
| NAFLD: Non-alcoholic fatty liver disease | ||
| Oral Cavity | 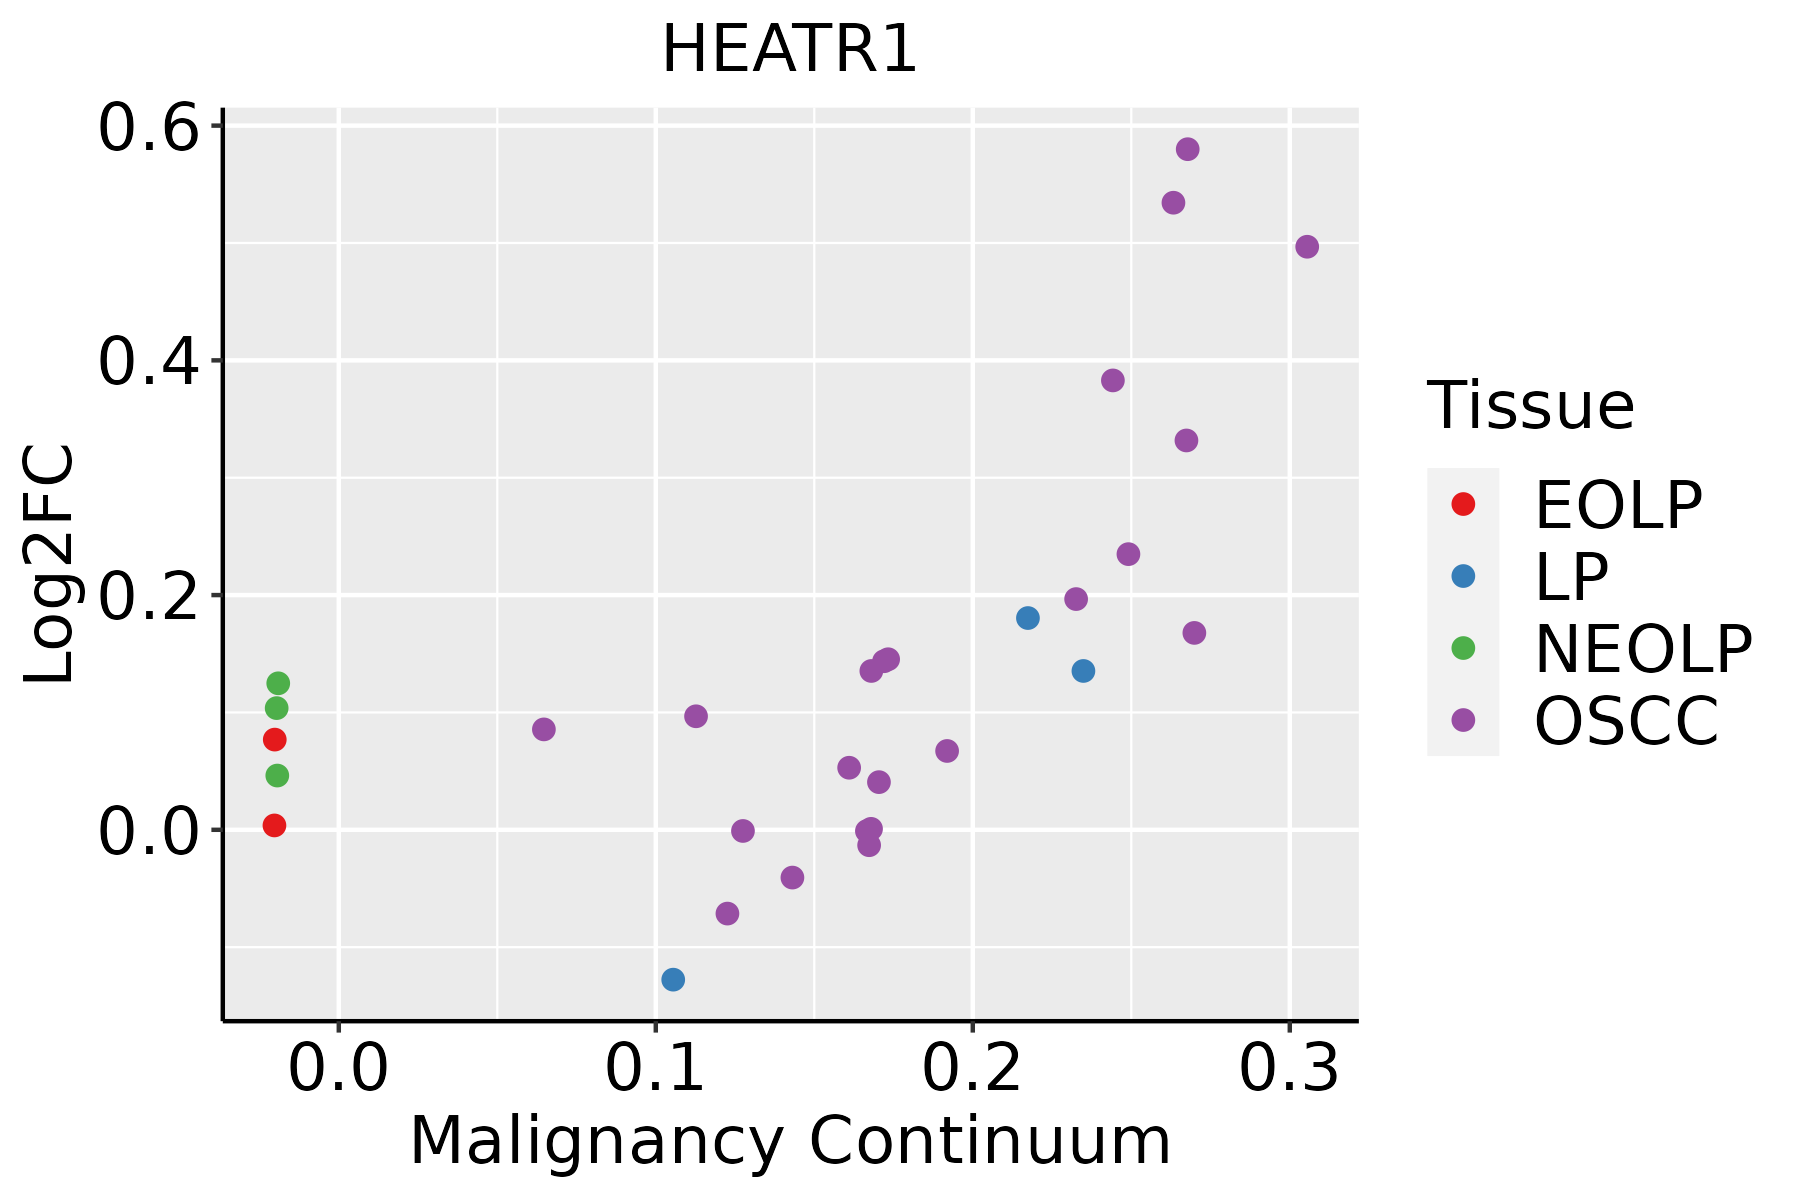 | EOLP: Erosive Oral lichen planus |
| LP: leukoplakia | ||
| NEOLP: Non-erosive oral lichen planus | ||
| OSCC: Oral squamous cell carcinoma | ||
| Skin | 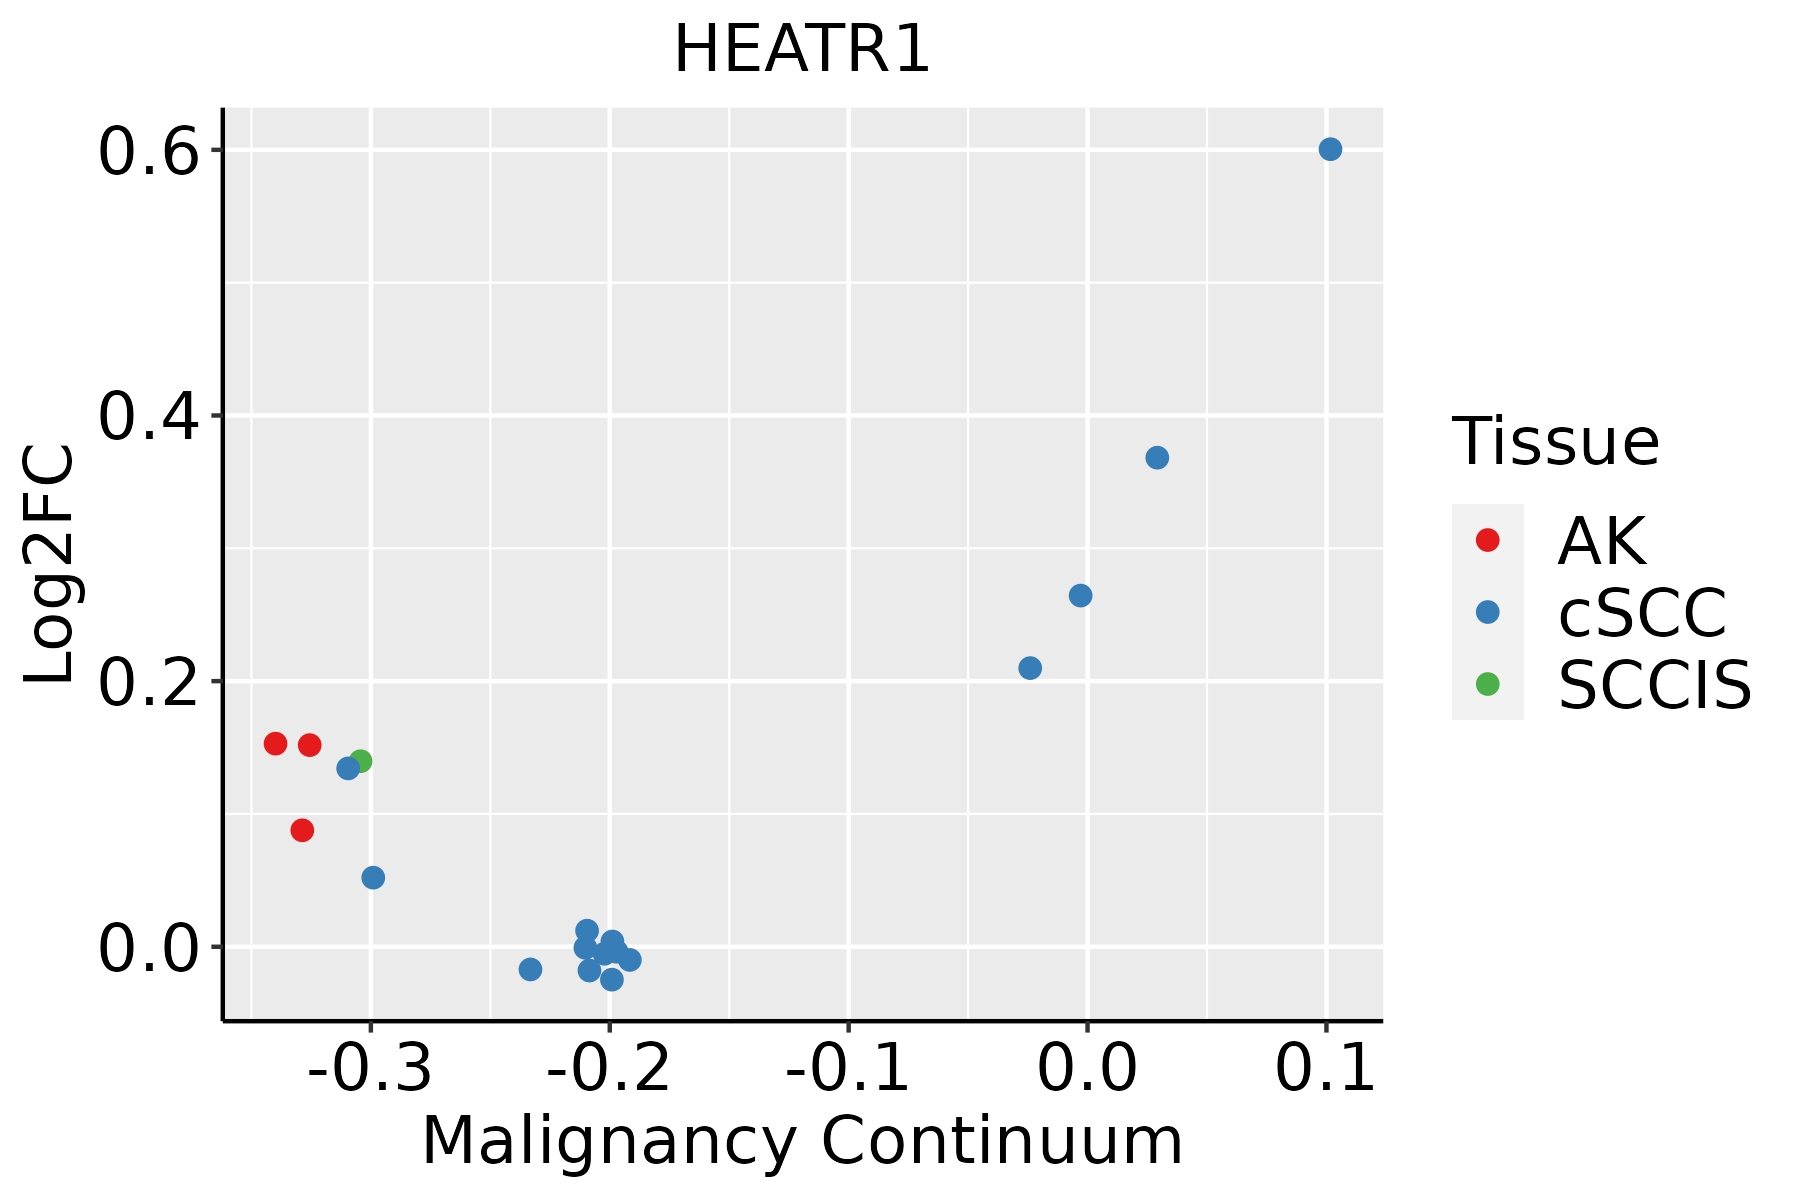 | AK: Actinic keratosis |
| cSCC: Cutaneous squamous cell carcinoma | ||
| SCCIS:squamous cell carcinoma in situ | ||
| Thyroid | 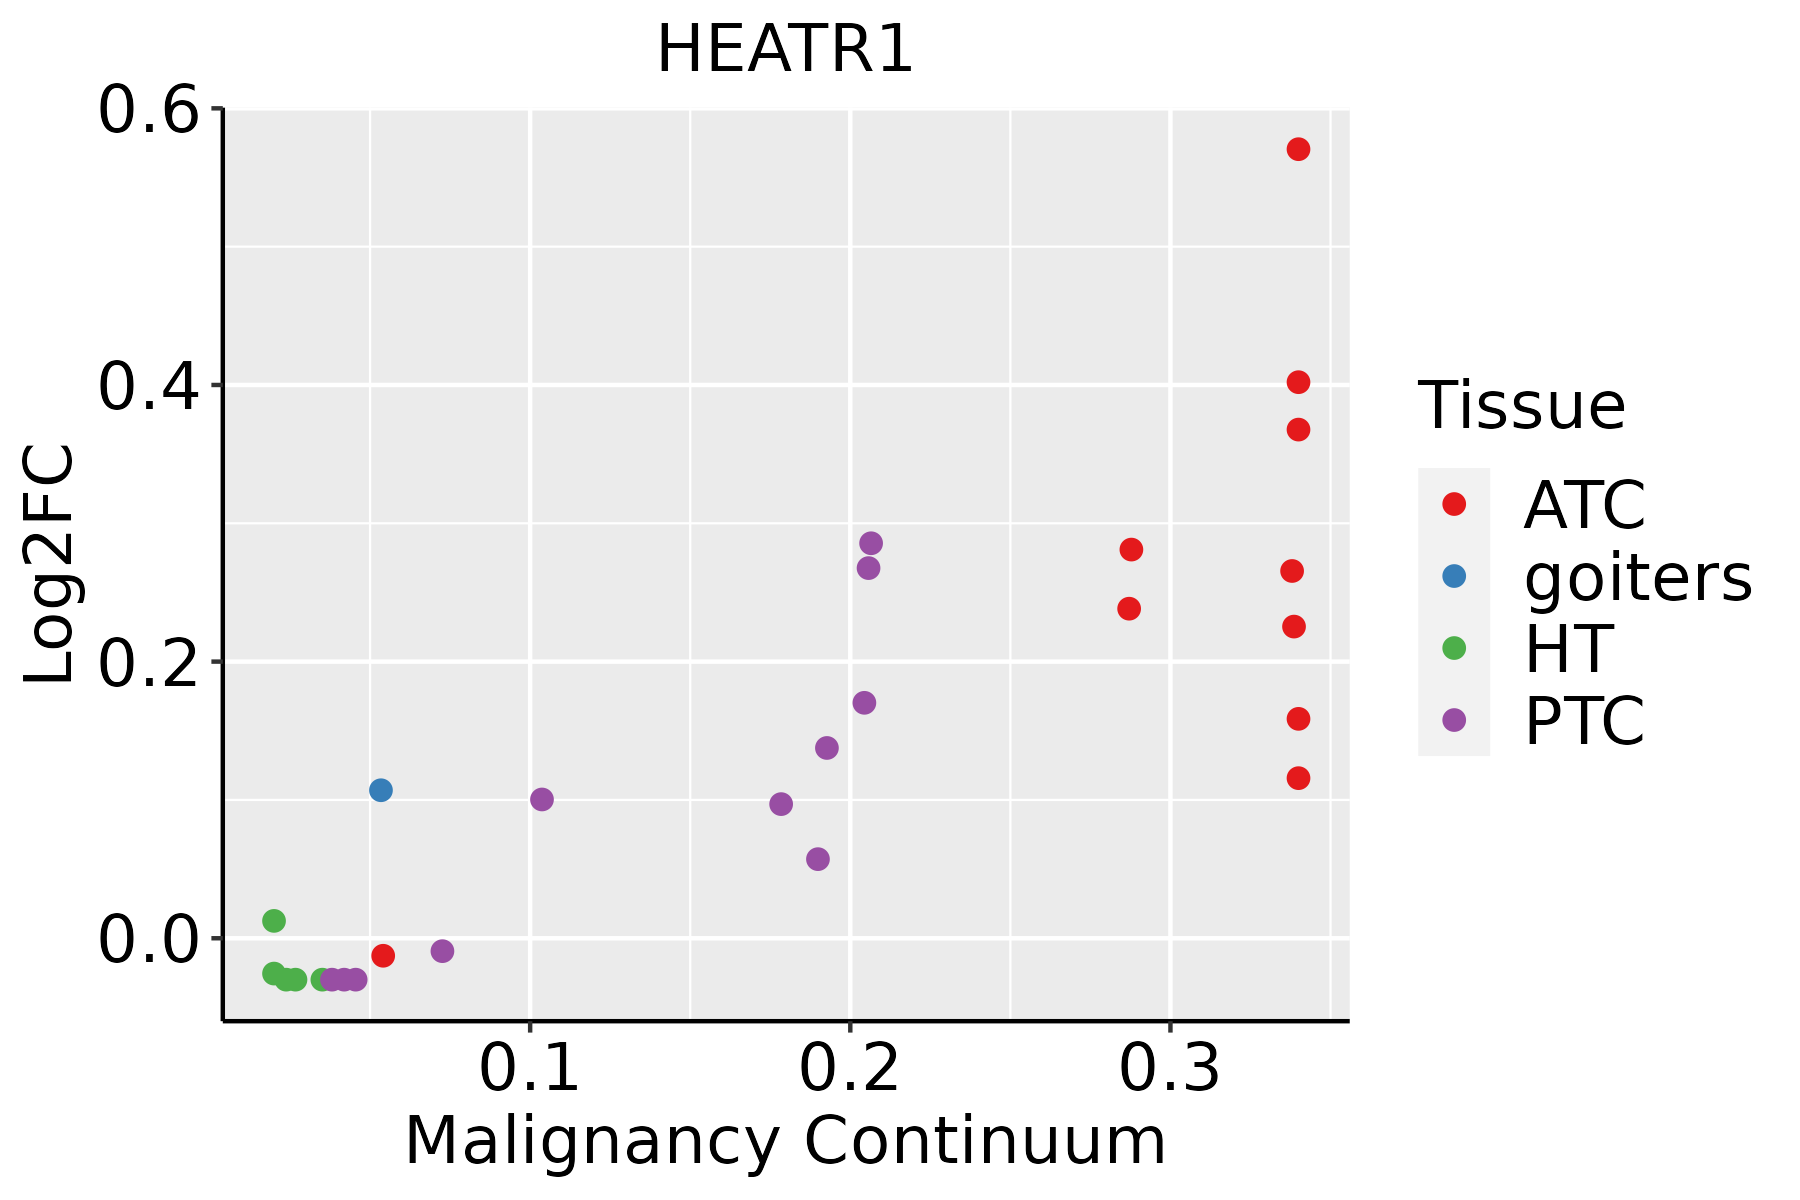 | ATC: Anaplastic thyroid cancer |
| HT: Hashimoto's thyroiditis | ||
| PTC: Papillary thyroid cancer |
| ∗log2FC in expression of this searched gene in stem-like cells from each diseased tissue sample relative to stem-like cells in normal samples in each tissue plotted against the malignancy continuum. Samples are colored based on if they are from different disease stage. |
Top |
Malignant transformation related pathway analysis |
| Find out the enriched GO biological processes and KEGG pathways involved in transition from healthy to precancer to cancer |
| Tissue | Disease Stage | Enriched GO biological Processes |
| Colorectum | AD |  |
| Colorectum | SER |  |
| Colorectum | MSS |  |
| Colorectum | MSI-H |  |
| Colorectum | FAP |  |
| ∗Top 15 enriched GO BP terms are showed in the bar plot of each disease state in each tissue. Each row represents a significant GO biological process which is colored according to the -log10(p.adjust). |
| Page: 1 2 3 4 5 6 7 8 9 |
| GO ID | Tissue | Disease Stage | Description | Gene Ratio | Bg Ratio | pvalue | p.adjust | Count |
| GO:0022613111 | Esophagus | ESCC | ribonucleoprotein complex biogenesis | 365/8552 | 463/18723 | 1.74e-49 | 1.11e-45 | 365 |
| GO:0042254111 | Esophagus | ESCC | ribosome biogenesis | 252/8552 | 299/18723 | 3.27e-44 | 1.04e-40 | 252 |
| GO:003447015 | Esophagus | ESCC | ncRNA processing | 300/8552 | 395/18723 | 3.09e-35 | 3.26e-32 | 300 |
| GO:0016072110 | Esophagus | ESCC | rRNA metabolic process | 197/8552 | 236/18723 | 1.31e-33 | 1.18e-30 | 197 |
| GO:0006364110 | Esophagus | ESCC | rRNA processing | 189/8552 | 225/18723 | 4.88e-33 | 3.87e-30 | 189 |
| GO:003466012 | Esophagus | ESCC | ncRNA metabolic process | 346/8552 | 485/18723 | 4.35e-31 | 2.51e-28 | 346 |
| GO:0042274111 | Esophagus | ESCC | ribosomal small subunit biogenesis | 67/8552 | 73/18723 | 6.62e-17 | 5.38e-15 | 67 |
| GO:00304904 | Esophagus | ESCC | maturation of SSU-rRNA | 45/8552 | 50/18723 | 5.07e-11 | 1.63e-09 | 45 |
| GO:00004623 | Esophagus | ESCC | maturation of SSU-rRNA from tricistronic rRNA transcript (SSU-rRNA, 5.8S rRNA, LSU-rRNA) | 32/8552 | 37/18723 | 2.96e-07 | 4.23e-06 | 32 |
| GO:00063602 | Esophagus | ESCC | transcription by RNA polymerase I | 42/8552 | 55/18723 | 3.41e-06 | 3.78e-05 | 42 |
| GO:00063564 | Esophagus | ESCC | regulation of transcription by RNA polymerase I | 27/8552 | 34/18723 | 6.01e-05 | 4.62e-04 | 27 |
| GO:00459432 | Esophagus | ESCC | positive regulation of transcription by RNA polymerase I | 19/8552 | 23/18723 | 3.12e-04 | 1.85e-03 | 19 |
| GO:2000234 | Esophagus | ESCC | positive regulation of rRNA processing | 9/8552 | 10/18723 | 5.09e-03 | 1.92e-02 | 9 |
| GO:002261322 | Liver | HCC | ribonucleoprotein complex biogenesis | 355/7958 | 463/18723 | 7.76e-52 | 4.92e-48 | 355 |
| GO:004225422 | Liver | HCC | ribosome biogenesis | 246/7958 | 299/18723 | 4.99e-46 | 1.58e-42 | 246 |
| GO:00344702 | Liver | HCC | ncRNA processing | 293/7958 | 395/18723 | 4.26e-38 | 6.76e-35 | 293 |
| GO:001607212 | Liver | HCC | rRNA metabolic process | 193/7958 | 236/18723 | 1.26e-35 | 1.14e-32 | 193 |
| GO:000636421 | Liver | HCC | rRNA processing | 185/7958 | 225/18723 | 8.14e-35 | 6.45e-32 | 185 |
| GO:00346601 | Liver | HCC | ncRNA metabolic process | 332/7958 | 485/18723 | 1.48e-31 | 7.80e-29 | 332 |
| GO:004227422 | Liver | HCC | ribosomal small subunit biogenesis | 65/7958 | 73/18723 | 1.09e-16 | 9.92e-15 | 65 |
| Page: 1 2 3 4 |
| Pathway ID | Tissue | Disease Stage | Description | Gene Ratio | Bg Ratio | pvalue | p.adjust | qvalue | Count |
| Page: 1 |
Top |
Cell-cell communication analysis |
| Identification of potential cell-cell interactions between two cell types and their ligand-receptor pairs for different disease states |
| Ligand | Receptor | LRpair | Pathway | Tissue | Disease Stage |
| Page: 1 |
Top |
Single-cell gene regulatory network inference analysis |
| Find out the significant the regulons (TFs) and the target genes of each regulon across cell types for different disease states |
| TF | Cell Type | Tissue | Disease Stage | Target Gene | RSS | Regulon Activity |
| ∗The dot plots of a searched regulon are shown for all cell subpopulations in each disease state of each tissue based on the regulon specific score inferred using pySCENIC and by calculating the average expression. |
| Page: 1 |
Top |
Somatic mutation of malignant transformation related genes |
| Annotation of somatic variants for genes involved in malignant transformation |
| Hugo Symbol | Variant Class | Variant Classification | dbSNP RS | HGVSc | HGVSp | HGVSp Short | SWISSPROT | BIOTYPE | SIFT | PolyPhen | Tumor Sample Barcode | Tissue | Histology | Sex | Age | Stage | Therapy Types | Drugs | Outcome |
| HEATR1 | SNV | Missense_Mutation | c.3000G>C | p.Leu1000Phe | p.L1000F | Q9H583 | protein_coding | deleterious(0.03) | probably_damaging(0.945) | TCGA-A2-A0T0-01 | Breast | breast invasive carcinoma | Female | <65 | I/II | Chemotherapy | taxotere | SD | |
| HEATR1 | SNV | Missense_Mutation | novel | c.1193G>A | p.Ser398Asn | p.S398N | Q9H583 | protein_coding | tolerated(0.26) | benign(0.047) | TCGA-A2-A25A-01 | Breast | breast invasive carcinoma | Female | <65 | I/II | Unspecific | Cytoxan | SD |
| HEATR1 | SNV | Missense_Mutation | c.6345A>C | p.Glu2115Asp | p.E2115D | Q9H583 | protein_coding | deleterious(0.01) | probably_damaging(0.999) | TCGA-A7-A0DB-01 | Breast | breast invasive carcinoma | Female | <65 | I/II | Hormone Therapy | arimidex | SD | |
| HEATR1 | SNV | Missense_Mutation | c.2183N>A | p.Arg728Lys | p.R728K | Q9H583 | protein_coding | tolerated(0.33) | benign(0.003) | TCGA-A8-A094-01 | Breast | breast invasive carcinoma | Female | >=65 | I/II | Unknown | Unknown | SD | |
| HEATR1 | SNV | Missense_Mutation | c.927G>C | p.Gln309His | p.Q309H | Q9H583 | protein_coding | tolerated(0.05) | possibly_damaging(0.803) | TCGA-A8-A095-01 | Breast | breast invasive carcinoma | Female | <65 | I/II | Chemotherapy | 5-fluorouracil | CR | |
| HEATR1 | SNV | Missense_Mutation | c.196G>C | p.Glu66Gln | p.E66Q | Q9H583 | protein_coding | tolerated(0.6) | benign(0.025) | TCGA-AC-A23C-01 | Breast | breast invasive carcinoma | Female | <65 | I/II | Chemotherapy | chemo | CR | |
| HEATR1 | SNV | Missense_Mutation | c.3865N>C | p.Val1289Leu | p.V1289L | Q9H583 | protein_coding | deleterious(0) | possibly_damaging(0.872) | TCGA-AC-A5XS-01 | Breast | breast invasive carcinoma | Female | >=65 | I/II | Hormone Therapy | femara | SD | |
| HEATR1 | SNV | Missense_Mutation | novel | c.5662G>A | p.Glu1888Lys | p.E1888K | Q9H583 | protein_coding | tolerated(0.46) | benign(0.047) | TCGA-AO-A0JB-01 | Breast | breast invasive carcinoma | Female | <65 | III/IV | Chemotherapy | cyclophosphamide | SD |
| HEATR1 | SNV | Missense_Mutation | novel | c.3098A>G | p.Gln1033Arg | p.Q1033R | Q9H583 | protein_coding | tolerated(0.62) | benign(0.033) | TCGA-BH-A18G-01 | Breast | breast invasive carcinoma | Female | >=65 | I/II | Unknown | Unknown | SD |
| HEATR1 | SNV | Missense_Mutation | novel | c.2213A>G | p.Lys738Arg | p.K738R | Q9H583 | protein_coding | tolerated(0.36) | benign(0) | TCGA-BH-A18G-01 | Breast | breast invasive carcinoma | Female | >=65 | I/II | Unknown | Unknown | SD |
| Page: 1 2 3 4 5 6 7 8 9 10 11 12 13 14 15 16 17 18 19 20 21 22 23 24 |
Top |
Related drugs of malignant transformation related genes |
| Identification of chemicals and drugs interact with genes involved in malignant transfromation |
| (DGIdb 4.0) |
| Entrez ID | Symbol | Category | Interaction Types | Drug Claim Name | Drug Name | PMIDs |
| Page: 1 |

Copyright 2023-Present -The University of Texas Health Science Center at Houston |